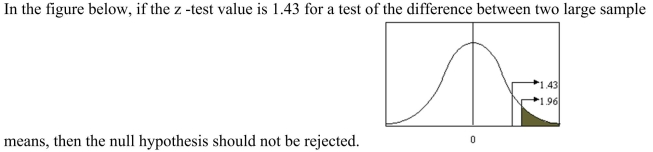
Deck 8: Testing the Difference Between Two Means, Two Proportions, and Two Variances
Full screen (f)
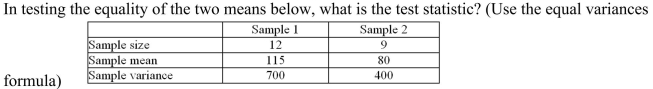
Question
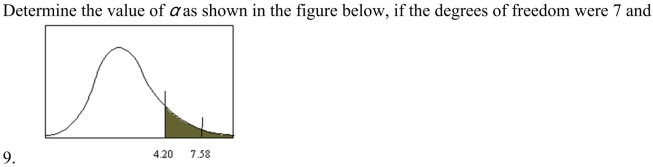
A) 3.00
B) 4.28
C) 12.85
D) 2.00
Question
Question
Question
Question
Question
Question
Question
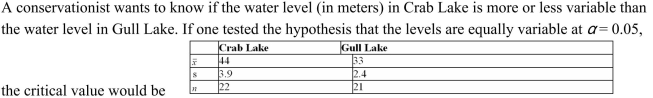
Calculate the critical value. Use  Refer To: 09-18
A) -1.65
B) -2.33
C) -2.58
D) -1.96
Refer To: 09-18A) -1.65
B) -2.33
C) -2.58
D) -1.96
Question
A) 7.85
B) 0.33
C) 0.39
D) 2.58
Question
The critical value for a two-tailed F -test is 2.65, when  , the sample size from which the variance
for the numerator was obtained = 10, and the sample size from which the variance for the denominator
was obtained = 15.
, the sample size from which the variancefor the numerator was obtained = 10, and the sample size from which the variance for the denominator
was obtained = 15.
Question
Question
Question
The critical value for a one-tailed right F -test is 2.57, when  , the degrees of freedom for the
numerator = 15, and the degrees of freedom for the denominator = 20.
, the degrees of freedom for thenumerator = 15, and the degrees of freedom for the denominator = 20.
Question
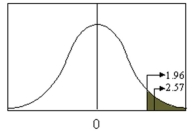
If the test value in the figure below, for a test of the difference between two large sample means, is 2.57 when the critical value is 1.96, what decision about the hypothesis should be made?
A) reject the null hypothesis
B) accept the null hypothesis
C) reject the alternative hypothesis
D) not enough information
A) reject the null hypothesis
B) accept the null hypothesis
C) reject the alternative hypothesis
D) not enough information
Question
Question
Question
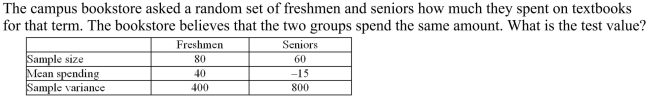
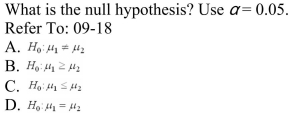
What is the test value? Use  Refer To: 09-18
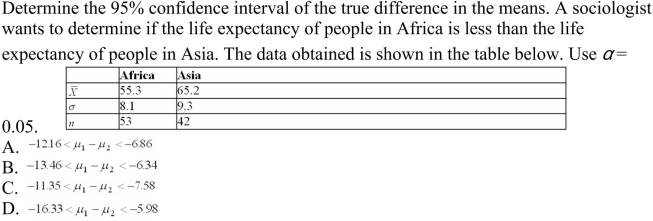
A) -6.86
B) -3.70
C) -4.13
D) -5.45
Refer To: 09-18A) -6.86
B) -3.70
C) -4.13
D) -5.45
Question
Question
Question
 The standard error of difference of two large (independent) sample means is
 Question
Question
Question
A) Yes, because the test value -8.45 is outside the interval (-1.96, 1.96)
B) Yes, because the test value -2.86 is outside the interval (-1.96, 1.96)
C) Yes, because the test value 71.43 is outside the interval (-1.96, 1.96)
D) No, because the test value -0.03 is inside the interval (-1.96, 1.96)
Question
A) -2.36
B) -0.22
C) -0.55
D) -4.38
Question
Question
What is the critical value for a two-tailed F -test with  when the sample size from which the variance for the numerator was obtained was 10, and the sample size from which the denominator was
Obtained was 24?
A) 2.27
B) 2.25
C) 2.32
D) 2.30
when the sample size from which the variance for the numerator was obtained was 10, and the sample size from which the denominator wasObtained was 24?
A) 2.27
B) 2.25
C) 2.32
D) 2.30
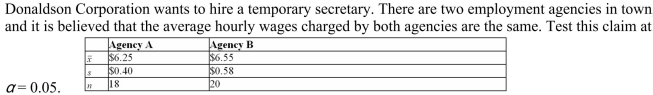
Question
A) The data do not support the claim because the test value 0.94 is less than 1.64.
B) The data do not support the claim because the test value 0.94 is less than 1.96.
C) The data support the claim because the test value 1.94 is less than 1.96.
D) The data support the claim because the test value 1.94 is greater than 1.65.
Question
A) Fail to reject the hypothesis because the test value 3.00 is less than the critical value 3.01.
B) Reject the hypothesis because the test value 3.00 is less than the critical value 3.01.
C) Fail to reject the hypothesis because the test value 9.00 is greater than the critical value 2.88.
D) Reject the hypothesis because the test value 9.00 is greater than the critical value 2.88.
Question
Question
Compute the critical value for a right-tailed F -test with 
A) 2.12
B) 2.23
C) 2.20
D) 2.16
A) 2.12
B) 2.23
C) 2.20
D) 2.16
Question
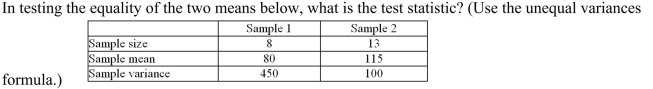
What is the critical value? Use  (Use the variances unequal formula.)
A) -1.761
B) -2.045
C) -1.697
D) -1.703
(Use the variances unequal formula.)A) -1.761
B) -2.045
C) -1.697
D) -1.703
Question
A) 0.01
B) 0.025
C) 0.05
D) 0.1
Question
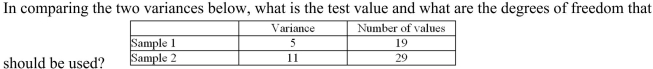
A) test value = 0.45, degrees of freedom = 19 and 29
B) test value = 0.45, degrees of freedom = 18 and 28
C) test value = 2.20, degrees of freedom = 28 and 18
D) test value = 2.20, degrees of freedom = 29 and 19
Question
Question
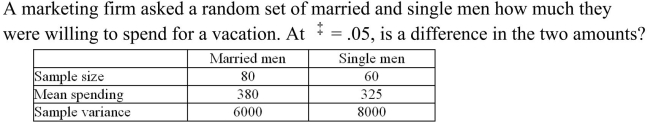
A) No, because the test value 0.26 is inside the interval (-1.96, 1.96)
B) Yes, because the test value 3.81 is outside the interval (-1.96, 1.96)
C) Yes, because the test value 1.33 is inside the interval (-1.96, 1.96)
D) No, because the test value 1.33 is outside the interval (-1.96, 1.96)
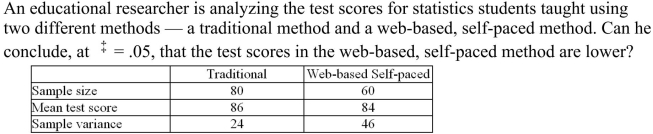
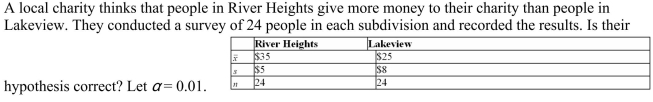
Question
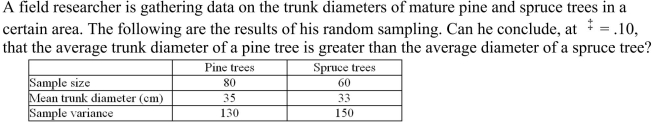
A) The data do not support the claim because the test value 0.48 is less than 1.28.
B) The data do not support the claim because the test value 0.98 is less than 1.28.
C) The data do not support the claim because the test value 0.98 is less than 1.64.
D) The data do not support the claim because the test value 0.48 is less than 1.64.
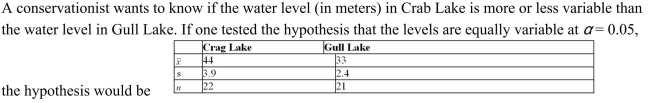
Question
A car salesman claims that the variance of prices on convertibles is higher than the variance on station wagons. The standard deviation of 16 convertibles is $6,800 and the standard deviation of 24 station
Wagons is $3,900. For what is the test value?
A) 3.00
B) 3.04
C) 2.78
D) 2.33
Wagons is $3,900. For
what is the test value?A) 3.00
B) 3.04
C) 2.78
D) 2.33
Question
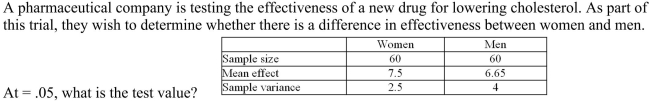
What is the test value? Use  . (Use the variances unequal formula.)
A) -6.97
B) -2.50
C) -4.53
D) -2.54
. (Use the variances unequal formula.)A) -6.97
B) -2.50
C) -4.53
D) -2.54
Question
Question
A) 3.31
B) 1.75
C) 0.31
D) 2.31
Question
Question
Question
Question
Question
A researcher wanted to determine if using an octane booster would increase gasoline mileage. A random
sample of seven cars was selected; the cars were driven for two weeks without the booster and two weeks
with the booster.
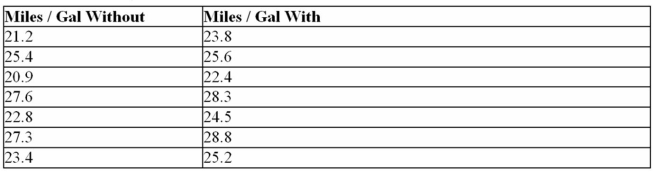
State the alternative hypothesis.
sample of seven cars was selected; the cars were driven for two weeks without the booster and two weeks
with the booster.
State the alternative hypothesis.
Question
In comparing the two standard deviations below, what is the test value and what are the degrees of freedom that should be used? 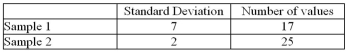
A) test value = 3.50, degrees of freedom = 17 and 25
B) test value = 3.50, degrees of freedom = 16 and 24
C) test value = 12.25, degrees of freedom = 17 and 25
D) test value = 12.25, degrees of freedom = 16 and 24
A) test value = 3.50, degrees of freedom = 17 and 25
B) test value = 3.50, degrees of freedom = 16 and 24
C) test value = 12.25, degrees of freedom = 17 and 25
D) test value = 12.25, degrees of freedom = 16 and 24
Question
Question
A researcher wanted to determine if using an octane booster would increase gasoline mileage. A random
sample of seven cars was selected; the cars were driven for two weeks without the booster and two weeks
with the booster.
What is the critical value using ?
?
A) -1.782
B) -1.761
C) -1.943
D) -1.895
sample of seven cars was selected; the cars were driven for two weeks without the booster and two weeks
with the booster.
What is the critical value using
?A) -1.782
B) -1.761
C) -1.943
D) -1.895
Question
A marketing firm asked a random set of married women and married men how much they were willing to spend for jewellery as a present for their spouse. Can the firm conclude, at  , that
Each of the two groups has a different willingness to spend? (Use the unequal variances formula.)
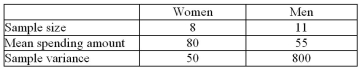
A) No, because the test value 0.32 is inside the interval (-2.31, 2.31)
B) Yes, because the test value 2.81 is outside the interval (-2.36, 2.36)
C) Yes, because the test value 16.00 is inside the interval (-2.31, 2.31)
D) No, because the test value 16.00 is outside the interval (-2.36, 2.36)
, thatEach of the two groups has a different willingness to spend? (Use the unequal variances formula.)
A) No, because the test value 0.32 is inside the interval (-2.31, 2.31)
B) Yes, because the test value 2.81 is outside the interval (-2.36, 2.36)
C) Yes, because the test value 16.00 is inside the interval (-2.31, 2.31)
D) No, because the test value 16.00 is outside the interval (-2.36, 2.36)
Question
One poll found that 40% of male voters will support a candidate while another found that 48% of female voters will be in support. To test whether this candidate has equal levels of support between male and
Female voters, the alternative hypothesis should be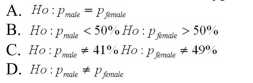
Female voters, the alternative hypothesis should be
Question
Question
Question
A researcher wanted to determine if using an octane booster would increase gasoline mileage. A random
sample of seven cars was selected; the cars were driven for two weeks without the booster and two weeks
with the booster.
A running coach wanted to see whether runners ran faster after eating spaghetti the night before a race. Twenty-four random runners were chosen for this study. They ran a 5-kilometre race after having a
Normal dinner the night before, and then a week later, re-ran the same race after having a spaghetti dinner
The night before. Their results (in seconds) are in the table below. At , what is the test value for
This test?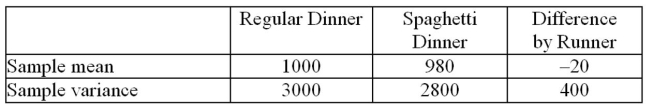
A) -3.41
B) -1.00
C) -0.26
D) -4.90
sample of seven cars was selected; the cars were driven for two weeks without the booster and two weeks
with the booster.
A running coach wanted to see whether runners ran faster after eating spaghetti the night before a race. Twenty-four random runners were chosen for this study. They ran a 5-kilometre race after having a
Normal dinner the night before, and then a week later, re-ran the same race after having a spaghetti dinner
The night before. Their results (in seconds) are in the table below. At
, what is the test value forThis test?
A) -3.41
B) -1.00
C) -0.26
D) -4.90
Question
A researcher wanted to determine if using an octane booster would increase gasoline mileage. A random
sample of seven cars was selected; the cars were driven for two weeks without the booster and two weeks
with the booster.
Determine the mean of the difference.
A) -0.96
B) -6.3
C) 1.43
D) -1.43
sample of seven cars was selected; the cars were driven for two weeks without the booster and two weeks
with the booster.
Determine the mean of the difference.
A) -0.96
B) -6.3
C) 1.43
D) -1.43
Question
A) 5.78
B) 8.43
C) 71.14
D) 17.97
Question
One poll found that 41% of male voters will support a candidate while another found that 49% of female voters will be in support. To test whether this candidate has equal levels of support between male and
Female voters, the null hypothesis should be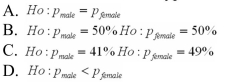
Female voters, the null hypothesis should be
Question
Question
A researcher wanted to determine if using an octane booster would increase gasoline mileage. A random
sample of seven cars was selected; the cars were driven for two weeks without the booster and two weeks
with the booster.
Compute the standard deviation of the difference.
A) 0.78
B) 0.69
C) 0.87
D) 0.48
sample of seven cars was selected; the cars were driven for two weeks without the booster and two weeks
with the booster.
Compute the standard deviation of the difference.
A) 0.78
B) 0.69
C) 0.87
D) 0.48
Question
A) 2.25
B) 2.42
C) 2.64
D) 2.88
Question
A researcher wanted to determine if using an octane booster would increase gasoline mileage. A random
sample of seven cars was selected; the cars were driven for two weeks without the booster and two weeks
with the booster.
A dietician investigated whether apples turned brown at different rates when exposed to air after being washed in hot water or in cold water. She took 12 random apples and cut each in half. She washed one
Half of each apple in hot water and the other half in cold water, and then put both halves out in a tray. Her
Results (in hours until turning a particular shade of brown) are in the table below. At , did she see a
Difference between the two treatments?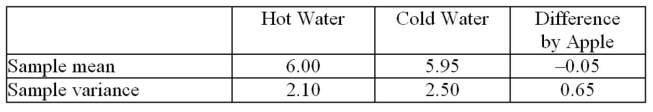
A) No, because the test value -0.06 is inside the range (-3.05, 3.05).
B) No, because the test value -0.21 is inside the range (-3.11, 3.11).
C) No, because the test value -0.21 is inside the range (-3.05, 3.05).
D) No, because the test value -0.06 is inside the range (-3.11, 3.11).
sample of seven cars was selected; the cars were driven for two weeks without the booster and two weeks
with the booster.
A dietician investigated whether apples turned brown at different rates when exposed to air after being washed in hot water or in cold water. She took 12 random apples and cut each in half. She washed one
Half of each apple in hot water and the other half in cold water, and then put both halves out in a tray. Her
Results (in hours until turning a particular shade of brown) are in the table below. At
, did she see aDifference between the two treatments?
A) No, because the test value -0.06 is inside the range (-3.05, 3.05).
B) No, because the test value -0.21 is inside the range (-3.11, 3.11).
C) No, because the test value -0.21 is inside the range (-3.05, 3.05).
D) No, because the test value -0.06 is inside the range (-3.11, 3.11).
Question
Question
Question
Question
 ________________________________________
 Question
Question
Question
Question
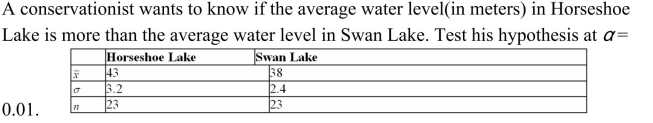
A study on the oxygen consumption rate (OCR) of sea cucumbers involved a random sample of size 10 at 15oC and second random sample of size 7 kept at 18oC. If one tested the hypothesis that this range of
Temperature had no effect on the OCR (assume equal variability) the critical value would be (assume
 .05)
.05)
A) 1.746
B) 1.761
C) 2.131
D) 2.145
Temperature had no effect on the OCR (assume equal variability) the critical value would be (assume
.05)A) 1.746
B) 1.761
C) 2.131
D) 2.145
Question

Question
Question
Question
The critical value for a left-tailed t-test for dependent samples is __________ when the degrees of
freedom = 7 and
freedom = 7 and
Question
In a study comparing the systolic blood pressure of individuals sitting and standing, 10 subjects had their blood pressure measured in the two conditions. The investigator planned to test the hypothesis that the
Mean blood pressure readings are the same sitting and standing (the subjects remained in each position
For 5 minutes). If the investigator tests at the 10% level of significance, the rejection region would be
Mean blood pressure readings are the same sitting and standing (the subjects remained in each position
For 5 minutes). If the investigator tests at the 10% level of significance, the rejection region would be
Question

Unlock Deck
Sign up to unlock the cards in this deck!
Unlock Deck
Unlock Deck
1/74
Play
Full screen (f)
Deck 8: Testing the Difference Between Two Means, Two Proportions, and Two Variances
1
A) 3.00
B) 4.28
C) 12.85
D) 2.00
C
2
B
3
False
4
When finding the F -test value, the smaller of the variances is placed in the numerator.
Unlock Deck
Unlock for access to all 74 flashcards in this deck.
Unlock Deck
k this deck
5
Samples are independent when they are not related.
Unlock Deck
Unlock for access to all 74 flashcards in this deck.
Unlock Deck
k this deck
6
When subjects are matched according to one variable, the matching process does not eliminate the
influence of other variables.
influence of other variables.
Unlock Deck
Unlock for access to all 74 flashcards in this deck.
Unlock Deck
k this deck
7
One of the requirements for the z - test for comparing two proportions is that the samples must be
dependent on each other.
dependent on each other.
Unlock Deck
Unlock for access to all 74 flashcards in this deck.
Unlock Deck
k this deck
8
Calculate the critical value. Use Refer To: 09-18
A) -1.65
B) -2.33
C) -2.58
D) -1.96
Refer To: 09-18A) -1.65
B) -2.33
C) -2.58
D) -1.96
Unlock Deck
Unlock for access to all 74 flashcards in this deck.
Unlock Deck
k this deck
9
A) 7.85
B) 0.33
C) 0.39
D) 2.58
Unlock Deck
Unlock for access to all 74 flashcards in this deck.
Unlock Deck
k this deck
10
The critical value for a two-tailed F -test is 2.65, when , the sample size from which the variance
for the numerator was obtained = 10, and the sample size from which the variance for the denominator
was obtained = 15.
, the sample size from which the variancefor the numerator was obtained = 10, and the sample size from which the variance for the denominator
was obtained = 15.
Unlock Deck
Unlock for access to all 74 flashcards in this deck.
Unlock Deck
k this deck
11
If the samples are dependent, the f - test for dependent samples is used.
Unlock Deck
Unlock for access to all 74 flashcards in this deck.
Unlock Deck
k this deck
12
Unlock Deck
Unlock for access to all 74 flashcards in this deck.
Unlock Deck
k this deck
13
The critical value for a one-tailed right F -test is 2.57, when , the degrees of freedom for the
numerator = 15, and the degrees of freedom for the denominator = 20.
, the degrees of freedom for thenumerator = 15, and the degrees of freedom for the denominator = 20.
Unlock Deck
Unlock for access to all 74 flashcards in this deck.
Unlock Deck
k this deck
14
If the test value in the figure below, for a test of the difference between two large sample means, is 2.57 when the critical value is 1.96, what decision about the hypothesis should be made?
A) reject the null hypothesis
B) accept the null hypothesis
C) reject the alternative hypothesis
D) not enough information
A) reject the null hypothesis
B) accept the null hypothesis
C) reject the alternative hypothesis
D) not enough information
Unlock Deck
Unlock for access to all 74 flashcards in this deck.
Unlock Deck
k this deck
15
For normally distributed populations, if two samples are independent and the variances are known, the z -
test is used.
test is used.
Unlock Deck
Unlock for access to all 74 flashcards in this deck.
Unlock Deck
k this deck
16
When hypothesizing a difference of 0, if the confidence interval does not contain 0, the null hypothesis is
rejected.
rejected.
Unlock Deck
Unlock for access to all 74 flashcards in this deck.
Unlock Deck
k this deck
17
What is the test value? Use Refer To: 09-18
A) -6.86
B) -3.70
C) -4.13
D) -5.45
Refer To: 09-18A) -6.86
B) -3.70
C) -4.13
D) -5.45
Unlock Deck
Unlock for access to all 74 flashcards in this deck.
Unlock Deck
k this deck
18
The value of F cannot be negative, because variances are always positive or zero.
Unlock Deck
Unlock for access to all 74 flashcards in this deck.
Unlock Deck
k this deck
19
When comparing two variances or standard deviations, a f -test is used.
Unlock Deck
Unlock for access to all 74 flashcards in this deck.
Unlock Deck
k this deck
20
The standard error of difference of two large (independent) sample means is Unlock Deck
Unlock for access to all 74 flashcards in this deck.
Unlock Deck
k this deck
21
A researcher hypothesizes that the variation in the amount of money spent on business dinners is greater than the amount of money spent on lunches. The variance of nine business dinners was $6.12, and the
Variance of 12 business lunches was $0.87. What is the test value?
A) 3.1
B) 9.61
C) 49.5
D) 7.03
Variance of 12 business lunches was $0.87. What is the test value?
A) 3.1
B) 9.61
C) 49.5
D) 7.03
Unlock Deck
Unlock for access to all 74 flashcards in this deck.
Unlock Deck
k this deck
22
Unlock Deck
Unlock for access to all 74 flashcards in this deck.
Unlock Deck
k this deck
23
A) Yes, because the test value -8.45 is outside the interval (-1.96, 1.96)
B) Yes, because the test value -2.86 is outside the interval (-1.96, 1.96)
C) Yes, because the test value 71.43 is outside the interval (-1.96, 1.96)
D) No, because the test value -0.03 is inside the interval (-1.96, 1.96)
Unlock Deck
Unlock for access to all 74 flashcards in this deck.
Unlock Deck
k this deck
24
A) -2.36
B) -0.22
C) -0.55
D) -4.38
Unlock Deck
Unlock for access to all 74 flashcards in this deck.
Unlock Deck
k this deck
25
If the variances are not known, and one or both sample sizes are less than 30, the F -test must be
used.
used.
Unlock Deck
Unlock for access to all 74 flashcards in this deck.
Unlock Deck
k this deck
26
What is the critical value for a two-tailed F -test with when the sample size from which the variance for the numerator was obtained was 10, and the sample size from which the denominator was
Obtained was 24?
A) 2.27
B) 2.25
C) 2.32
D) 2.30
when the sample size from which the variance for the numerator was obtained was 10, and the sample size from which the denominator wasObtained was 24?
A) 2.27
B) 2.25
C) 2.32
D) 2.30
Unlock Deck
Unlock for access to all 74 flashcards in this deck.
Unlock Deck
k this deck
27
A) The data do not support the claim because the test value 0.94 is less than 1.64.
B) The data do not support the claim because the test value 0.94 is less than 1.96.
C) The data support the claim because the test value 1.94 is less than 1.96.
D) The data support the claim because the test value 1.94 is greater than 1.65.
Unlock Deck
Unlock for access to all 74 flashcards in this deck.
Unlock Deck
k this deck
28
A) Fail to reject the hypothesis because the test value 3.00 is less than the critical value 3.01.
B) Reject the hypothesis because the test value 3.00 is less than the critical value 3.01.
C) Fail to reject the hypothesis because the test value 9.00 is greater than the critical value 2.88.
D) Reject the hypothesis because the test value 9.00 is greater than the critical value 2.88.
Unlock Deck
Unlock for access to all 74 flashcards in this deck.
Unlock Deck
k this deck
29
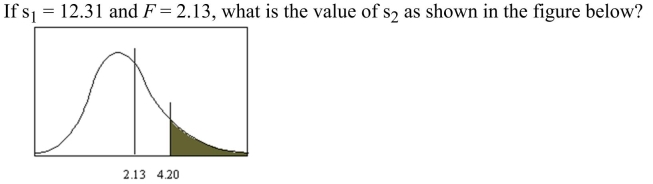
A researcher hypothesizes that the variation in the car rental rates at a major citiy's airport is less than the car rental rates in that city. The variance of 7 airport car rental rates was $25 and the variance of 4 city car
Rental rates was $60. What is the test value?
A) 4.20
B) 1.55
C) 2.40
D) 5.76
Rental rates was $60. What is the test value?
A) 4.20
B) 1.55
C) 2.40
D) 5.76
Unlock Deck
Unlock for access to all 74 flashcards in this deck.
Unlock Deck
k this deck
30
Compute the critical value for a right-tailed F -test with
A) 2.12
B) 2.23
C) 2.20
D) 2.16
A) 2.12
B) 2.23
C) 2.20
D) 2.16
Unlock Deck
Unlock for access to all 74 flashcards in this deck.
Unlock Deck
k this deck
31
What is the critical value? Use (Use the variances unequal formula.)
A) -1.761
B) -2.045
C) -1.697
D) -1.703
(Use the variances unequal formula.)A) -1.761
B) -2.045
C) -1.697
D) -1.703
Unlock Deck
Unlock for access to all 74 flashcards in this deck.
Unlock Deck
k this deck
32
A) 0.01
B) 0.025
C) 0.05
D) 0.1
Unlock Deck
Unlock for access to all 74 flashcards in this deck.
Unlock Deck
k this deck
33
A) test value = 0.45, degrees of freedom = 19 and 29
B) test value = 0.45, degrees of freedom = 18 and 28
C) test value = 2.20, degrees of freedom = 28 and 18
D) test value = 2.20, degrees of freedom = 29 and 19
Unlock Deck
Unlock for access to all 74 flashcards in this deck.
Unlock Deck
k this deck
34
Unlock Deck
Unlock for access to all 74 flashcards in this deck.
Unlock Deck
k this deck
35
A) No, because the test value 0.26 is inside the interval (-1.96, 1.96)
B) Yes, because the test value 3.81 is outside the interval (-1.96, 1.96)
C) Yes, because the test value 1.33 is inside the interval (-1.96, 1.96)
D) No, because the test value 1.33 is outside the interval (-1.96, 1.96)
Unlock Deck
Unlock for access to all 74 flashcards in this deck.
Unlock Deck
k this deck
36
A) The data do not support the claim because the test value 0.48 is less than 1.28.
B) The data do not support the claim because the test value 0.98 is less than 1.28.
C) The data do not support the claim because the test value 0.98 is less than 1.64.
D) The data do not support the claim because the test value 0.48 is less than 1.64.
Unlock Deck
Unlock for access to all 74 flashcards in this deck.
Unlock Deck
k this deck
37
A car salesman claims that the variance of prices on convertibles is higher than the variance on station wagons. The standard deviation of 16 convertibles is $6,800 and the standard deviation of 24 station
Wagons is $3,900. For what is the test value?
A) 3.00
B) 3.04
C) 2.78
D) 2.33
Wagons is $3,900. For
what is the test value?A) 3.00
B) 3.04
C) 2.78
D) 2.33
Unlock Deck
Unlock for access to all 74 flashcards in this deck.
Unlock Deck
k this deck
38
What is the test value? Use . (Use the variances unequal formula.)
A) -6.97
B) -2.50
C) -4.53
D) -2.54
. (Use the variances unequal formula.)A) -6.97
B) -2.50
C) -4.53
D) -2.54
Unlock Deck
Unlock for access to all 74 flashcards in this deck.
Unlock Deck
k this deck
39
A college class believes that the average grade averages of psychology students and the average grade averages of biology students are different. The class found that the actual grade averages of a sample of
10 psychology students was 3.2, and the average grade average of a sample of 10 biology students was
10 psychology students was 3.2, and the average grade average of a sample of 10 biology students was
Unlock Deck
Unlock for access to all 74 flashcards in this deck.
Unlock Deck
k this deck
40
A) 3.31
B) 1.75
C) 0.31
D) 2.31
Unlock Deck
Unlock for access to all 74 flashcards in this deck.
Unlock Deck
k this deck
41
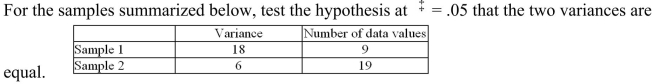
For the samples summarized below, test the hypothesis at that the two variances are equal.
A) Accept the hypothesis because the test value 8.41 is greater than the critical value 3.01.
B) Reject the hypothesis because the test value 2.90 is less than the critical value 2.88.
C) Reject the hypothesis because the test value 8.41 is greater than the critical value 2.88.
D) Accept the hypothesis because the test value 2.90 is less than the critical value 3.01.
Unlock Deck
Unlock for access to all 74 flashcards in this deck.
Unlock Deck
k this deck
42
When testing the difference between two proportions, one sample had 30 out of 100 who were for capital punishment, and the other sample had 60 out of 80 who were for capital punishment. Calculate the
Standard error.
A) 0.075
B) 0.060
C) 0.042
D) 0.098
Standard error.
A) 0.075
B) 0.060
C) 0.042
D) 0.098
Unlock Deck
Unlock for access to all 74 flashcards in this deck.
Unlock Deck
k this deck
43
Many elementary school students in a school district currently have ear infections. A random sample of children in two different schools found that 13 of 46 at one school and 15 of 30 at the other had this
Infection. At the .05 level of significance, is there sufficient evidence to conclude that a difference exists
Between the proportion of students who have ear infections at one school and the other?
AYes, there is sufficient information to reject the hypothesis that the proportions of students at the two
) schools who have ear infections are the same because the test value -16.96 is outside the acceptance
Region (-1.96,1.96).
BNo, there is not sufficient information to reject the hypothesis that the proportions of students at the two
) schools who have ear infections are the same because the test value -1.92 is inside the acceptance region
(-1)96,1.96).
CYes, there is sufficient information to reject the hypothesis that the proportions of students at the two
) schools who have ear infections are the same because the test value -2.52 is outside the acceptance
Region (-1.96,1.96).
DYes, there is sufficient information to reject the hypothesis that the proportions of students at the two
) schools who have ear infections are the same because the test value -9.44 is outside the acceptance
Region (-1.96,1.96).
Unlock Deck
Unlock for access to all 74 flashcards in this deck.
Unlock Deck
k this deck
44
70% of students at a university live on campus. A random sample found that 35 of 50 male students and 42 of 50 of female students lived on campus. At the .05 level of significance, is there sufficient evidence
To conclude that a difference exists between the proportion of male students who live on campus and the
Proportion of female students who live on campus?
ANo, there is not sufficient information to reject the hypothesis that the proportion of male students who
) live on campus and the proportion of female students who live on campus are the same because the test
Value -0.14 is inside the acceptance region (-1.96,1.96).
BNo, there is not sufficient information to reject the hypothesis that the proportion of male students who
) live on campus and the proportion of female students who live on campus are the same because the test
Value -0.90 is inside the acceptance region (-1.96,1.96).
CNo, there is not sufficient information to reject the hypothesis that the proportion of male students who
) live on campus and the proportion of female students who live on campus are the same because the test
Value -1.73 is inside the acceptance region (-1.96,1.96).
DNo, there is not sufficient information to reject the hypothesis that the proportion of male students who
) live on campus and the proportion of female students who live on campus are the same because the test
Value -1.66 is inside the acceptance region (-1.96,1.96).
Unlock Deck
Unlock for access to all 74 flashcards in this deck.
Unlock Deck
k this deck
45
A researcher wanted to determine if using an octane booster would increase gasoline mileage. A random
sample of seven cars was selected; the cars were driven for two weeks without the booster and two weeks
with the booster.
State the alternative hypothesis.
sample of seven cars was selected; the cars were driven for two weeks without the booster and two weeks
with the booster.
State the alternative hypothesis.
Unlock Deck
Unlock for access to all 74 flashcards in this deck.
Unlock Deck
k this deck
46
In comparing the two standard deviations below, what is the test value and what are the degrees of freedom that should be used?
A) test value = 3.50, degrees of freedom = 17 and 25
B) test value = 3.50, degrees of freedom = 16 and 24
C) test value = 12.25, degrees of freedom = 17 and 25
D) test value = 12.25, degrees of freedom = 16 and 24
A) test value = 3.50, degrees of freedom = 17 and 25
B) test value = 3.50, degrees of freedom = 16 and 24
C) test value = 12.25, degrees of freedom = 17 and 25
D) test value = 12.25, degrees of freedom = 16 and 24
Unlock Deck
Unlock for access to all 74 flashcards in this deck.
Unlock Deck
k this deck
47
A reporter bought a hamburger at each of a set of random stores of two different restaurant chains. She then had the number of calories in each hamburger measured. Can the reporter conclude, at that the two sets of hamburgers have different amounts of calories? (Use the equal variances formula.)
A) No, because the test value -0.09 is inside the interval (-2.14, 2.14)
B) No, because the test value -0.09 is inside the interval (-2.16, 2.16)
C) No, because the test value -1.17 is inside the interval (-2.16, 2.16)
D) No, because the test value -2.00 is inside the interval (-2.16, 2.16)
A) No, because the test value -0.09 is inside the interval (-2.14, 2.14)
B) No, because the test value -0.09 is inside the interval (-2.16, 2.16)
C) No, because the test value -1.17 is inside the interval (-2.16, 2.16)
D) No, because the test value -2.00 is inside the interval (-2.16, 2.16)
Unlock Deck
Unlock for access to all 74 flashcards in this deck.
Unlock Deck
k this deck
48
A researcher wanted to determine if using an octane booster would increase gasoline mileage. A random
sample of seven cars was selected; the cars were driven for two weeks without the booster and two weeks
with the booster.
What is the critical value using ?
A) -1.782
B) -1.761
C) -1.943
D) -1.895
sample of seven cars was selected; the cars were driven for two weeks without the booster and two weeks
with the booster.
What is the critical value using
?A) -1.782
B) -1.761
C) -1.943
D) -1.895
Unlock Deck
Unlock for access to all 74 flashcards in this deck.
Unlock Deck
k this deck
49
A marketing firm asked a random set of married women and married men how much they were willing to spend for jewellery as a present for their spouse. Can the firm conclude, at , that
Each of the two groups has a different willingness to spend? (Use the unequal variances formula.)
A) No, because the test value 0.32 is inside the interval (-2.31, 2.31)
B) Yes, because the test value 2.81 is outside the interval (-2.36, 2.36)
C) Yes, because the test value 16.00 is inside the interval (-2.31, 2.31)
D) No, because the test value 16.00 is outside the interval (-2.36, 2.36)
, thatEach of the two groups has a different willingness to spend? (Use the unequal variances formula.)
A) No, because the test value 0.32 is inside the interval (-2.31, 2.31)
B) Yes, because the test value 2.81 is outside the interval (-2.36, 2.36)
C) Yes, because the test value 16.00 is inside the interval (-2.31, 2.31)
D) No, because the test value 16.00 is outside the interval (-2.36, 2.36)
Unlock Deck
Unlock for access to all 74 flashcards in this deck.
Unlock Deck
k this deck
50
One poll found that 40% of male voters will support a candidate while another found that 48% of female voters will be in support. To test whether this candidate has equal levels of support between male and
Female voters, the alternative hypothesis should be
Female voters, the alternative hypothesis should be
Unlock Deck
Unlock for access to all 74 flashcards in this deck.
Unlock Deck
k this deck
51
A study of cats and dogs found that 25 of 50 cats and 44 of 60 dogs slept more than 10 hours per day. At the .05 level of significance, is there sufficient evidence to conclude that a difference exists between the
Proportion of cats and the proportion of dogs that sleep more than 10 hours per day?
AYes, there is sufficient information to reject the hypothesis that the proportion of cats and the proportion
) of dogs that sleep more than 10 hours per day are the same because the test value -2.52 is outside the
Acceptance region (-1.96,1.96).
BNo, there is not sufficient information to reject the hypothesis that the proportion of cats and the
) proportion of dogs that sleep more than 10 hours per day are the same because the test value -1.64 is
Inside the acceptance region (-1.96,1.96).
CYes, there is sufficient information to reject the hypothesis that the proportion of cats and the proportion
) of dogs that sleep more than 10 hours per day are the same because the test value -2.90 is outside the
Acceptance region (-1.96,1.96).
DNo, there is not sufficient information to reject the hypothesis that the proportion of cats and the
) proportion of dogs that sleep more than 10 hours per day are the same because the test value -0.77 is
Inside the acceptance region (-1.96,1.96).
Unlock Deck
Unlock for access to all 74 flashcards in this deck.
Unlock Deck
k this deck
52
A recent survey reported that in a sample of 300 students who attend community colleges, 105 work at least 20 hours a week. In a sample of 225 students attending universities, only 20 students were found to
Work at least 20 hours per week. What is the test value?
A) 6.95
B) 7.61
C) 2.38
D) 4.18
Work at least 20 hours per week. What is the test value?
A) 6.95
B) 7.61
C) 2.38
D) 4.18
Unlock Deck
Unlock for access to all 74 flashcards in this deck.
Unlock Deck
k this deck
53
A researcher wanted to determine if using an octane booster would increase gasoline mileage. A random
sample of seven cars was selected; the cars were driven for two weeks without the booster and two weeks
with the booster.
A running coach wanted to see whether runners ran faster after eating spaghetti the night before a race. Twenty-four random runners were chosen for this study. They ran a 5-kilometre race after having a
Normal dinner the night before, and then a week later, re-ran the same race after having a spaghetti dinner
The night before. Their results (in seconds) are in the table below. At , what is the test value for
This test?
A) -3.41
B) -1.00
C) -0.26
D) -4.90
sample of seven cars was selected; the cars were driven for two weeks without the booster and two weeks
with the booster.
A running coach wanted to see whether runners ran faster after eating spaghetti the night before a race. Twenty-four random runners were chosen for this study. They ran a 5-kilometre race after having a
Normal dinner the night before, and then a week later, re-ran the same race after having a spaghetti dinner
The night before. Their results (in seconds) are in the table below. At
, what is the test value forThis test?
A) -3.41
B) -1.00
C) -0.26
D) -4.90
Unlock Deck
Unlock for access to all 74 flashcards in this deck.
Unlock Deck
k this deck
54
A researcher wanted to determine if using an octane booster would increase gasoline mileage. A random
sample of seven cars was selected; the cars were driven for two weeks without the booster and two weeks
with the booster.
Determine the mean of the difference.
A) -0.96
B) -6.3
C) 1.43
D) -1.43
sample of seven cars was selected; the cars were driven for two weeks without the booster and two weeks
with the booster.
Determine the mean of the difference.
A) -0.96
B) -6.3
C) 1.43
D) -1.43
Unlock Deck
Unlock for access to all 74 flashcards in this deck.
Unlock Deck
k this deck
55
A) 5.78
B) 8.43
C) 71.14
D) 17.97
Unlock Deck
Unlock for access to all 74 flashcards in this deck.
Unlock Deck
k this deck
56
One poll found that 41% of male voters will support a candidate while another found that 49% of female voters will be in support. To test whether this candidate has equal levels of support between male and
Female voters, the null hypothesis should be
Female voters, the null hypothesis should be
Unlock Deck
Unlock for access to all 74 flashcards in this deck.
Unlock Deck
k this deck
57
A medical researcher is interested in whether patients' left arms or right arms are longer. If 9 patients participate in this study (so that 9 left arms and 9 right arms are measured), how many degrees of freedom
Should the researcher use in her t-test critical value?
A) 8
B) 9
C) 16
D) 17
Should the researcher use in her t-test critical value?
A) 8
B) 9
C) 16
D) 17
Unlock Deck
Unlock for access to all 74 flashcards in this deck.
Unlock Deck
k this deck
58
A researcher wanted to determine if using an octane booster would increase gasoline mileage. A random
sample of seven cars was selected; the cars were driven for two weeks without the booster and two weeks
with the booster.
Compute the standard deviation of the difference.
A) 0.78
B) 0.69
C) 0.87
D) 0.48
sample of seven cars was selected; the cars were driven for two weeks without the booster and two weeks
with the booster.
Compute the standard deviation of the difference.
A) 0.78
B) 0.69
C) 0.87
D) 0.48
Unlock Deck
Unlock for access to all 74 flashcards in this deck.
Unlock Deck
k this deck
59
A) 2.25
B) 2.42
C) 2.64
D) 2.88
Unlock Deck
Unlock for access to all 74 flashcards in this deck.
Unlock Deck
k this deck
60
A researcher wanted to determine if using an octane booster would increase gasoline mileage. A random
sample of seven cars was selected; the cars were driven for two weeks without the booster and two weeks
with the booster.
A dietician investigated whether apples turned brown at different rates when exposed to air after being washed in hot water or in cold water. She took 12 random apples and cut each in half. She washed one
Half of each apple in hot water and the other half in cold water, and then put both halves out in a tray. Her
Results (in hours until turning a particular shade of brown) are in the table below. At , did she see a
Difference between the two treatments?
A) No, because the test value -0.06 is inside the range (-3.05, 3.05).
B) No, because the test value -0.21 is inside the range (-3.11, 3.11).
C) No, because the test value -0.21 is inside the range (-3.05, 3.05).
D) No, because the test value -0.06 is inside the range (-3.11, 3.11).
sample of seven cars was selected; the cars were driven for two weeks without the booster and two weeks
with the booster.
A dietician investigated whether apples turned brown at different rates when exposed to air after being washed in hot water or in cold water. She took 12 random apples and cut each in half. She washed one
Half of each apple in hot water and the other half in cold water, and then put both halves out in a tray. Her
Results (in hours until turning a particular shade of brown) are in the table below. At
, did she see aDifference between the two treatments?
A) No, because the test value -0.06 is inside the range (-3.05, 3.05).
B) No, because the test value -0.21 is inside the range (-3.11, 3.11).
C) No, because the test value -0.21 is inside the range (-3.05, 3.05).
D) No, because the test value -0.06 is inside the range (-3.11, 3.11).
Unlock Deck
Unlock for access to all 74 flashcards in this deck.
Unlock Deck
k this deck
61
Unlock Deck
Unlock for access to all 74 flashcards in this deck.
Unlock Deck
k this deck
62
A pooled estimate of the variance is a weighted average of the variance using the two sample variances
and the __________ of each variance as the weights.
________________________________________
and the __________ of each variance as the weights.
________________________________________
Unlock Deck
Unlock for access to all 74 flashcards in this deck.
Unlock Deck
k this deck
63
A study on the oxygen consumption rate (OCR) of sea cucumbers involved a random sample of size 10 at 15oC and a second random sample of size 7 kept at 18oC. If one tested the hypothesis that this range
Of temperature had no effect on the OCR, the degrees of freedom for the test statistic would be (assume
Equal variability)
A) 9
B) 10
C) 15
D) 16
Of temperature had no effect on the OCR, the degrees of freedom for the test statistic would be (assume
Equal variability)
A) 9
B) 10
C) 15
D) 16
Unlock Deck
Unlock for access to all 74 flashcards in this deck.
Unlock Deck
k this deck
64
________________________________________ Unlock Deck
Unlock for access to all 74 flashcards in this deck.
Unlock Deck
k this deck
65
The mean value of F is approximately equal to __________.
________________________________________
________________________________________
Unlock Deck
Unlock for access to all 74 flashcards in this deck.
Unlock Deck
k this deck
66
Unlock Deck
Unlock for access to all 74 flashcards in this deck.
Unlock Deck
k this deck
67
When the subjects are paired or matched in some way, samples are considered to be __________.
________________________________________
________________________________________
Unlock Deck
Unlock for access to all 74 flashcards in this deck.
Unlock Deck
k this deck
68
A study on the oxygen consumption rate (OCR) of sea cucumbers involved a random sample of size 10 at 15oC and second random sample of size 7 kept at 18oC. If one tested the hypothesis that this range of
Temperature had no effect on the OCR (assume equal variability) the critical value would be (assume .05)
A) 1.746
B) 1.761
C) 2.131
D) 2.145
Temperature had no effect on the OCR (assume equal variability) the critical value would be (assume
.05)A) 1.746
B) 1.761
C) 2.131
D) 2.145
Unlock Deck
Unlock for access to all 74 flashcards in this deck.
Unlock Deck
k this deck
69
Unlock Deck
Unlock for access to all 74 flashcards in this deck.
Unlock Deck
k this deck
70
Unlock Deck
Unlock for access to all 74 flashcards in this deck.
Unlock Deck
k this deck
71
Unlock Deck
Unlock for access to all 74 flashcards in this deck.
Unlock Deck
k this deck
72
The critical value for a left-tailed t-test for dependent samples is __________ when the degrees of
freedom = 7 and
freedom = 7 and
Unlock Deck
Unlock for access to all 74 flashcards in this deck.
Unlock Deck
k this deck
73
In a study comparing the systolic blood pressure of individuals sitting and standing, 10 subjects had their blood pressure measured in the two conditions. The investigator planned to test the hypothesis that the
Mean blood pressure readings are the same sitting and standing (the subjects remained in each position
For 5 minutes). If the investigator tests at the 10% level of significance, the rejection region would be
Mean blood pressure readings are the same sitting and standing (the subjects remained in each position
For 5 minutes). If the investigator tests at the 10% level of significance, the rejection region would be
Unlock Deck
Unlock for access to all 74 flashcards in this deck.
Unlock Deck
k this deck
74
Unlock Deck
Unlock for access to all 74 flashcards in this deck.
Unlock Deck
k this deck
Unlock Deck
Unlock for access to all 74 flashcards in this deck.


