Deck 3: Data Description
Full screen (f)
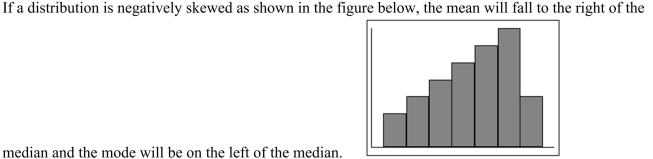
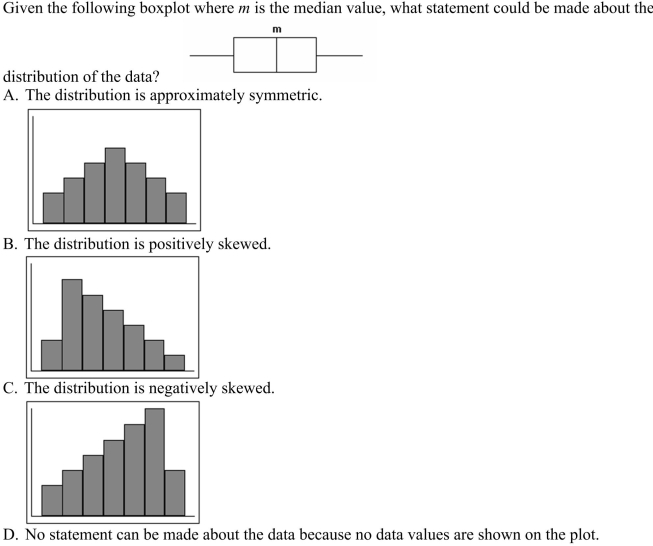
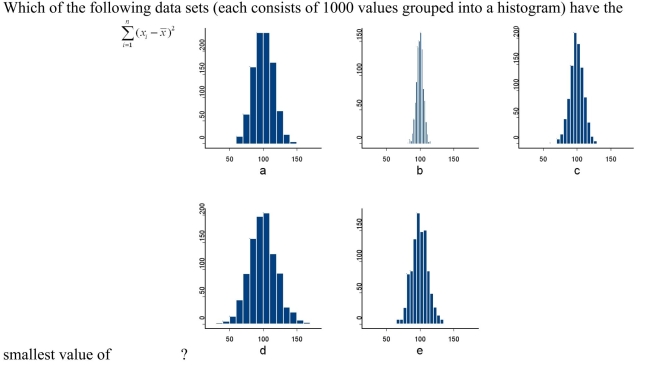
Question
Question
Question
Question
Question
Question
Question
Question
Question
Question
Question
Question
Question
A five-number summary of a data set consists of the minimum,  maximum.
maximum. Question
Question
Question
Question
Question
Question
Question
Question
Question
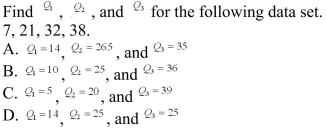
Given the following data set, the IQR is 3. 
Question
Given the following data set, the IQR is 7. 
Question
Question
Question
Question
Question
Question
Question
Question
A) The mean is the same as the median, but the mode can be different.
B) The mean, the median, and the mode are the same.
C) The median and the mode are the same, but the mean can be different.
D) The mean, the median, and the mode are different.
Question
Question
Question
Question
Question
Question
Question
Question
Question
Question
Question
Question
Question
Question
Question
Question
Question
Question
Question
Question
Given that the mean of a set of data is 25 and the standard deviation is 3, what would be the coefficient of variation?
A) 0.12
B)
C) 8.33
D)
A) 0.12
B)
C) 8.33
D)
Question
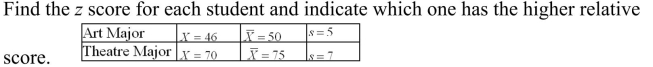
A) The art major has a higher score than the theatre major.
B) The theatre major has a higher score than the art major.
C) Both students have the same score.
D) Neither student received a positive score; therefore, the higher score cannot be determined.
Question
Question
Question
Question
Question
Question
Question
Question
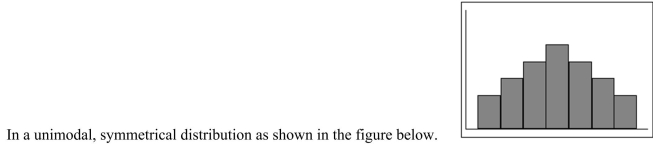
A distribution in which approximately  of the data values fall within one standard deviation of the mean behaves according to
A) the empirical rule.
B) a symmetrical distribution.
C) a boxplot.
D) differential statistics.
of the data values fall within one standard deviation of the mean behaves according toA) the empirical rule.
B) a symmetrical distribution.
C) a boxplot.
D) differential statistics.
Question
Question
A) Option A
B) Option B
C) Option C
D) Option D
E) Option E
Question
Question
A) 141.4
B) 145.6
C) 133.4
D) 136.0
Question
A) 180.4
B) 197.3
C) 192.6
D) 183.2
Question
Question
Question
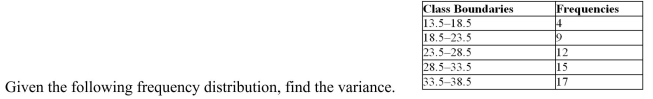
A) 28.8
B) 12.6
C) 26.3
D) 31.3
Question
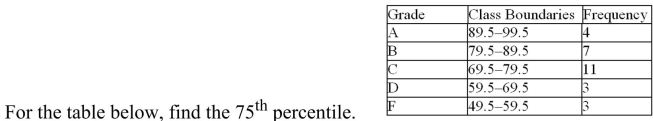
A) 76.6
B) 72.6
C) 81.6
D) 83.6
Question
Question
A) 37.2
B) 40.5
C) 36.4
D) 38.7
Question
Question
Question
Question
A) 38.1
B) 39.6
C) 41.1
D) 40.8
Question
A) 30.2
B) 29.8
C) 30.3
D) 29.5
Question
A) 43.5
B) 40.2
C) 48.6
D) 42.3
Question
Question
Question
A) 78.6
B) 76.8
C) 70.4
D) 74.0

Unlock Deck
Sign up to unlock the cards in this deck!
Unlock Deck
Unlock Deck
1/101
Play
Full screen (f)
Deck 3: Data Description
1
The unbiased estimator is included in the formula for calculating the variance of a sample because
without it, the computed variance usually underestimates the population variance.
without it, the computed variance usually underestimates the population variance.
True
2
For a set of data with mean 12 and variance 36, approximately 68% of the values will fall between 0 and
False
3
To find the mean for grouped data, we take the sum of all the frequencies, multiply this by the midpoint
of each class and then divide boor the sample size.
of each class and then divide boor the sample size.
False
4
A weighted mean is used when the values of the data set are not all equally represented.
Unlock Deck
Unlock for access to all 101 flashcards in this deck.
Unlock Deck
k this deck
5
The procedure for finding the mean for grouped data assumes that the mean of all the raw data values in
each class is equal to the midpoint of the class.
each class is equal to the midpoint of the class.
Unlock Deck
Unlock for access to all 101 flashcards in this deck.
Unlock Deck
k this deck
6
Methods commonly called traditional statistics include using measures of position, Chebyshev's theorem,
and the coefficient of variation.
and the coefficient of variation.
Unlock Deck
Unlock for access to all 101 flashcards in this deck.
Unlock Deck
k this deck
7
For the sample 1, 8, 7, 2, 9, 15, and 18, the mean is 7.6.
Unlock Deck
Unlock for access to all 101 flashcards in this deck.
Unlock Deck
k this deck
8
The range of a data set is the distance between the highest value and the lowest value.
Unlock Deck
Unlock for access to all 101 flashcards in this deck.
Unlock Deck
k this deck
9
If the range is divided by 6, an approximate value for the standard deviation is obtained.
Unlock Deck
Unlock for access to all 101 flashcards in this deck.
Unlock Deck
k this deck
10
Unlock Deck
Unlock for access to all 101 flashcards in this deck.
Unlock Deck
k this deck
11
The percentile corresponding to a given value X is computed by adding the 0.5 to number of values below
X and dividing this value by the total number of values within the data set.
X and dividing this value by the total number of values within the data set.
Unlock Deck
Unlock for access to all 101 flashcards in this deck.
Unlock Deck
k this deck
12
The coefficient of variation is the mean divided by the standard deviation expressed as a percentage.
Unlock Deck
Unlock for access to all 101 flashcards in this deck.
Unlock Deck
k this deck
13
A five-number summary of a data set consists of the minimum, maximum.
maximum. Unlock Deck
Unlock for access to all 101 flashcards in this deck.
Unlock Deck
k this deck
14
The range rule of thumb is only an approximation and should only be used when the distribution of data
values is unimodal and roughly symmetric.
values is unimodal and roughly symmetric.
Unlock Deck
Unlock for access to all 101 flashcards in this deck.
Unlock Deck
k this deck
15
The variance is the square root of the standard deviation of a set of data.
Unlock Deck
Unlock for access to all 101 flashcards in this deck.
Unlock Deck
k this deck
16
The interquartile range or IQR is found by subtracting the mean from the maximum value of a data
set.
set.
Unlock Deck
Unlock for access to all 101 flashcards in this deck.
Unlock Deck
k this deck
17
Chebyshev's theorem can be used to find the minimum percentage of data values that will fall between
any two given values.
any two given values.
Unlock Deck
Unlock for access to all 101 flashcards in this deck.
Unlock Deck
k this deck
18
The median can be a more appropriate measure of central tendency if the distribution of the data is
extremely skewed.
extremely skewed.
Unlock Deck
Unlock for access to all 101 flashcards in this deck.
Unlock Deck
k this deck
19
The following data set could also be referred to as a data array:
3, 4, 2, 7.
3, 4, 2, 7.
Unlock Deck
Unlock for access to all 101 flashcards in this deck.
Unlock Deck
k this deck
20
John, who was a business student, received a grade corresponding to a z-score of 1 whereas his girl friend
who was studying engineering, received a grade corresponding to a z-score of 2. John's grade score was
necessarily below his girl friend's grade
who was studying engineering, received a grade corresponding to a z-score of 2. John's grade score was
necessarily below his girl friend's grade
Unlock Deck
Unlock for access to all 101 flashcards in this deck.
Unlock Deck
k this deck
21
A student received the following grades: An A in Statistics (4 credits), a C in Physics II (5 credits), a B in Sociology (3 credits), a B in a Literature seminar (2 credits), and a D in Tennis (1 credit). Assuming
A = 4 grade points, B = 3 grade points, C = 2 grade points, D = 1 grade point, and F = 0 grade points, the
Student's grade point average is:
A) 2.80
B) 3.13
C) 2.90
D) 2.92
A = 4 grade points, B = 3 grade points, C = 2 grade points, D = 1 grade point, and F = 0 grade points, the
Student's grade point average is:
A) 2.80
B) 3.13
C) 2.90
D) 2.92
Unlock Deck
Unlock for access to all 101 flashcards in this deck.
Unlock Deck
k this deck
22
Given the following data set, the IQR is 3.
Unlock Deck
Unlock for access to all 101 flashcards in this deck.
Unlock Deck
k this deck
23
Given the following data set, the IQR is 7.
Unlock Deck
Unlock for access to all 101 flashcards in this deck.
Unlock Deck
k this deck
24
What is the mode of the following numbers? -10, 4, 2, -2, 2, 0, -3
A) -4
B) 0
C) -2
D) 2
A) -4
B) 0
C) -2
D) 2
Unlock Deck
Unlock for access to all 101 flashcards in this deck.
Unlock Deck
k this deck
25
Which of the following is the mode for the given data? 5, 4, 3, 4, 5, 6, 5, 5, 3, 4
A) 3
B) 4
C) 5
D) 6
A) 3
B) 4
C) 5
D) 6
Unlock Deck
Unlock for access to all 101 flashcards in this deck.
Unlock Deck
k this deck
26
What is the median of the following numbers? -12, 2, 0, -4, 0, -5, -4, 0
A) -6
B) -2
C) -4
D) 0
A) -6
B) -2
C) -4
D) 0
Unlock Deck
Unlock for access to all 101 flashcards in this deck.
Unlock Deck
k this deck
27
What is the mean of the following numbers? -12, -9, -5, -4, 0
A) -9
B) -6
C) -5
D) -2
A) -9
B) -6
C) -5
D) -2
Unlock Deck
Unlock for access to all 101 flashcards in this deck.
Unlock Deck
k this deck
28
Find the median for the following data. 6, 7, 4, 5, 3, 7, 4
A) 3
B) 4
C) 5
D) 7
A) 3
B) 4
C) 5
D) 7
Unlock Deck
Unlock for access to all 101 flashcards in this deck.
Unlock Deck
k this deck
29
What is the median of the following numbers? -12, -9, -5, -4, 0
A) -6
B) -5
C) -4
D) -2
A) -6
B) -5
C) -4
D) -2
Unlock Deck
Unlock for access to all 101 flashcards in this deck.
Unlock Deck
k this deck
30
What is the midrange of the following numbers? 5, 11, 10, 12, 4, 12, 18, 18, 18
A) 11
B) 12
C) 5
D) 18
A) 11
B) 12
C) 5
D) 18
Unlock Deck
Unlock for access to all 101 flashcards in this deck.
Unlock Deck
k this deck
31
A) The mean is the same as the median, but the mode can be different.
B) The mean, the median, and the mode are the same.
C) The median and the mode are the same, but the mean can be different.
D) The mean, the median, and the mode are different.
Unlock Deck
Unlock for access to all 101 flashcards in this deck.
Unlock Deck
k this deck
32
What is the mean of the following numbers? 4, 6, 9, 11, 15
A) 6
B) 8
C) 9
D) 10
A) 6
B) 8
C) 9
D) 10
Unlock Deck
Unlock for access to all 101 flashcards in this deck.
Unlock Deck
k this deck
33
What is the range of the numbers -3, 2, -5, 3, 11:
A) -3
B) 2
C) 6
D) 16
A) -3
B) 2
C) 6
D) 16
Unlock Deck
Unlock for access to all 101 flashcards in this deck.
Unlock Deck
k this deck
34
What is the median of the following numbers? 1, 3, 6, 8, 12
A) 3
B) 5
C) 6
D) 7
A) 3
B) 5
C) 6
D) 7
Unlock Deck
Unlock for access to all 101 flashcards in this deck.
Unlock Deck
k this deck
35
Which of the following is the correct mean for the given data? 7, 8, 13, 9, 10, 11
A) 10
B) 9.7
C) 9.67
D) 9
A) 10
B) 9.7
C) 9.67
D) 9
Unlock Deck
Unlock for access to all 101 flashcards in this deck.
Unlock Deck
k this deck
36
The range of the set of numbers {4, 13, 3, 10, 5} is
A) 3
B) 13
C) 8
D) 10
A) 3
B) 13
C) 8
D) 10
Unlock Deck
Unlock for access to all 101 flashcards in this deck.
Unlock Deck
k this deck
37
Find the mode for the number of police officers in selected city districts. 24, 26, 24, 30, 23, 28, 19, 31, 24, 26, 19
A) 23
B) 24
C) 26
D) 28
A) 23
B) 24
C) 26
D) 28
Unlock Deck
Unlock for access to all 101 flashcards in this deck.
Unlock Deck
k this deck
38
Determine the range for this data: 6, 14, 10, 8, 21:
A) 6
B) 10
C) 15
D) 21
A) 6
B) 10
C) 15
D) 21
Unlock Deck
Unlock for access to all 101 flashcards in this deck.
Unlock Deck
k this deck
39
Determine the range for this data: 4, 7, 3, 16, 5, 22, and 8:
A) 4
B) 3
C) 14
D) 19
A) 4
B) 3
C) 14
D) 19
Unlock Deck
Unlock for access to all 101 flashcards in this deck.
Unlock Deck
k this deck
40
What is the term for a characteristic or measure obtained by using all the data values for a specific population?
A) variable
B) mode
C) statistic
D) parameter
A) variable
B) mode
C) statistic
D) parameter
Unlock Deck
Unlock for access to all 101 flashcards in this deck.
Unlock Deck
k this deck
41
If a set of data has 64 points and variance 16, then the standard deviation is
A) 2.00
B) 0.06
C) 0.50
D) 4.00
A) 2.00
B) 0.06
C) 0.50
D) 4.00
Unlock Deck
Unlock for access to all 101 flashcards in this deck.
Unlock Deck
k this deck
42
A student scored 75 points on a test where the mean score was 81 and the standard deviation was 6. The student's z-score was
A) 13.50
B) 0.17
C) -0.17
D) -1.00
A) 13.50
B) 0.17
C) -0.17
D) -1.00
Unlock Deck
Unlock for access to all 101 flashcards in this deck.
Unlock Deck
k this deck
43
If the mean of a set of data is 26.00, and 33.50 has a z-score of 0.75, then the standard deviation must be:
A) 10.00
B) 100.00
C) 5.00
D) 50.00
A) 10.00
B) 100.00
C) 5.00
D) 50.00
Unlock Deck
Unlock for access to all 101 flashcards in this deck.
Unlock Deck
k this deck
44
What is the correct standard score for a batter who normally averages 0.325, with a standard deviation of 0.065 if he scores 0.410 for one game?
A) 1.308
B) 0.410
C) 0.325
D) 1.275
A) 1.308
B) 0.410
C) 0.325
D) 1.275
Unlock Deck
Unlock for access to all 101 flashcards in this deck.
Unlock Deck
k this deck
45
If the mean of a set of data is 19.00, and 7.00 has a z-score of -1.50, then the standard deviation must be:
A) 8.00
B) 64.00
C) 4.00
D) 32.00
A) 8.00
B) 64.00
C) 4.00
D) 32.00
Unlock Deck
Unlock for access to all 101 flashcards in this deck.
Unlock Deck
k this deck
46
All the values in a dataset are between 9 and 12, except for one value of 92. That value 92 is likely to be
A) the range
B) an outlier
C) the mean
D) the boxplot
A) the range
B) an outlier
C) the mean
D) the boxplot
Unlock Deck
Unlock for access to all 101 flashcards in this deck.
Unlock Deck
k this deck
47
A student scored 89 points on a test where the mean score was 83 and the standard deviation was 3. The student's z-score was
A) 27.67
B) 29.67
C) 0.67
D) 2.00
A) 27.67
B) 29.67
C) 0.67
D) 2.00
Unlock Deck
Unlock for access to all 101 flashcards in this deck.
Unlock Deck
k this deck
48
Which of the following is true?
A)
B)
C)
D)
A)
B)
C)
D)
Unlock Deck
Unlock for access to all 101 flashcards in this deck.
Unlock Deck
k this deck
49
According to Chebyshev's theorem, the proportion of values from a data set that is further than 2 standard deviations from the mean is no more than:
A) 0.50
B) 0.13
C) 1.00
D) 0.25
A) 0.50
B) 0.13
C) 1.00
D) 0.25
Unlock Deck
Unlock for access to all 101 flashcards in this deck.
Unlock Deck
k this deck
50
Unlock Deck
Unlock for access to all 101 flashcards in this deck.
Unlock Deck
k this deck
51
Given that the mean of a set of data is 25 and the standard deviation is 3, what would be the coefficient of variation?
A) 0.12
B)
C) 8.33
D)
A) 0.12
B)
C) 8.33
D)
Unlock Deck
Unlock for access to all 101 flashcards in this deck.
Unlock Deck
k this deck
52
A) The art major has a higher score than the theatre major.
B) The theatre major has a higher score than the art major.
C) Both students have the same score.
D) Neither student received a positive score; therefore, the higher score cannot be determined.
Unlock Deck
Unlock for access to all 101 flashcards in this deck.
Unlock Deck
k this deck
53
The maximum of the set of numbers {6, 16, -5, 11, 5} is
A) -5
B) 16
C) 9.5
D) 13
A) -5
B) 16
C) 9.5
D) 13
Unlock Deck
Unlock for access to all 101 flashcards in this deck.
Unlock Deck
k this deck
54
Unlock Deck
Unlock for access to all 101 flashcards in this deck.
Unlock Deck
k this deck
55
The minimum of the set of numbers {-6, 15, -5, 11, 5} is
A) -6
B) 15
C) 9
D) 21
A) -6
B) 15
C) 9
D) 21
Unlock Deck
Unlock for access to all 101 flashcards in this deck.
Unlock Deck
k this deck
56
Given that the variance for a data set is 1.20, what would be the standard deviation?
A) 1.10
B) 1.44
C) 1.20
D) 0.60
A) 1.10
B) 1.44
C) 1.20
D) 0.60
Unlock Deck
Unlock for access to all 101 flashcards in this deck.
Unlock Deck
k this deck
57
If a set of 9 numbers has standard deviation 8, then its variance is
A) 64.00
B) 2.67
C) 21.33
D) 24.00
A) 64.00
B) 2.67
C) 21.33
D) 24.00
Unlock Deck
Unlock for access to all 101 flashcards in this deck.
Unlock Deck
k this deck
58
The grades for a trigonometry exam follow. Find the range. 85, 76, 93, 82, 84, 90, 75
A) 76
B) 9
C) 11
D) 18
A) 76
B) 9
C) 11
D) 18
Unlock Deck
Unlock for access to all 101 flashcards in this deck.
Unlock Deck
k this deck
59
If the value 5 has z-score of -0.75 in a dataset, then the mean of that dataset is
A) 5
B) 4.25
C) 5.75
D) It cannot be determined from the data given
A) 5
B) 4.25
C) 5.75
D) It cannot be determined from the data given
Unlock Deck
Unlock for access to all 101 flashcards in this deck.
Unlock Deck
k this deck
60
A distribution in which approximately of the data values fall within one standard deviation of the mean behaves according to
A) the empirical rule.
B) a symmetrical distribution.
C) a boxplot.
D) differential statistics.
of the data values fall within one standard deviation of the mean behaves according toA) the empirical rule.
B) a symmetrical distribution.
C) a boxplot.
D) differential statistics.
Unlock Deck
Unlock for access to all 101 flashcards in this deck.
Unlock Deck
k this deck
61
If the boxplot for one set of data is much wider than the boxplot for a second set of data, then
A) the mean of the first set of data must be larger than the mean of the second set of data
B) the median of the first set of data must be larger than the median of the second set of data
C) the second set of data must contain several outliers
D) none of the above need to be true
A) the mean of the first set of data must be larger than the mean of the second set of data
B) the median of the first set of data must be larger than the median of the second set of data
C) the second set of data must contain several outliers
D) none of the above need to be true
Unlock Deck
Unlock for access to all 101 flashcards in this deck.
Unlock Deck
k this deck
62
A) Option A
B) Option B
C) Option C
D) Option D
E) Option E
Unlock Deck
Unlock for access to all 101 flashcards in this deck.
Unlock Deck
k this deck
63
If the five number summary for a set of data is 2, 5, 8, 9, and 18, then the mean of this set of data is
A) 10
B) 8
C) 7
D) there is insufficient information to calculate the mean
A) 10
B) 8
C) 7
D) there is insufficient information to calculate the mean
Unlock Deck
Unlock for access to all 101 flashcards in this deck.
Unlock Deck
k this deck
64
A) 141.4
B) 145.6
C) 133.4
D) 136.0
Unlock Deck
Unlock for access to all 101 flashcards in this deck.
Unlock Deck
k this deck
65
A) 180.4
B) 197.3
C) 192.6
D) 183.2
Unlock Deck
Unlock for access to all 101 flashcards in this deck.
Unlock Deck
k this deck
66
The ________________ is the mode for grouped data.
________________________________________
________________________________________
Unlock Deck
Unlock for access to all 101 flashcards in this deck.
Unlock Deck
k this deck
67
The maximum value in a data set is 100 and the minimum value is 20, an approximate value for the standard deviation is
A) 20
B) 13.3
C) 30
D) It cannot be determined from the data given
A) 20
B) 13.3
C) 30
D) It cannot be determined from the data given
Unlock Deck
Unlock for access to all 101 flashcards in this deck.
Unlock Deck
k this deck
68
A) 28.8
B) 12.6
C) 26.3
D) 31.3
Unlock Deck
Unlock for access to all 101 flashcards in this deck.
Unlock Deck
k this deck
69
A) 76.6
B) 72.6
C) 81.6
D) 83.6
Unlock Deck
Unlock for access to all 101 flashcards in this deck.
Unlock Deck
k this deck
70
In a class of 200 students, Bill's mark corresponded to a z-score of 1 and Tom's mark corresponded to a z-score of 2. If the distribution of marks was bell-shaped ('normal') than the number of students with a
Grade between Bill's mark and Tom's mark is closest to
A) 5
B) 10
C) 20
D) 30
Grade between Bill's mark and Tom's mark is closest to
A) 5
B) 10
C) 20
D) 30
Unlock Deck
Unlock for access to all 101 flashcards in this deck.
Unlock Deck
k this deck
71
A) 37.2
B) 40.5
C) 36.4
D) 38.7
Unlock Deck
Unlock for access to all 101 flashcards in this deck.
Unlock Deck
k this deck
72
For the data set 10, -3, 4 8, the range rule of thumb is
A) 1.8
B) 1.5
C) 3.3
D) 2.2
A) 1.8
B) 1.5
C) 3.3
D) 2.2
Unlock Deck
Unlock for access to all 101 flashcards in this deck.
Unlock Deck
k this deck
73
_______________ applies to any distribution regardless of its shape.
________________________________________
________________________________________
Unlock Deck
Unlock for access to all 101 flashcards in this deck.
Unlock Deck
k this deck
74
The _______________ and ______________ are used to determine the consistency of a variable.
________________________________________
________________________________________
Unlock Deck
Unlock for access to all 101 flashcards in this deck.
Unlock Deck
k this deck
75
A) 38.1
B) 39.6
C) 41.1
D) 40.8
Unlock Deck
Unlock for access to all 101 flashcards in this deck.
Unlock Deck
k this deck
76
A) 30.2
B) 29.8
C) 30.3
D) 29.5
Unlock Deck
Unlock for access to all 101 flashcards in this deck.
Unlock Deck
k this deck
77
A) 43.5
B) 40.2
C) 48.6
D) 42.3
Unlock Deck
Unlock for access to all 101 flashcards in this deck.
Unlock Deck
k this deck
78
The ______________ is the average of the squares of the distance each value is from the mean.
________________________________________
________________________________________
Unlock Deck
Unlock for access to all 101 flashcards in this deck.
Unlock Deck
k this deck
79
A ______________ is the midpoint in a data array.
________________________________________
________________________________________
Unlock Deck
Unlock for access to all 101 flashcards in this deck.
Unlock Deck
k this deck
80
A) 78.6
B) 76.8
C) 70.4
D) 74.0
Unlock Deck
Unlock for access to all 101 flashcards in this deck.
Unlock Deck
k this deck
Unlock Deck
Unlock for access to all 101 flashcards in this deck.


