Deck 4: Transport of Substances Through Cell Membranes
Full screen (f)
Question
Question
Question
Question
Question
Question
The diagram shows a bag (with permeability characteristics similar to that of a normal cell) that contains a 100 mM solution of urea at time zero. The bag is placed in a beaker containing 100 mM glucose. Which of the following best describes the tonicity and osmolarity of the glucose solution as well as any changes in bag volume (assume that the bag volume is infinitely small compared to beaker volume)? 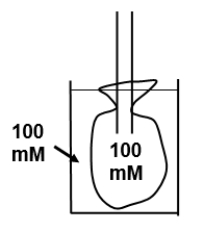
Question
The diagram shows a model cell that transports substance X across the cell membrane. The cell is equipped with a Na+-K+-ATPase pump as shown. Substance X enters the cell by a coupled transport mechanism and exits the cell by carrier-mediated diffusion. Treatment with a substance that inhibits the Na+-K+-ATPase pump inhibits the transport of X by which of the following mechanisms? 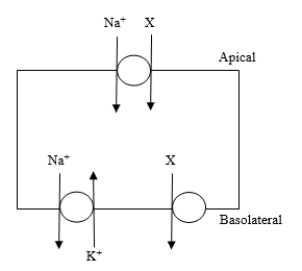
A)Decreased intracellular K+ concentration
B)Decreased intracellular Na+ concentration
C)Increased intracellular K+ concentration
D)Increased intracellular Na+ concentration
A)Decreased intracellular K+ concentration
B)Decreased intracellular Na+ concentration
C)Increased intracellular K+ concentration
D)Increased intracellular Na+ concentration
Question
The diagram illustrates possible changes in red blood cell volume resulting from a change in extracellular fluid composition for a cell equilibrated in 150 mmol/L NaCl at time zero. Which curve best illustrates the volume caused by immersion of the cell in an aqueous solution of 150 mmol/L CaCl2? 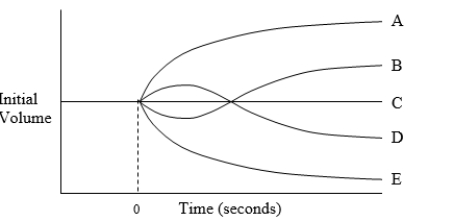
Question
The diagram illustrates possible changes in red blood cell volume resulting from a change in extracellular fluid composition for a cell equilibrated in a 150 mmol/L solution of sodium chloride (NaCl) at time zero. Which curve best illustrates the volume change caused by immersion of the cell in an aqueous solution of 200 mOsm/L NaCl and 200 mOsm/L glycerol? 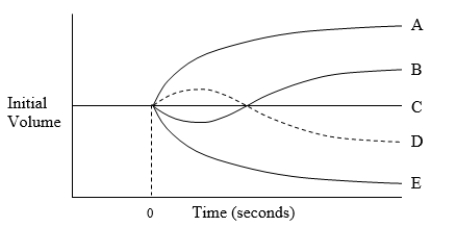
Question
The diagram illustrates possible changes in red blood cell volume resulting from a change in extracellular fluid composition for a cell equilibrated in a 150 mmol/L solution of sodium chloride (NaCl) at time zero. Which curve best illustrates the volume change caused by immersion of the cell in an aqueous solution of 300 mOsm/L calcium chloride (CaCl2)? 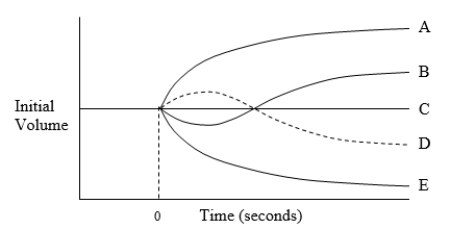
Question
Question
Question
Question
Question
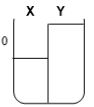
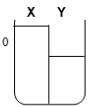
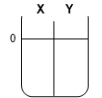
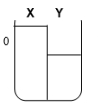
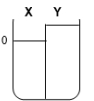
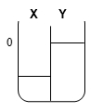
Two compartments ( and ) are separated by a typical biological membrane (i.e., lipid bilayer). The concentrations of a permeant solute (i.e., urea) at time zero are shown. Which of the drawings below represents the volumes of and when the system reaches equilibrium?
A.
B.
C.
D.
E.
A.
B.
C.
D.
E.
Question
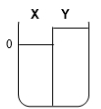
Two compartments ( and ) are separated by a typical biological membrane (lipid bilayer). The concentrations of a non-permeant molecule (glucose) at time zero are shown. Which of the drawings below represents the volumes of and when the system reaches equilibrium?
A.
B.

C.
D.
E.
A.
B.
C.
D.
E.
Question
Question
Question

Unlock Deck
Sign up to unlock the cards in this deck!
Unlock Deck
Unlock Deck
1/19
Play
Full screen (f)
Deck 4: Transport of Substances Through Cell Membranes
1
Human red blood cells (RBCs) and rabbit RBCs are equilibrated in separate solutions of isotonic saline (300 mOsm/L NaCl). The human RBCs are then placed in a solution of 300 mOsm/L glycerol, which causes them to swell and burst. However, rabbit RBCs placed in 300 mOsm/L glycerol neither swell nor shrink. Based on this information, which of the following can be concluded about a 300 mOsm/L solution of glycerol for the different cell types?
A.
B.
C.
D.
E.
F.
A.
B.
C.
D.
E.
F.
C
2
The intracellular calcium ion concentration of ventricular muscle cells averages 10-4 mmol/L during diastole. The calcium ion concentration in transverse tubules (T tubules) averages 2.5 mmol/L at rest. A protein transporter on the membrane of the T tubule exchanges sodium for calcium. The transporter uses the transmembrane sodium gradient to fuel the exchange. Which of the following transport mechanisms best describes this type of transporter?
A)Facilitated diffusion
B)Primary active transport
C)Secondary active co-transport
D)Secondary active counter-transport
E)Simple diffusion
A)Facilitated diffusion
B)Primary active transport
C)Secondary active co-transport
D)Secondary active counter-transport
E)Simple diffusion
D
3
Which of the following transport mechanisms can move sodium ions across a cell membrane?
E
4
A cell placed in a hypertonic solution shrinks because water moves out of the cell.
A)Both the statement and the reason are correct and related.
B)Both the statement and the reason are correct but not related.
C)The statement is correct, but the reason is not.
D)The statement is not correct, but the reason is correct.
E)Neither the statement nor the reason is correct.
A)Both the statement and the reason are correct and related.
B)Both the statement and the reason are correct but not related.
C)The statement is correct, but the reason is not.
D)The statement is not correct, but the reason is correct.
E)Neither the statement nor the reason is correct.
Unlock Deck
Unlock for access to all 19 flashcards in this deck.
Unlock Deck
k this deck
5
A cell is equilibrated in an aqueous solution of 300 mOsm/L sodium chloride. Which of the following best describes what will happen to cell volume when the cell is placed in an aqueous solution of 300 mOsm/L calcium chloride?
A)Decrease
B)Decrease and then increase
C)Increase
D)Increase and then decrease
E)No change
A)Decrease
B)Decrease and then increase
C)Increase
D)Increase and then decrease
E)No change
Unlock Deck
Unlock for access to all 19 flashcards in this deck.
Unlock Deck
k this deck
6
The diagram shows a bag (with permeability characteristics similar to that of a normal cell) that contains a 100 mM solution of urea at time zero. The bag is placed in a beaker containing 100 mM glucose. Which of the following best describes the tonicity and osmolarity of the glucose solution as well as any changes in bag volume (assume that the bag volume is infinitely small compared to beaker volume)?
Unlock Deck
Unlock for access to all 19 flashcards in this deck.
Unlock Deck
k this deck
7
The diagram shows a model cell that transports substance X across the cell membrane. The cell is equipped with a Na+-K+-ATPase pump as shown. Substance X enters the cell by a coupled transport mechanism and exits the cell by carrier-mediated diffusion. Treatment with a substance that inhibits the Na+-K+-ATPase pump inhibits the transport of X by which of the following mechanisms?
A)Decreased intracellular K+ concentration
B)Decreased intracellular Na+ concentration
C)Increased intracellular K+ concentration
D)Increased intracellular Na+ concentration
A)Decreased intracellular K+ concentration
B)Decreased intracellular Na+ concentration
C)Increased intracellular K+ concentration
D)Increased intracellular Na+ concentration
Unlock Deck
Unlock for access to all 19 flashcards in this deck.
Unlock Deck
k this deck
8
The diagram illustrates possible changes in red blood cell volume resulting from a change in extracellular fluid composition for a cell equilibrated in 150 mmol/L NaCl at time zero. Which curve best illustrates the volume caused by immersion of the cell in an aqueous solution of 150 mmol/L CaCl2?
Unlock Deck
Unlock for access to all 19 flashcards in this deck.
Unlock Deck
k this deck
9
The diagram illustrates possible changes in red blood cell volume resulting from a change in extracellular fluid composition for a cell equilibrated in a 150 mmol/L solution of sodium chloride (NaCl) at time zero. Which curve best illustrates the volume change caused by immersion of the cell in an aqueous solution of 200 mOsm/L NaCl and 200 mOsm/L glycerol?
Unlock Deck
Unlock for access to all 19 flashcards in this deck.
Unlock Deck
k this deck
10
The diagram illustrates possible changes in red blood cell volume resulting from a change in extracellular fluid composition for a cell equilibrated in a 150 mmol/L solution of sodium chloride (NaCl) at time zero. Which curve best illustrates the volume change caused by immersion of the cell in an aqueous solution of 300 mOsm/L calcium chloride (CaCl2)?
Unlock Deck
Unlock for access to all 19 flashcards in this deck.
Unlock Deck
k this deck
11
Which of the following substances is most likely to have the lowest permeability for a lipid bilayer with no protein channels or other transport proteins?
A)Glucose
B)Oxygen
C)Sodium
D)Urea
E)Water
A)Glucose
B)Oxygen
C)Sodium
D)Urea
E)Water
Unlock Deck
Unlock for access to all 19 flashcards in this deck.
Unlock Deck
k this deck
12
Secondary active transport typically moves which of the following substances against a concentration gradient?
Unlock Deck
Unlock for access to all 19 flashcards in this deck.
Unlock Deck
k this deck
13
Which of the following substances are most likely not have a higher concentration in the extracellular fluid compared with the intracellular fluid?
A)Calcium
B)Carbon dioxide
C)Chloride
D)Oxygen
E)Sodium
A)Calcium
B)Carbon dioxide
C)Chloride
D)Oxygen
E)Sodium
Unlock Deck
Unlock for access to all 19 flashcards in this deck.
Unlock Deck
k this deck
14
Cardiac glycosides can increase the intracellular calcium concentration in cardiomyocytes because cardiac glycosides can increase the intracellular sodium concentration in cardiomyocytes.
A)Both the statement and the reason are correct and related.
B)Both the statement and the reason are correct but not related.
C)The statement is correct, but the reason is not.
D)The statement is not correct, but the reason is correct.
E)Neither the statement nor the reason is correct.
A)Both the statement and the reason are correct and related.
B)Both the statement and the reason are correct but not related.
C)The statement is correct, but the reason is not.
D)The statement is not correct, but the reason is correct.
E)Neither the statement nor the reason is correct.
Unlock Deck
Unlock for access to all 19 flashcards in this deck.
Unlock Deck
k this deck
15
Two compartments ( and ) are separated by a typical biological membrane (i.e., lipid bilayer). The concentrations of a permeant solute (i.e., urea) at time zero are shown. Which of the drawings below represents the volumes of and when the system reaches equilibrium?
A.
B.
C.
D.
E.
A.
B.
C.
D.
E.
Unlock Deck
Unlock for access to all 19 flashcards in this deck.
Unlock Deck
k this deck
16
Two compartments ( and ) are separated by a typical biological membrane (lipid bilayer). The concentrations of a non-permeant molecule (glucose) at time zero are shown. Which of the drawings below represents the volumes of and when the system reaches equilibrium?
A.
B.
C.
D.
E.
A.
B.
C.
D.
E.
Unlock Deck
Unlock for access to all 19 flashcards in this deck.
Unlock Deck
k this deck
17
Which of the following pairs of aqueous solutions will exert equal osmotic pressures across a normal cell membrane after steady-state conditions have been established?
Unlock Deck
Unlock for access to all 19 flashcards in this deck.
Unlock Deck
k this deck
18
An artificial membrane is created consisting of a lipid bilayer without protein molecules in the membrane. The lipid composition of the membrane is the same as that of a normal, biological membrane. Which of the following substances permeates the membrane more readily than water molecules?
A)Carbon dioxide
B)Glucose
C)Glycerol
D)Sodium
E)Urea
A)Carbon dioxide
B)Glucose
C)Glycerol
D)Sodium
E)Urea
Unlock Deck
Unlock for access to all 19 flashcards in this deck.
Unlock Deck
k this deck
19
The molarity of a 2% solution of NaCl is 340 mmol/L. The molecular weight of NaCl is 58.5. What is the osmolarity of a 2% solution of NaCl?
A)170 mOsm/L
B)340 mOsm/L
C)510 mOsm/L
D)680 mOsm/L
A)170 mOsm/L
B)340 mOsm/L
C)510 mOsm/L
D)680 mOsm/L
Unlock Deck
Unlock for access to all 19 flashcards in this deck.
Unlock Deck
k this deck
Unlock Deck
Unlock for access to all 19 flashcards in this deck.


