Deck 6: Contraction of Skeletal Muscle
Full screen (f)
Question
During the contraction of a skeletal muscle fiber, the actin and myosin filaments slide past each other. Which of the following represents expected changes in the widths of I bands and A bands during the contraction process? 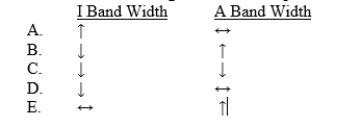
Question
Question
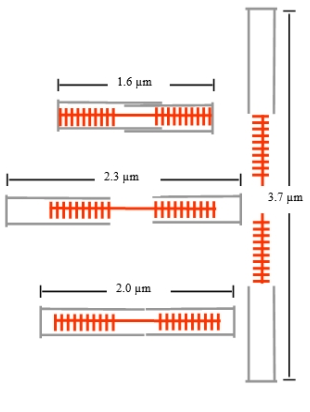
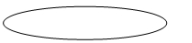
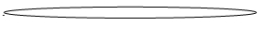
The skeletal muscle sarcomere normally has a narrow range of lengths in vivo, but sarcomere length can vary greatly in vitro under nonphysiological conditions. The diagram shows sarcomeres at various lengths. At which length can the sarcomere exert its maximum force during an isometric contraction?
A.
B.
C.
D.
E.
A.
B.
C.
D.
E.
Question
Question
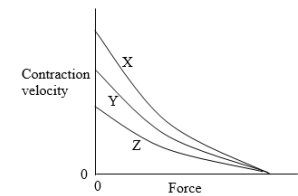
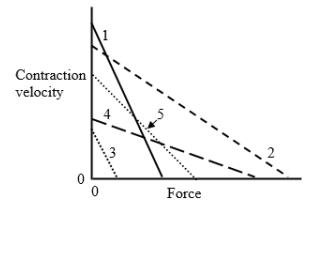
The diagram shows force-velocity relationships for three different skeletal muscles. Which of the follopving curves most likely correspond to glycolytic, oxidative, and mixed muscle types?
Question
Question
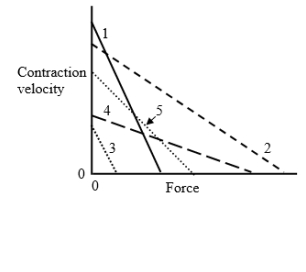
The diagram shows the relationship between contraction velocity and force. Which of the following muscles is most likely to correspond to muscle number 1 shown on the diagram (assume that all muscles shown are at their normal resting lengths).
A.

B.

C.

D.
E.
A.
B.
C.
D.
E.
Question
Question
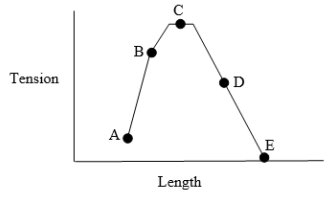
The diagram shows the relationship between muscle tension and sarcomere length for muscle. Which point on the curve represents tension development at a normal resting length for skeletal muscle?
Question
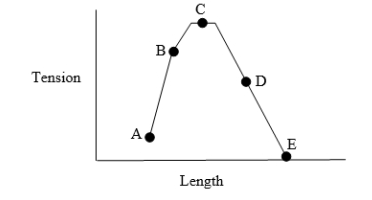
The diagram shows the relationship between muscle tension and sarcomere length for muscle. Which point 'on the curve represents tension development at a normal resting length for skeletal muscle?
Question
Question
Question
Question
The diagram shows the relationship between contraction velocity and force. Which of the following muscles is most likely to correspond to muscle number 2 shown on the diagram (assume that all muscles shown are at their normal resting lengths)?
A.

B.
C.
D.
A.
B.
C.
D.
Question
Question
Question
Question
The length-tension diagram shown was obtained from a skeletal muscle with equal numbers of red and white fibers. Supramaximal tetanic stimuli were used to initiate an isometric contraction at each muscle length studied. The resting length was 20 . What is the maximum amount of active tension this muscle is capable of generating at a preload of 100 grams?
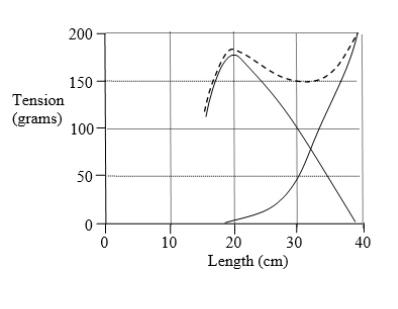
A. 145 to 155 grams
B. 25 to 35 grams
C. 55 to 65 grams
D. 95 to 105 grams
E. Cannot be determined
A. 145 to 155 grams
B. 25 to 35 grams
C. 55 to 65 grams
D. 95 to 105 grams
E. Cannot be determined
Question
The length-tension diagram shown was obtained from a skeletal muscle with equal numbers of red and white fibers. Supramaximal tetanic stimuli were used to initiate an isometric contraction at each muscle length studied. What are the values (in grams) of preload, active tension, and total tension when the muscle length is ?
Question
Question
Question

Unlock Deck
Sign up to unlock the cards in this deck!
Unlock Deck
Unlock Deck
1/22
Play
Full screen (f)
Deck 6: Contraction of Skeletal Muscle
1
During the contraction of a skeletal muscle fiber, the actin and myosin filaments slide past each other. Which of the following represents expected changes in the widths of I bands and A bands during the contraction process?
D
2
A 28-year-old man has been training as a distance runner for the past 6 years. Compared with a sprinter, which of the following is most likely to be decreased in the skeletal muscles of this athlete during resting conditions?
A)Capillary density
B)Glycolytic enzyme content
C)Mitochondrial volume density
D)Myoglobin content
E)Oxidative capacity
A)Capillary density
B)Glycolytic enzyme content
C)Mitochondrial volume density
D)Myoglobin content
E)Oxidative capacity
A
3
The skeletal muscle sarcomere normally has a narrow range of lengths in vivo, but sarcomere length can vary greatly in vitro under nonphysiological conditions. The diagram shows sarcomeres at various lengths. At which length can the sarcomere exert its maximum force during an isometric contraction?
A.
B.
C.
D.
E.
A.
B.
C.
D.
E.
B
4
A 29-year-old woman has been training as a distance runner for the past 5 years. Which set of changes best describes the skeletal muscles of this woman compared with a sprinter?
Unlock Deck
Unlock for access to all 22 flashcards in this deck.
Unlock Deck
k this deck
5
The diagram shows force-velocity relationships for three different skeletal muscles. Which of the follopving curves most likely correspond to glycolytic, oxidative, and mixed muscle types?
Unlock Deck
Unlock for access to all 22 flashcards in this deck.
Unlock Deck
k this deck
6
High-frequency stimulation of a skeletal muscle causes tetanic contraction because the intracellular concentration of which of the following substances increases and remains at high levels?
A)Adenosine triphosphate
B)Calcium
C)Potassium
D)Sodium
E)Troponin
A)Adenosine triphosphate
B)Calcium
C)Potassium
D)Sodium
E)Troponin
Unlock Deck
Unlock for access to all 22 flashcards in this deck.
Unlock Deck
k this deck
7
The diagram shows the relationship between contraction velocity and force. Which of the following muscles is most likely to correspond to muscle number 1 shown on the diagram (assume that all muscles shown are at their normal resting lengths).
A.
B.
C.
D.
E.
A.
B.
C.
D.
E.
Unlock Deck
Unlock for access to all 22 flashcards in this deck.
Unlock Deck
k this deck
8
When a person lifts a 25-pound weight, what type(s) of muscle contraction are involved?
A)Isometric contraction only
B)Isotonic contraction only
C)Isometric contraction followed by isotonic contraction
D)Isotonic contraction followed by isometric contraction
A)Isometric contraction only
B)Isotonic contraction only
C)Isometric contraction followed by isotonic contraction
D)Isotonic contraction followed by isometric contraction
Unlock Deck
Unlock for access to all 22 flashcards in this deck.
Unlock Deck
k this deck
9
The diagram shows the relationship between muscle tension and sarcomere length for muscle. Which point on the curve represents tension development at a normal resting length for skeletal muscle?
Unlock Deck
Unlock for access to all 22 flashcards in this deck.
Unlock Deck
k this deck
10
The diagram shows the relationship between muscle tension and sarcomere length for muscle. Which point 'on the curve represents tension development at a normal resting length for skeletal muscle?
Unlock Deck
Unlock for access to all 22 flashcards in this deck.
Unlock Deck
k this deck
11
A 24-year-old medical student goes to the local gym to lift weights. She begins by bench-pressing 100 pounds as a warm-up procedure and then gradually increases the weight. Which of the following occurs as she adds more weight?
A)Decreased frequency of motor nerve action potentials
B)Decreased velocity of motor nerve action potentials
C)Increased frequency of motor nerve action potentials
D)Increased velocity of motor nerve action potential
E)Involvement of fewer motor units
A)Decreased frequency of motor nerve action potentials
B)Decreased velocity of motor nerve action potentials
C)Increased frequency of motor nerve action potentials
D)Increased velocity of motor nerve action potential
E)Involvement of fewer motor units
Unlock Deck
Unlock for access to all 22 flashcards in this deck.
Unlock Deck
k this deck
12
The increase in muscle mass that typically occurs with weight training is most likely caused by an increase in the number of which of the following?
A)Capillaries
B)Mitochondria
C)Muscle fibers
D)Myofibrils
A)Capillaries
B)Mitochondria
C)Muscle fibers
D)Myofibrils
Unlock Deck
Unlock for access to all 22 flashcards in this deck.
Unlock Deck
k this deck
13
The color of a type I skeletal muscle fiber can be attributed to a relative abundance of which of the following compared to type II muscle fiber?
A)Blood capillaries
B)Mitochondria
C)Myoglobin
D)Myosin adenosine triphosphatase
E)Oxidative enzymes
A)Blood capillaries
B)Mitochondria
C)Myoglobin
D)Myosin adenosine triphosphatase
E)Oxidative enzymes
Unlock Deck
Unlock for access to all 22 flashcards in this deck.
Unlock Deck
k this deck
14
The diagram shows the relationship between contraction velocity and force. Which of the following muscles is most likely to correspond to muscle number 2 shown on the diagram (assume that all muscles shown are at their normal resting lengths)?
A.
B.
C.
D.
A.
B.
C.
D.
Unlock Deck
Unlock for access to all 22 flashcards in this deck.
Unlock Deck
k this deck
15
A 45-year-old man goes to the local gym to lift weights. He begins by bench-pressing 130 pounds as a warm-up procedure and then gradually increases the weight. Which of the following sets of changes occurs as he adds more weight?
Unlock Deck
Unlock for access to all 22 flashcards in this deck.
Unlock Deck
k this deck
16
The dark color of red skeletal muscle (slow twitch muscle) can be attributed to a relative abundance of which of the following compared with white skeletal muscle (fast twitch muscle)?
A)Blood capillaries
B)Mitochondria
C)Myoglobin
D)Myosin adenosine triphosphatase
E)Oxidative enzymes
A)Blood capillaries
B)Mitochondria
C)Myoglobin
D)Myosin adenosine triphosphatase
E)Oxidative enzymes
Unlock Deck
Unlock for access to all 22 flashcards in this deck.
Unlock Deck
k this deck
17
A 24-year-old woman is admitted to the emergency department after an automobile accident in which lacerations to the left wrist severed a major tendon. The severed ends of the tendon were overlapped by 6 cm to facilitate suturing and reattachment. Which of the following characteristics would be expected after 6 weeks compared with the preinjured muscle? Assume that series growth of sarcomeres cannot be completed within 6 weeks.
A.
B.
C.
D.
E.
A.
B.
C.
D.
E.
Unlock Deck
Unlock for access to all 22 flashcards in this deck.
Unlock Deck
k this deck
18
The length-tension diagram shown was obtained from a skeletal muscle with equal numbers of red and white fibers. Supramaximal tetanic stimuli were used to initiate an isometric contraction at each muscle length studied. The resting length was 20 . What is the maximum amount of active tension this muscle is capable of generating at a preload of 100 grams?
A. 145 to 155 grams
B. 25 to 35 grams
C. 55 to 65 grams
D. 95 to 105 grams
E. Cannot be determined
A. 145 to 155 grams
B. 25 to 35 grams
C. 55 to 65 grams
D. 95 to 105 grams
E. Cannot be determined
Unlock Deck
Unlock for access to all 22 flashcards in this deck.
Unlock Deck
k this deck
19
The length-tension diagram shown was obtained from a skeletal muscle with equal numbers of red and white fibers. Supramaximal tetanic stimuli were used to initiate an isometric contraction at each muscle length studied. What are the values (in grams) of preload, active tension, and total tension when the muscle length is ?
Unlock Deck
Unlock for access to all 22 flashcards in this deck.
Unlock Deck
k this deck
20
A physiology experiment is conducted in which a skeletal muscle twitch is initiated with an electrical stimulator. Which factor contributes to the termination of a typical skeletal muscle twitch?
A)Calcium uptake by sarcoplasmic reticulum
B)Closure of transverse tubules
C)Depletion of calcium stores from sarcoplasmic reticulum
D)Exhaustion of muscle adenosine triphosphate stores
E)Stimulation of dihydropyridine (DHP) receptors
A)Calcium uptake by sarcoplasmic reticulum
B)Closure of transverse tubules
C)Depletion of calcium stores from sarcoplasmic reticulum
D)Exhaustion of muscle adenosine triphosphate stores
E)Stimulation of dihydropyridine (DHP) receptors
Unlock Deck
Unlock for access to all 22 flashcards in this deck.
Unlock Deck
k this deck
21
The relatively high maximum velocity of shortening of a skeletal muscle containing predominately type II fibers can be partially attributed to a relative abundance of which of the following substances, compared to a muscle containing predominately type I fibers?
A)Blood capillaries
B)Mitochondria
C)Myoglobin
D)Myosin adenosine triphosphatase
E)Oxidative enzymes
A)Blood capillaries
B)Mitochondria
C)Myoglobin
D)Myosin adenosine triphosphatase
E)Oxidative enzymes
Unlock Deck
Unlock for access to all 22 flashcards in this deck.
Unlock Deck
k this deck
22
A nerve that normally innervates a predominately type I muscle is anastomosed (connected) to a predominately type II muscle. Which of the following is most likely to increase in the predominately type II muscle after transinnervation surgery?
A)Glycolytic capacity
B)Fiber diameter
C)Mitochondrial content
D)Maximum velocity of contraction
A)Glycolytic capacity
B)Fiber diameter
C)Mitochondrial content
D)Maximum velocity of contraction
Unlock Deck
Unlock for access to all 22 flashcards in this deck.
Unlock Deck
k this deck
Unlock Deck
Unlock for access to all 22 flashcards in this deck.


