Deck 2: Descriptive Statistics
Full screen (f)
Question
The grade point averages for 40 students are listed below. 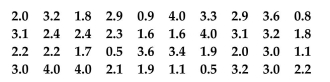
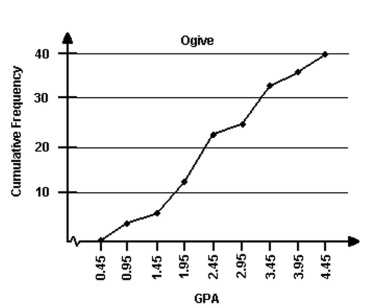
Construct an ogive using eight classes.
Construct an ogive using eight classes.
Question
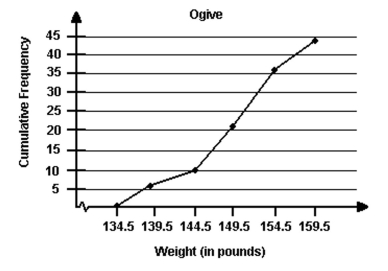
Use the given frequency distribution to construct a cumulative frequency distribution and an ogive.
 29
29
29 Question
Question
Use the given frequency distribution to construct a cumulative frequency distribution and an ogive.
Question
Question
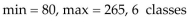
Use the maximum and minimum data entries and the number of classes to find the class width, the lower class limits,
and the upper class limits.
and the upper class limits.
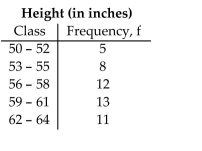
Question
Question
The grade point averages for 40 students are listed below.
Construct a frequency histogram, a relative frequency histogram and a frequency polygon using eight classes.
Construct a frequency histogram, a relative frequency histogram and a frequency polygon using eight classes.
Question
Provide an appropriate response.
Use the ogive below to approximate the number in the sample.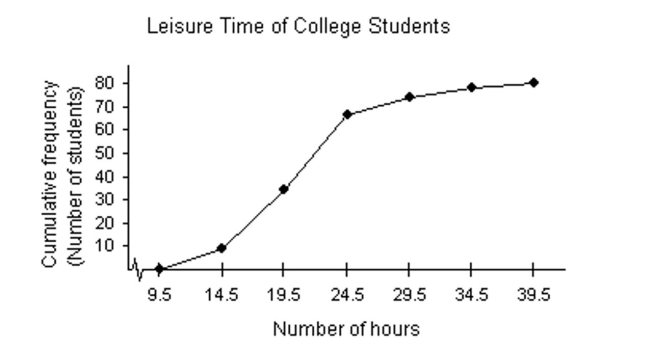
A)80
B)100
C)341
D)28
Use the ogive below to approximate the number in the sample.
A)80
B)100
C)341
D)28
Question
Use the relative frequency histogram to
a)identify the class with the greatest, and the class with the least, relative frequency.
b)approximate the greatest and least relative frequencies.
c)approximate the relative frequency of the fifth class.
a)identify the class with the greatest, and the class with the least, relative frequency.
b)approximate the greatest and least relative frequencies.
c)approximate the relative frequency of the fifth class.
Question
Question
Use the given frequency distribution to construct a cumulative frequency distribution and an ogive.
 2
2
8
5
28
5
Question
Use the given frequency distribution to construct a frequency histogram, a relative frequency histogram and a frequency
polygon.
polygon.
Question
Use the given frequency distribution to construct a frequency histogram, a relative frequency histogram and a frequency
polygon.
polygon.
Question
Question
Question
The grade point averages for 40 students are listed below.
Construct a frequency distribution, a relative frequency distribution, and a cumulative frequency distribution
using eight classes. Include the midpoints of the classes.
Construct a frequency distribution, a relative frequency distribution, and a cumulative frequency distribution
using eight classes. Include the midpoints of the classes.
Question
Question
Provide an appropriate response.
Use the ogive below to approximate the cumulative frequency for 24 hours.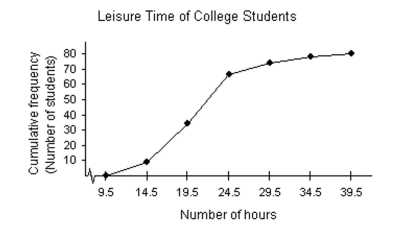
A)63
B)17
C)27
D)75
Use the ogive below to approximate the cumulative frequency for 24 hours.
A)63
B)17
C)27
D)75
Question
Use the given frequency distribution to construct a cumulative frequency distribution and an ogive.
Question
Provide an appropriate response.
For the dot plot below, what is the maximum and what is the minimum entry?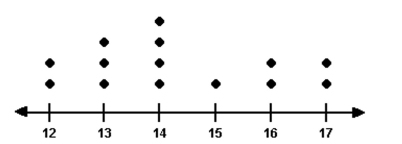
A)max: 17; min: 12
B)max: 54; min: 15
C)max: 54; min: 12
D)max: 14; min: 12
For the dot plot below, what is the maximum and what is the minimum entry?
A)max: 17; min: 12
B)max: 54; min: 15
C)max: 54; min: 12
D)max: 14; min: 12
Question
The Highway Patrol, using radar, checked the speeds (in mph)of 30 passing motorists at a checkpoint. The results are
listed below.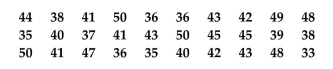
Construct a frequency histogram, a relative frequency histogram and a frequency polygon using six classes.
listed below.
Construct a frequency histogram, a relative frequency histogram and a frequency polygon using six classes.
Question
Provide an appropriate response.
A study was conducted to determine how people get jobs. Four hundred subjects were randomly selected and
the results are listed below.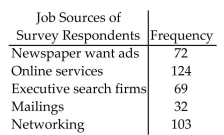 Construct a Pareto chart of the data.
A study was conducted to determine how people get jobs. Four hundred subjects were randomly selected and
the results are listed below.
Construct a Pareto chart of the data. Question
Provide an appropriate response.
The numbers of home runs that Sammy Sosa hit in the first 15 years of his major league baseball career are
listed below. Make a stem-and-leaf plot for this data. What can you conclude about the data?
The numbers of home runs that Sammy Sosa hit in the first 15 years of his major league baseball career are
listed below. Make a stem-and-leaf plot for this data. What can you conclude about the data?
Question
The heights (in inches)of 30 adult males are listed below. 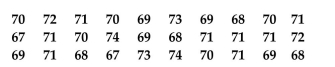
Construct a frequency polygon using five classes.
Construct a frequency polygon using five classes.
Question
Question
Provide an appropriate response.
A study was conducted to determine how people get jobs. Four hundred subjects were randomly selected and
the results are listed below.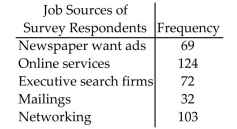 Construct a pie chart of the data.
A study was conducted to determine how people get jobs. Four hundred subjects were randomly selected and
the results are listed below.
Construct a pie chart of the data. Question
The Highway Patrol, using radar, checked the speeds (in mph)of 30 passing motorists at a checkpoint. The results are
listed below.
Construct an ogive using six classes.
listed below.
Construct an ogive using six classes.
Question
Provide an appropriate response.
The heights (in inches)of 30 adult males are listed below. Construct a dot plot for the data.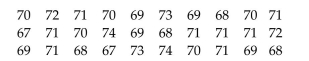
The heights (in inches)of 30 adult males are listed below. Construct a dot plot for the data.
Question
The heights (in inches)of 30 adult males are listed below.
Construct a relative frequency histogram using five classes.
Construct a relative frequency histogram using five classes.
Question
Provide an appropriate response.
The heights (in inches)of 30 adult males are listed below. Construct a stem-and-leaf chart for the data.
What can you conclude about the data?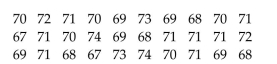
The heights (in inches)of 30 adult males are listed below. Construct a stem-and-leaf chart for the data.
What can you conclude about the data?
Question
Question
Provide an appropriate response.
The numbers of home runs that Barry Bonds hit in the first 18 years of his major league baseball career are
listed below. Make a stem-and-leaf plot for this data. What can you conclude about the data?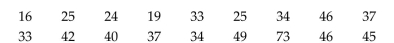
The numbers of home runs that Barry Bonds hit in the first 18 years of his major league baseball career are
listed below. Make a stem-and-leaf plot for this data. What can you conclude about the data?
Question
The heights (in inches)of 30 adult males are listed below.
Construct a frequency distribution, a relative frequency distribution, and a cumulative frequency distribution
using five classes.
Construct a frequency distribution, a relative frequency distribution, and a cumulative frequency distribution
using five classes.
Question
The heights (in inches)of 30 adult males are listed below.
Construct a frequency histogram using five classes.
Construct a frequency histogram using five classes.
Question
Match the description of the sample with the correct plot.
-Time (in minutes)it takes a sample of employees to drive to work
A)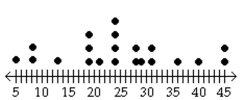
B)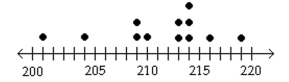
C) Key:
D) Key:
-Time (in minutes)it takes a sample of employees to drive to work
A)
B)
C) Key:
D) Key:
Question
Provide an appropriate response.
Listed below are the ACT scores of 40 randomly selected students at a major university.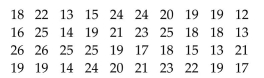 a)Construct a relative frequency histogram of the data, using eight classes.
b)If the university wants to accept the top 90% of the applicants, what should the minimum score be?
c)If the university sets the minimum score at 17, what percent of the applicants will be accepted?
Listed below are the ACT scores of 40 randomly selected students at a major university.
a)Construct a relative frequency histogram of the data, using eight classes.b)If the university wants to accept the top 90% of the applicants, what should the minimum score be?
c)If the university sets the minimum score at 17, what percent of the applicants will be accepted?
Question
Provide an appropriate response.
The Highway Patrol, using radar, checked the speeds (in mph)of 30 passing motorists at a checkpoint. The
results are listed below. Construct a dot plot for the data.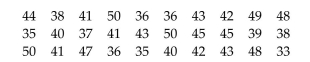
The Highway Patrol, using radar, checked the speeds (in mph)of 30 passing motorists at a checkpoint. The
results are listed below. Construct a dot plot for the data.
Question
The Highway Patrol, using radar, checked the speeds (in mph)of 30 passing motorists at a checkpoint. The results are
listed below.
Construct a frequency distribution, a relative frequency distribution, and a cumulative frequency distribution
using six classes.
listed below.
Construct a frequency distribution, a relative frequency distribution, and a cumulative frequency distribution
using six classes.
Question
Provide an appropriate response.
The Highway Patrol, using radar, checked the speeds (in mph)of 30 passing motorists at a checkpoint. The
results are listed below. Construct a stem-and-leaf plot for the data, listing each stem twice. What can you
conclude about the data?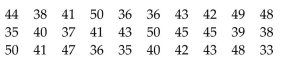
The Highway Patrol, using radar, checked the speeds (in mph)of 30 passing motorists at a checkpoint. The
results are listed below. Construct a stem-and-leaf plot for the data, listing each stem twice. What can you
conclude about the data?
Question
Provide an appropriate response.
The data below represent the smoking prevalence among U.S. adults over a 35-year period. Use a time series
chart to display the data. Describe any trends shown.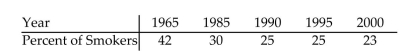
The data below represent the smoking prevalence among U.S. adults over a 35-year period. Use a time series
chart to display the data. Describe any trends shown.
Question
Provide an appropriate response.
The numbers of home runs that Barry Bonds hit in the first 10 years of his major league baseball career are
listed below. Use a scatter plot to display the data. Is there a relationship between the home runs and the
batting averages?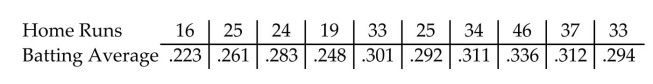
The numbers of home runs that Barry Bonds hit in the first 10 years of his major league baseball career are
listed below. Use a scatter plot to display the data. Is there a relationship between the home runs and the
batting averages?
Question
Provide an appropriate response.
Women were allowed to enter the Boston Marathon for the first time in 1972. Listed below are the winning
womenʹs times (in minutes)for the first 10 years. Use a time series chart to display the data.
Women were allowed to enter the Boston Marathon for the first time in 1972. Listed below are the winning
womenʹs times (in minutes)for the first 10 years. Use a time series chart to display the data.
Question
Provide an appropriate response.
The graph below shows the number of car accidents occurring in one city in each of the years 1 through 6. The
number of accidents dropped in year 3 after a new speed limit was imposed. Does the graph distort the data?
How would you redesign the graph to be less misleading?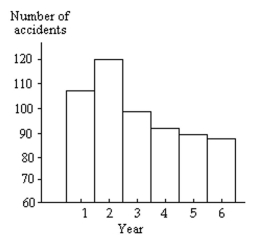
The graph below shows the number of car accidents occurring in one city in each of the years 1 through 6. The
number of accidents dropped in year 3 after a new speed limit was imposed. Does the graph distort the data?
How would you redesign the graph to be less misleading?
Question
Provide an appropriate response.
A study was conducted to determine how certain families pay on their credit card balances. Two hundred
families with a household annual income between $25,000 and $49,999 were randomly selected and the results
are listed below. Construct a pie chart of the data.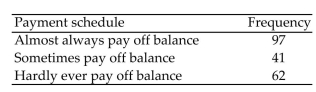
A study was conducted to determine how certain families pay on their credit card balances. Two hundred
families with a household annual income between $25,000 and $49,999 were randomly selected and the results
are listed below. Construct a pie chart of the data.
Question
Provide an appropriate response.
The number of beds in a sample of 24 hospitals are listed below. Construct a stem -and-leaf plot for the data.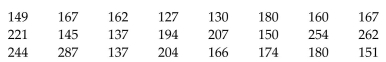
The number of beds in a sample of 24 hospitals are listed below. Construct a stem -and-leaf plot for the data.
Question
Provide an appropriate response.
The lengths, in kilometers, of the worldʹs largest subway systems are listed below. Construct a Pareto chart for
the data.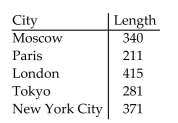
The lengths, in kilometers, of the worldʹs largest subway systems are listed below. Construct a Pareto chart for
the data.
Question
Provide an appropriate response.
The data below represent the alcohol-related driving fatalities, in thousands, in the United States over a
20-year period. Use a time series chart to display the data. Describe any trends shown.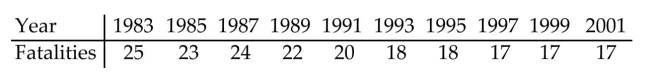
The data below represent the alcohol-related driving fatalities, in thousands, in the United States over a
20-year period. Use a time series chart to display the data. Describe any trends shown.
Question
Provide an appropriate response.
The heights (in inches)of 30 adult males are listed below. Construct a Pareto chart for the data.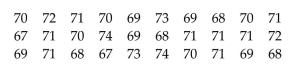
The heights (in inches)of 30 adult males are listed below. Construct a Pareto chart for the data.
Question
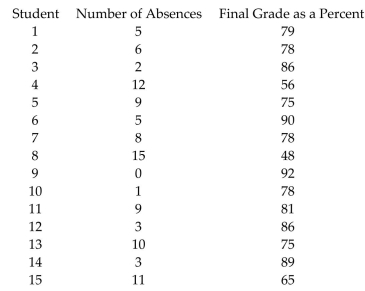
Provide an appropriate response.
The data below represent the numbers of absences and the final grades of 15 randomly selected students from a
statistics class. Use a scatter plot to display the data. Is there a relationship between the studentsʹ absences and
their final grades?
The data below represent the numbers of absences and the final grades of 15 randomly selected students from a
statistics class. Use a scatter plot to display the data. Is there a relationship between the studentsʹ absences and
their final grades?
Question
Question
Provide an appropriate response.
A safety engineer wishes to use the following data to show the number of deaths from the collision of
passenger cars with trucks on a particular highway. Use a time series chart to display the data. Describe any
trends shown.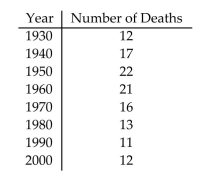
A safety engineer wishes to use the following data to show the number of deaths from the collision of
passenger cars with trucks on a particular highway. Use a time series chart to display the data. Describe any
trends shown.
Question
Provide an appropriate response.
The five longest winning streaks for NCAA Menʹs Division I Basketball are listed below. Construct a Pareto
chart for the data.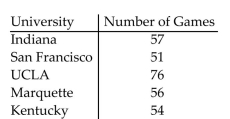
The five longest winning streaks for NCAA Menʹs Division I Basketball are listed below. Construct a Pareto
chart for the data.
Question
Provide an appropriate response.
-Find the mean, median, and mode of the data.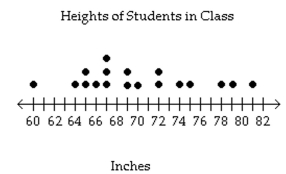
A)
B)
C)
D)
-Find the mean, median, and mode of the data.
A)
B)
C)
D)
Question
Provide an appropriate response.
Of the 55 tornado fatalities in a recent year, the locations of the victims are listed below. Construct a pie chart
of the data.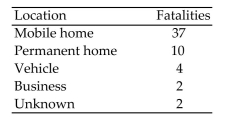
Of the 55 tornado fatalities in a recent year, the locations of the victims are listed below. Construct a pie chart
of the data.
Question
Provide an appropriate response.
Determine whether the approximate shape of the distribution in the histogram is symmetric, uniform, skewed left, skewed right, or none of these.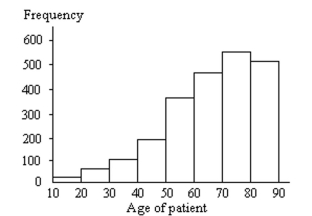
A)skewed left
B)skewed right
C)symmetric
D)uniform
Determine whether the approximate shape of the distribution in the histogram is symmetric, uniform, skewed left, skewed right, or none of these.
A)skewed left
B)skewed right
C)symmetric
D)uniform
Question
Provide an appropriate response.
Determine whether the approximate shape of the distribution in the histogram is symmetric, uniform, skewed left, skewed right, or none of these.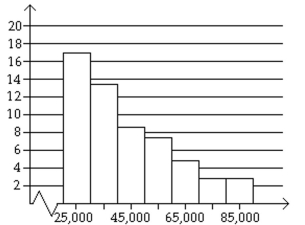
A)skewed right
B)skewed left
C)symmetric
D)uniform
Determine whether the approximate shape of the distribution in the histogram is symmetric, uniform, skewed left, skewed right, or none of these.
A)skewed right
B)skewed left
C)symmetric
D)uniform
Question
Provide an appropriate response.
The data below represent the infant mortality rates and the life expectancies for seven selected countries in
Africa. Use a scatter plot to display the data.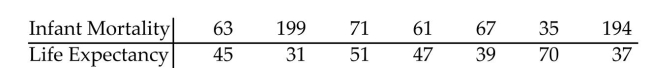
The data below represent the infant mortality rates and the life expectancies for seven selected countries in
Africa. Use a scatter plot to display the data.
Question
Provide an appropriate response.
The number of minutes that a dentist kept 20 patients waiting beyond their appointment times are listed below.
Construct a stem-and-leaf plot for the data.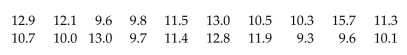
The number of minutes that a dentist kept 20 patients waiting beyond their appointment times are listed below.
Construct a stem-and-leaf plot for the data.
Question
Provide an appropriate response.
Use a scatter plot to display the data below. All measurements are in milligrams per cigarette.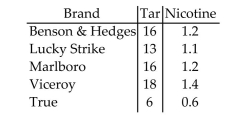
Use a scatter plot to display the data below. All measurements are in milligrams per cigarette.
Question
Question
Provide an appropriate response.
The amounts of money won by the top ten finishers in a recent Daytona 500 are listed below. Find the mean
and median winnings. Round to the nearest dollar. Which measure- the mean or the median- best represents
the data? Explain your reasoning.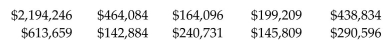
The amounts of money won by the top ten finishers in a recent Daytona 500 are listed below. Find the mean
and median winnings. Round to the nearest dollar. Which measure- the mean or the median- best represents
the data? Explain your reasoning.
Question
Provide an appropriate response.
Use the histogram below to approximate the mode heart rate of adults in the gym.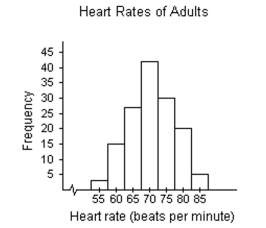
A)70
B)42
C)55
D)2
Use the histogram below to approximate the mode heart rate of adults in the gym.
A)70
B)42
C)55
D)2
Question
Question
Question
Question
Question
Question
Provide an appropriate response.
The numbers of home runs that Barry Bonds hit in the first 18 years of his major league baseball career are
listed below. Find the mean and median number of home runs. Round the mean to the nearest whole number.
Which measure of central tendency- the mean or the median- best represents the data? Explain your
reasoning.
Question
Provide an appropriate response.
Find the mean, median, and mode of the following numbers:
Find the mean, median, and mode of the following numbers:
Question
Provide an appropriate response.
Use the histogram below to approximate the median heart rate of adults in the gym.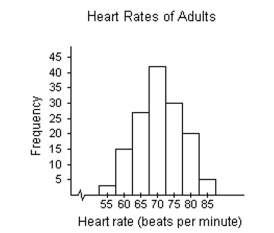
A)70
B)65
C)75
D)42
Use the histogram below to approximate the median heart rate of adults in the gym.
A)70
B)65
C)75
D)42
Question
Question
Question
Question
Question
Question
Provide an appropriate response.
Use the histogram below to approximate the mean heart rate of adults in the gym.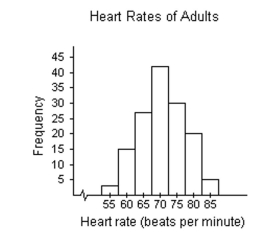
A)70.8
B)1425.7
C)70
D)31.6
Use the histogram below to approximate the mean heart rate of adults in the gym.
A)70.8
B)1425.7
C)70
D)31.6
Question
Question
Provide an appropriate response.
The numbers of runs batted in that Sammy Sosa hit in the first 15 years of his major league baseball career are
listed below. Find the mean and median number of runs batted in. Round the mean to the nearest whole
number.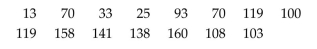
The numbers of runs batted in that Sammy Sosa hit in the first 15 years of his major league baseball career are
listed below. Find the mean and median number of runs batted in. Round the mean to the nearest whole
number.
Question

Unlock Deck
Sign up to unlock the cards in this deck!
Unlock Deck
Unlock Deck
1/165
Play
Full screen (f)
Deck 2: Descriptive Statistics
1
The grade point averages for 40 students are listed below.
Construct an ogive using eight classes.
Construct an ogive using eight classes.
2
Use the given frequency distribution to construct a cumulative frequency distribution and an ogive.
29
29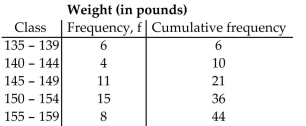
3
Use the maximum and minimum data entries and the number of classes to find the class width, the lower class limits,
and the upper class limits.
min =1, max =30,6 classes
and the upper class limits.
min =1, max =30,6 classes
Class width = 5, Lower class limits: 1, 6, 11, 16, 21, 26; Upper class limits: 5, 10, 15, 20, 25, 30
4
Use the given frequency distribution to construct a cumulative frequency distribution and an ogive.
Unlock Deck
Unlock for access to all 165 flashcards in this deck.
Unlock Deck
k this deck
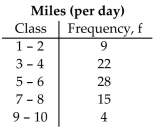
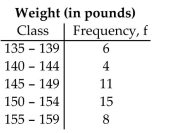
5
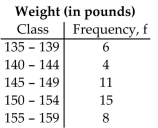
Use the given frequency distribution to find the
(a)class width.
(b)class midpoints of the first class.
(c)class boundaries of the first class.
-
A) (a) 5
(b) 137
(c) 134.5-139.5
B) (a) 5
(b) 137
(c)
C) (a) 4
(b)
(c)
D) (a) 4
(b)
(c) 29
(a)class width.
(b)class midpoints of the first class.
(c)class boundaries of the first class.
-
A) (a) 5
(b) 137
(c) 134.5-139.5
B) (a) 5
(b) 137
(c)
C) (a) 4
(b)
(c)
D) (a) 4
(b)
(c) 29
Unlock Deck
Unlock for access to all 165 flashcards in this deck.
Unlock Deck
k this deck
6
Use the maximum and minimum data entries and the number of classes to find the class width, the lower class limits,
and the upper class limits.
and the upper class limits.
Unlock Deck
Unlock for access to all 165 flashcards in this deck.
Unlock Deck
k this deck
7
Provide an appropriate response.
A sample of candies have weights that vary from 2.35 grams to 4.75 grams. Use this information to find the upper and lower limits of the first class if you wish to construct a frequency distribution with 12 classes.
A)2.35-2.55
B)2.35-2.54
C)2.35-2.65
D)2.35-2.75
A sample of candies have weights that vary from 2.35 grams to 4.75 grams. Use this information to find the upper and lower limits of the first class if you wish to construct a frequency distribution with 12 classes.
A)2.35-2.55
B)2.35-2.54
C)2.35-2.65
D)2.35-2.75
Unlock Deck
Unlock for access to all 165 flashcards in this deck.
Unlock Deck
k this deck
8
The grade point averages for 40 students are listed below.
Construct a frequency histogram, a relative frequency histogram and a frequency polygon using eight classes.
Construct a frequency histogram, a relative frequency histogram and a frequency polygon using eight classes.
Unlock Deck
Unlock for access to all 165 flashcards in this deck.
Unlock Deck
k this deck
9
Provide an appropriate response.
Use the ogive below to approximate the number in the sample.
A)80
B)100
C)341
D)28
Use the ogive below to approximate the number in the sample.
A)80
B)100
C)341
D)28
Unlock Deck
Unlock for access to all 165 flashcards in this deck.
Unlock Deck
k this deck
10
Use the relative frequency histogram to
a)identify the class with the greatest, and the class with the least, relative frequency.
b)approximate the greatest and least relative frequencies.
c)approximate the relative frequency of the fifth class.
a)identify the class with the greatest, and the class with the least, relative frequency.
b)approximate the greatest and least relative frequencies.
c)approximate the relative frequency of the fifth class.
Unlock Deck
Unlock for access to all 165 flashcards in this deck.
Unlock Deck
k this deck
11
Provide an appropriate response.
A city in the Pacific Northwest recorded its highest temperature at 91 degrees Fahrenheit and its lowest temperature at 12 degrees Fahrenheit for a particular year. Use this information to find the upper and lower
Limits of the first class if you wish to construct a frequency distribution with 10 classes.
A)12-19
B)12-20
C)7-17
D)12-18
Unlock Deck
Unlock for access to all 165 flashcards in this deck.
Unlock Deck
k this deck
12
Use the given frequency distribution to construct a cumulative frequency distribution and an ogive.
2
8
5
28
5
Unlock Deck
Unlock for access to all 165 flashcards in this deck.
Unlock Deck
k this deck
13
Use the given frequency distribution to construct a frequency histogram, a relative frequency histogram and a frequency
polygon.
polygon.
Unlock Deck
Unlock for access to all 165 flashcards in this deck.
Unlock Deck
k this deck
14
Use the given frequency distribution to construct a frequency histogram, a relative frequency histogram and a frequency
polygon.
polygon.
Unlock Deck
Unlock for access to all 165 flashcards in this deck.
Unlock Deck
k this deck
15
Use the given frequency distribution to find the
(a)class width.
(b)class midpoints of the first class.
(c)class boundaries of the first class.
- 2 8
5
A) (a) 2
(b)
(c)
B) (a) 1
(b)
(c)
C) (a) 2
(b) 1
(c)
D) (a) 1
(b) 1
(c) 1-2
(a)class width.
(b)class midpoints of the first class.
(c)class boundaries of the first class.
- 2 8
5
A) (a) 2
(b)
(c)
B) (a) 1
(b)
(c)
C) (a) 2
(b) 1
(c)
D) (a) 1
(b) 1
(c) 1-2
Unlock Deck
Unlock for access to all 165 flashcards in this deck.
Unlock Deck
k this deck
16
Use the given frequency distribution to find the
(a)class width.
(b)class midpoints of the first class.
(c)class boundaries of the first class.
-
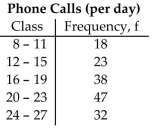
A) (a) 4
(b)
(c) 7.5-11.5
B) (a) 3
(b)
(c)
C) (a) 4
(b)
(c) 8-11
D) (a) 3
(b)
(c)
(a)class width.
(b)class midpoints of the first class.
(c)class boundaries of the first class.
-
A) (a) 4
(b)
(c) 7.5-11.5
B) (a) 3
(b)
(c)
C) (a) 4
(b)
(c) 8-11
D) (a) 3
(b)
(c)
Unlock Deck
Unlock for access to all 165 flashcards in this deck.
Unlock Deck
k this deck
17
The grade point averages for 40 students are listed below.
Construct a frequency distribution, a relative frequency distribution, and a cumulative frequency distribution
using eight classes. Include the midpoints of the classes.
Construct a frequency distribution, a relative frequency distribution, and a cumulative frequency distribution
using eight classes. Include the midpoints of the classes.
Unlock Deck
Unlock for access to all 165 flashcards in this deck.
Unlock Deck
k this deck
18
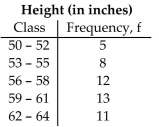
Use the given frequency distribution to find the
(a)class width.
(b)class midpoints of the first class.
(c)class boundaries of the first class.
-
A) (a) 3
(b) 51
(c)
B) (a) 2
(b)
(c)
C) (a) 3
(b) 51
(c) 50-52
D) (a) 2
(b)
(c)
(a)class width.
(b)class midpoints of the first class.
(c)class boundaries of the first class.
-
A) (a) 3
(b) 51
(c)
B) (a) 2
(b)
(c)
C) (a) 3
(b) 51
(c) 50-52
D) (a) 2
(b)
(c)
Unlock Deck
Unlock for access to all 165 flashcards in this deck.
Unlock Deck
k this deck
19
Provide an appropriate response.
Use the ogive below to approximate the cumulative frequency for 24 hours.
A)63
B)17
C)27
D)75
Use the ogive below to approximate the cumulative frequency for 24 hours.
A)63
B)17
C)27
D)75
Unlock Deck
Unlock for access to all 165 flashcards in this deck.
Unlock Deck
k this deck
20
Use the given frequency distribution to construct a cumulative frequency distribution and an ogive.
Unlock Deck
Unlock for access to all 165 flashcards in this deck.
Unlock Deck
k this deck
21
Provide an appropriate response.
For the dot plot below, what is the maximum and what is the minimum entry?
A)max: 17; min: 12
B)max: 54; min: 15
C)max: 54; min: 12
D)max: 14; min: 12
For the dot plot below, what is the maximum and what is the minimum entry?
A)max: 17; min: 12
B)max: 54; min: 15
C)max: 54; min: 12
D)max: 14; min: 12
Unlock Deck
Unlock for access to all 165 flashcards in this deck.
Unlock Deck
k this deck
22
The Highway Patrol, using radar, checked the speeds (in mph)of 30 passing motorists at a checkpoint. The results are
listed below.
Construct a frequency histogram, a relative frequency histogram and a frequency polygon using six classes.
listed below.
Construct a frequency histogram, a relative frequency histogram and a frequency polygon using six classes.
Unlock Deck
Unlock for access to all 165 flashcards in this deck.
Unlock Deck
k this deck
23
Provide an appropriate response.
A study was conducted to determine how people get jobs. Four hundred subjects were randomly selected and
the results are listed below. Construct a Pareto chart of the data.
A study was conducted to determine how people get jobs. Four hundred subjects were randomly selected and
the results are listed below.
Construct a Pareto chart of the data. Unlock Deck
Unlock for access to all 165 flashcards in this deck.
Unlock Deck
k this deck
24
Provide an appropriate response.
The numbers of home runs that Sammy Sosa hit in the first 15 years of his major league baseball career are
listed below. Make a stem-and-leaf plot for this data. What can you conclude about the data?
The numbers of home runs that Sammy Sosa hit in the first 15 years of his major league baseball career are
listed below. Make a stem-and-leaf plot for this data. What can you conclude about the data?
Unlock Deck
Unlock for access to all 165 flashcards in this deck.
Unlock Deck
k this deck
25
The heights (in inches)of 30 adult males are listed below.
Construct a frequency polygon using five classes.
Construct a frequency polygon using five classes.
Unlock Deck
Unlock for access to all 165 flashcards in this deck.
Unlock Deck
k this deck
26
Provide an appropriate response.
-For the stem-and-leaf plot below, what is the maximum and what is the minimum entry?
A)max: 17.8; min: 11.6
B)max: 178; min: 116
C)max: 17.7; min: 11.6
D)max: 17.8; min: 11.9
-For the stem-and-leaf plot below, what is the maximum and what is the minimum entry?
A)max: 17.8; min: 11.6
B)max: 178; min: 116
C)max: 17.7; min: 11.6
D)max: 17.8; min: 11.9
Unlock Deck
Unlock for access to all 165 flashcards in this deck.
Unlock Deck
k this deck
27
Provide an appropriate response.
A study was conducted to determine how people get jobs. Four hundred subjects were randomly selected and
the results are listed below. Construct a pie chart of the data.
A study was conducted to determine how people get jobs. Four hundred subjects were randomly selected and
the results are listed below.
Construct a pie chart of the data. Unlock Deck
Unlock for access to all 165 flashcards in this deck.
Unlock Deck
k this deck
28
The Highway Patrol, using radar, checked the speeds (in mph)of 30 passing motorists at a checkpoint. The results are
listed below.
Construct an ogive using six classes.
listed below.
Construct an ogive using six classes.
Unlock Deck
Unlock for access to all 165 flashcards in this deck.
Unlock Deck
k this deck
29
Provide an appropriate response.
The heights (in inches)of 30 adult males are listed below. Construct a dot plot for the data.
The heights (in inches)of 30 adult males are listed below. Construct a dot plot for the data.
Unlock Deck
Unlock for access to all 165 flashcards in this deck.
Unlock Deck
k this deck
30
The heights (in inches)of 30 adult males are listed below.
Construct a relative frequency histogram using five classes.
Construct a relative frequency histogram using five classes.
Unlock Deck
Unlock for access to all 165 flashcards in this deck.
Unlock Deck
k this deck
31
Provide an appropriate response.
The heights (in inches)of 30 adult males are listed below. Construct a stem-and-leaf chart for the data.
What can you conclude about the data?
The heights (in inches)of 30 adult males are listed below. Construct a stem-and-leaf chart for the data.
What can you conclude about the data?
Unlock Deck
Unlock for access to all 165 flashcards in this deck.
Unlock Deck
k this deck
32
Provide an appropriate response.
Explain the difference between class limits and class boundaries.
Explain the difference between class limits and class boundaries.
Unlock Deck
Unlock for access to all 165 flashcards in this deck.
Unlock Deck
k this deck
33
Provide an appropriate response.
The numbers of home runs that Barry Bonds hit in the first 18 years of his major league baseball career are
listed below. Make a stem-and-leaf plot for this data. What can you conclude about the data?
The numbers of home runs that Barry Bonds hit in the first 18 years of his major league baseball career are
listed below. Make a stem-and-leaf plot for this data. What can you conclude about the data?
Unlock Deck
Unlock for access to all 165 flashcards in this deck.
Unlock Deck
k this deck
34
The heights (in inches)of 30 adult males are listed below.
Construct a frequency distribution, a relative frequency distribution, and a cumulative frequency distribution
using five classes.
Construct a frequency distribution, a relative frequency distribution, and a cumulative frequency distribution
using five classes.
Unlock Deck
Unlock for access to all 165 flashcards in this deck.
Unlock Deck
k this deck
35
The heights (in inches)of 30 adult males are listed below.
Construct a frequency histogram using five classes.
Construct a frequency histogram using five classes.
Unlock Deck
Unlock for access to all 165 flashcards in this deck.
Unlock Deck
k this deck
36
Match the description of the sample with the correct plot.
-Time (in minutes)it takes a sample of employees to drive to work
A)
B)
C) Key:
D) Key:
-Time (in minutes)it takes a sample of employees to drive to work
A)
B)
C) Key:
D) Key:
Unlock Deck
Unlock for access to all 165 flashcards in this deck.
Unlock Deck
k this deck
37
Provide an appropriate response.
Listed below are the ACT scores of 40 randomly selected students at a major university. a)Construct a relative frequency histogram of the data, using eight classes.
b)If the university wants to accept the top 90% of the applicants, what should the minimum score be?
c)If the university sets the minimum score at 17, what percent of the applicants will be accepted?
Listed below are the ACT scores of 40 randomly selected students at a major university.
a)Construct a relative frequency histogram of the data, using eight classes.b)If the university wants to accept the top 90% of the applicants, what should the minimum score be?
c)If the university sets the minimum score at 17, what percent of the applicants will be accepted?
Unlock Deck
Unlock for access to all 165 flashcards in this deck.
Unlock Deck
k this deck
38
Provide an appropriate response.
The Highway Patrol, using radar, checked the speeds (in mph)of 30 passing motorists at a checkpoint. The
results are listed below. Construct a dot plot for the data.
The Highway Patrol, using radar, checked the speeds (in mph)of 30 passing motorists at a checkpoint. The
results are listed below. Construct a dot plot for the data.
Unlock Deck
Unlock for access to all 165 flashcards in this deck.
Unlock Deck
k this deck
39
The Highway Patrol, using radar, checked the speeds (in mph)of 30 passing motorists at a checkpoint. The results are
listed below.
Construct a frequency distribution, a relative frequency distribution, and a cumulative frequency distribution
using six classes.
listed below.
Construct a frequency distribution, a relative frequency distribution, and a cumulative frequency distribution
using six classes.
Unlock Deck
Unlock for access to all 165 flashcards in this deck.
Unlock Deck
k this deck
40
Provide an appropriate response.
The Highway Patrol, using radar, checked the speeds (in mph)of 30 passing motorists at a checkpoint. The
results are listed below. Construct a stem-and-leaf plot for the data, listing each stem twice. What can you
conclude about the data?
The Highway Patrol, using radar, checked the speeds (in mph)of 30 passing motorists at a checkpoint. The
results are listed below. Construct a stem-and-leaf plot for the data, listing each stem twice. What can you
conclude about the data?
Unlock Deck
Unlock for access to all 165 flashcards in this deck.
Unlock Deck
k this deck
41
Provide an appropriate response.
The data below represent the smoking prevalence among U.S. adults over a 35-year period. Use a time series
chart to display the data. Describe any trends shown.
The data below represent the smoking prevalence among U.S. adults over a 35-year period. Use a time series
chart to display the data. Describe any trends shown.
Unlock Deck
Unlock for access to all 165 flashcards in this deck.
Unlock Deck
k this deck
42
Provide an appropriate response.
The numbers of home runs that Barry Bonds hit in the first 10 years of his major league baseball career are
listed below. Use a scatter plot to display the data. Is there a relationship between the home runs and the
batting averages?
The numbers of home runs that Barry Bonds hit in the first 10 years of his major league baseball career are
listed below. Use a scatter plot to display the data. Is there a relationship between the home runs and the
batting averages?
Unlock Deck
Unlock for access to all 165 flashcards in this deck.
Unlock Deck
k this deck
43
Provide an appropriate response.
Women were allowed to enter the Boston Marathon for the first time in 1972. Listed below are the winning
womenʹs times (in minutes)for the first 10 years. Use a time series chart to display the data.
Women were allowed to enter the Boston Marathon for the first time in 1972. Listed below are the winning
womenʹs times (in minutes)for the first 10 years. Use a time series chart to display the data.
Unlock Deck
Unlock for access to all 165 flashcards in this deck.
Unlock Deck
k this deck
44
Provide an appropriate response.
The graph below shows the number of car accidents occurring in one city in each of the years 1 through 6. The
number of accidents dropped in year 3 after a new speed limit was imposed. Does the graph distort the data?
How would you redesign the graph to be less misleading?
The graph below shows the number of car accidents occurring in one city in each of the years 1 through 6. The
number of accidents dropped in year 3 after a new speed limit was imposed. Does the graph distort the data?
How would you redesign the graph to be less misleading?
Unlock Deck
Unlock for access to all 165 flashcards in this deck.
Unlock Deck
k this deck
45
Provide an appropriate response.
A study was conducted to determine how certain families pay on their credit card balances. Two hundred
families with a household annual income between $25,000 and $49,999 were randomly selected and the results
are listed below. Construct a pie chart of the data.
A study was conducted to determine how certain families pay on their credit card balances. Two hundred
families with a household annual income between $25,000 and $49,999 were randomly selected and the results
are listed below. Construct a pie chart of the data.
Unlock Deck
Unlock for access to all 165 flashcards in this deck.
Unlock Deck
k this deck
46
Provide an appropriate response.
The number of beds in a sample of 24 hospitals are listed below. Construct a stem -and-leaf plot for the data.
The number of beds in a sample of 24 hospitals are listed below. Construct a stem -and-leaf plot for the data.
Unlock Deck
Unlock for access to all 165 flashcards in this deck.
Unlock Deck
k this deck
47
Provide an appropriate response.
The lengths, in kilometers, of the worldʹs largest subway systems are listed below. Construct a Pareto chart for
the data.
The lengths, in kilometers, of the worldʹs largest subway systems are listed below. Construct a Pareto chart for
the data.
Unlock Deck
Unlock for access to all 165 flashcards in this deck.
Unlock Deck
k this deck
48
Provide an appropriate response.
The data below represent the alcohol-related driving fatalities, in thousands, in the United States over a
20-year period. Use a time series chart to display the data. Describe any trends shown.
The data below represent the alcohol-related driving fatalities, in thousands, in the United States over a
20-year period. Use a time series chart to display the data. Describe any trends shown.
Unlock Deck
Unlock for access to all 165 flashcards in this deck.
Unlock Deck
k this deck
49
Provide an appropriate response.
The heights (in inches)of 30 adult males are listed below. Construct a Pareto chart for the data.
The heights (in inches)of 30 adult males are listed below. Construct a Pareto chart for the data.
Unlock Deck
Unlock for access to all 165 flashcards in this deck.
Unlock Deck
k this deck
50
Provide an appropriate response.
The data below represent the numbers of absences and the final grades of 15 randomly selected students from a
statistics class. Use a scatter plot to display the data. Is there a relationship between the studentsʹ absences and
their final grades?
The data below represent the numbers of absences and the final grades of 15 randomly selected students from a
statistics class. Use a scatter plot to display the data. Is there a relationship between the studentsʹ absences and
their final grades?
Unlock Deck
Unlock for access to all 165 flashcards in this deck.
Unlock Deck
k this deck
51
For the given data , construct a frequency distribution and frequency histogram of the data using five classes. Describe
the shape of the histogram as symmetric, uniform, skewed left, or skewed right.
-Data set: California Pick Three Lottery
A)uniform
B)symmetric
C)skewed left
D)skewed right
the shape of the histogram as symmetric, uniform, skewed left, or skewed right.
-Data set: California Pick Three Lottery
A)uniform
B)symmetric
C)skewed left
D)skewed right
Unlock Deck
Unlock for access to all 165 flashcards in this deck.
Unlock Deck
k this deck
52
Provide an appropriate response.
A safety engineer wishes to use the following data to show the number of deaths from the collision of
passenger cars with trucks on a particular highway. Use a time series chart to display the data. Describe any
trends shown.
A safety engineer wishes to use the following data to show the number of deaths from the collision of
passenger cars with trucks on a particular highway. Use a time series chart to display the data. Describe any
trends shown.
Unlock Deck
Unlock for access to all 165 flashcards in this deck.
Unlock Deck
k this deck
53
Provide an appropriate response.
The five longest winning streaks for NCAA Menʹs Division I Basketball are listed below. Construct a Pareto
chart for the data.
The five longest winning streaks for NCAA Menʹs Division I Basketball are listed below. Construct a Pareto
chart for the data.
Unlock Deck
Unlock for access to all 165 flashcards in this deck.
Unlock Deck
k this deck
54
Provide an appropriate response.
-Find the mean, median, and mode of the data.
A)
B)
C)
D)
-Find the mean, median, and mode of the data.
A)
B)
C)
D)
Unlock Deck
Unlock for access to all 165 flashcards in this deck.
Unlock Deck
k this deck
55
Provide an appropriate response.
Of the 55 tornado fatalities in a recent year, the locations of the victims are listed below. Construct a pie chart
of the data.
Of the 55 tornado fatalities in a recent year, the locations of the victims are listed below. Construct a pie chart
of the data.
Unlock Deck
Unlock for access to all 165 flashcards in this deck.
Unlock Deck
k this deck
56
Provide an appropriate response.
Determine whether the approximate shape of the distribution in the histogram is symmetric, uniform, skewed left, skewed right, or none of these.
A)skewed left
B)skewed right
C)symmetric
D)uniform
Determine whether the approximate shape of the distribution in the histogram is symmetric, uniform, skewed left, skewed right, or none of these.
A)skewed left
B)skewed right
C)symmetric
D)uniform
Unlock Deck
Unlock for access to all 165 flashcards in this deck.
Unlock Deck
k this deck
57
Provide an appropriate response.
Determine whether the approximate shape of the distribution in the histogram is symmetric, uniform, skewed left, skewed right, or none of these.
A)skewed right
B)skewed left
C)symmetric
D)uniform
Determine whether the approximate shape of the distribution in the histogram is symmetric, uniform, skewed left, skewed right, or none of these.
A)skewed right
B)skewed left
C)symmetric
D)uniform
Unlock Deck
Unlock for access to all 165 flashcards in this deck.
Unlock Deck
k this deck
58
Provide an appropriate response.
The data below represent the infant mortality rates and the life expectancies for seven selected countries in
Africa. Use a scatter plot to display the data.
The data below represent the infant mortality rates and the life expectancies for seven selected countries in
Africa. Use a scatter plot to display the data.
Unlock Deck
Unlock for access to all 165 flashcards in this deck.
Unlock Deck
k this deck
59
Provide an appropriate response.
The number of minutes that a dentist kept 20 patients waiting beyond their appointment times are listed below.
Construct a stem-and-leaf plot for the data.
The number of minutes that a dentist kept 20 patients waiting beyond their appointment times are listed below.
Construct a stem-and-leaf plot for the data.
Unlock Deck
Unlock for access to all 165 flashcards in this deck.
Unlock Deck
k this deck
60
Provide an appropriate response.
Use a scatter plot to display the data below. All measurements are in milligrams per cigarette.
Use a scatter plot to display the data below. All measurements are in milligrams per cigarette.
Unlock Deck
Unlock for access to all 165 flashcards in this deck.
Unlock Deck
k this deck
61
Provide an appropriate response.
-The scores of the top ten finishers in a recent golf tournament are listed below. Find the mode score.
A)72
B)67
C)76
D)73
-The scores of the top ten finishers in a recent golf tournament are listed below. Find the mode score.
A)72
B)67
C)76
D)73
Unlock Deck
Unlock for access to all 165 flashcards in this deck.
Unlock Deck
k this deck
62
Provide an appropriate response.
The amounts of money won by the top ten finishers in a recent Daytona 500 are listed below. Find the mean
and median winnings. Round to the nearest dollar. Which measure- the mean or the median- best represents
the data? Explain your reasoning.
The amounts of money won by the top ten finishers in a recent Daytona 500 are listed below. Find the mean
and median winnings. Round to the nearest dollar. Which measure- the mean or the median- best represents
the data? Explain your reasoning.
Unlock Deck
Unlock for access to all 165 flashcards in this deck.
Unlock Deck
k this deck
63
Provide an appropriate response.
Use the histogram below to approximate the mode heart rate of adults in the gym.
A)70
B)42
C)55
D)2
Use the histogram below to approximate the mode heart rate of adults in the gym.
A)70
B)42
C)55
D)2
Unlock Deck
Unlock for access to all 165 flashcards in this deck.
Unlock Deck
k this deck
64
Provide an appropriate response.
-The top 14 speeds, in miles per hour, for Pro-Stock drag racing over the past two decades are listed below. Find the mean speed.
A)195.8
B)196.1
C)201.2
D)210.9
-The top 14 speeds, in miles per hour, for Pro-Stock drag racing over the past two decades are listed below. Find the mean speed.
A)195.8
B)196.1
C)201.2
D)210.9
Unlock Deck
Unlock for access to all 165 flashcards in this deck.
Unlock Deck
k this deck
65
Provide an appropriate response.
-The top 14 speeds, in miles per hour, for Pro-Stock drag racing over the past two decades are listed below. Find the mode speed.
A)bimodal: 201.2, 201.4
B)201.4
C)201.2
D)no mode
-The top 14 speeds, in miles per hour, for Pro-Stock drag racing over the past two decades are listed below. Find the mode speed.
A)bimodal: 201.2, 201.4
B)201.4
C)201.2
D)no mode
Unlock Deck
Unlock for access to all 165 flashcards in this deck.
Unlock Deck
k this deck
66
Provide an appropriate response.
A student receives test scores of 62, 83, and 91. The studentʹs final exam score is 88 and homework score is 76. Each test is worth 20% of the final grade, the final exam is 25% of the final grade, and the homework grade is
15% of the final grade. What is the studentʹs mean score in the class?
A)80.6
B)76.6
C)90.6
D)85.6
Unlock Deck
Unlock for access to all 165 flashcards in this deck.
Unlock Deck
k this deck
67
Provide an appropriate response.
-The top 14 speeds, in miles per hour, for Pro-Stock drag racing over the past two decades are listed below. Find the median speed.
A)196.1
B)196.7
C)195.8
D)201.2
-The top 14 speeds, in miles per hour, for Pro-Stock drag racing over the past two decades are listed below. Find the median speed.
A)196.1
B)196.7
C)195.8
D)201.2
Unlock Deck
Unlock for access to all 165 flashcards in this deck.
Unlock Deck
k this deck
68
Provide an appropriate response.
-The scores of the top ten finishers in a recent golf tournament are listed below. Find the median score.
A)72
B)67
C)71
D)73
-The scores of the top ten finishers in a recent golf tournament are listed below. Find the median score.
A)72
B)67
C)71
D)73
Unlock Deck
Unlock for access to all 165 flashcards in this deck.
Unlock Deck
k this deck
69
Provide an appropriate response.
The numbers of home runs that Barry Bonds hit in the first 18 years of his major league baseball career are
listed below. Find the mean and median number of home runs. Round the mean to the nearest whole number.
Which measure of central tendency- the mean or the median- best represents the data? Explain your
reasoning.
Unlock Deck
Unlock for access to all 165 flashcards in this deck.
Unlock Deck
k this deck
70
Provide an appropriate response.
Find the mean, median, and mode of the following numbers:
Find the mean, median, and mode of the following numbers:
Unlock Deck
Unlock for access to all 165 flashcards in this deck.
Unlock Deck
k this deck
71
Provide an appropriate response.
Use the histogram below to approximate the median heart rate of adults in the gym.
A)70
B)65
C)75
D)42
Use the histogram below to approximate the median heart rate of adults in the gym.
A)70
B)65
C)75
D)42
Unlock Deck
Unlock for access to all 165 flashcards in this deck.
Unlock Deck
k this deck
72
Approximate the mean of the frequency distribution.
-
A)5
B)4
C)6
D)15
-
A)5
B)4
C)6
D)15
Unlock Deck
Unlock for access to all 165 flashcards in this deck.
Unlock Deck
k this deck
73
For the given data , construct a frequency distribution and frequency histogram of the data using five classes. Describe
the shape of the histogram as symmetric, uniform, skewed left, or skewed right.
-Data set: ages of 20 cars randomly selected in a student parking lot
A)symmetric
B)uniform
C)skewed left
D)skewed right
the shape of the histogram as symmetric, uniform, skewed left, or skewed right.
-Data set: ages of 20 cars randomly selected in a student parking lot
A)symmetric
B)uniform
C)skewed left
D)skewed right
Unlock Deck
Unlock for access to all 165 flashcards in this deck.
Unlock Deck
k this deck
74
Approximate the mean of the frequency distribution.
-
A)18
B)17
C)16
D)19
E)38
-
A)18
B)17
C)16
D)19
E)38
Unlock Deck
Unlock for access to all 165 flashcards in this deck.
Unlock Deck
k this deck
75
Provide an appropriate response.
-The scores of the top ten finishers in a recent golf tournament are listed below. Find the mean score.
A)71
B)67
C)68
D)72
-The scores of the top ten finishers in a recent golf tournament are listed below. Find the mean score.
A)71
B)67
C)68
D)72
Unlock Deck
Unlock for access to all 165 flashcards in this deck.
Unlock Deck
k this deck
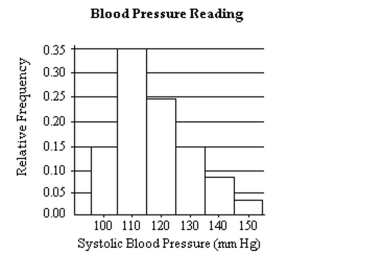
76
For the given data , construct a frequency distribution and frequency histogram of the data using five classes. Describe
the shape of the histogram as symmetric, uniform, skewed left, or skewed right.
-Data set: systolic blood pressures of 20 randomly selected patients at a blood bank
A)symmetric
B)uniform
C)skewed left
D)skewed right
the shape of the histogram as symmetric, uniform, skewed left, or skewed right.
-Data set: systolic blood pressures of 20 randomly selected patients at a blood bank
A)symmetric
B)uniform
C)skewed left
D)skewed right
Unlock Deck
Unlock for access to all 165 flashcards in this deck.
Unlock Deck
k this deck
77
Provide an appropriate response.
Use the histogram below to approximate the mean heart rate of adults in the gym.
A)70.8
B)1425.7
C)70
D)31.6
Use the histogram below to approximate the mean heart rate of adults in the gym.
A)70.8
B)1425.7
C)70
D)31.6
Unlock Deck
Unlock for access to all 165 flashcards in this deck.
Unlock Deck
k this deck
78
Provide an appropriate response.
Grade points are assigned as follows: A = 4, B = 3, C = 2, D = 1, and F = 0. Grades are weighted according to credit hours. If a student receives an A in a four-credit class, a D in a two-credit class, a B in a three-credit
Class and a C in a three-credit class, what is the studentʹs grade point average?
A)2.75
B)1.75
C)2.50
D)3.00
Unlock Deck
Unlock for access to all 165 flashcards in this deck.
Unlock Deck
k this deck
79
Provide an appropriate response.
The numbers of runs batted in that Sammy Sosa hit in the first 15 years of his major league baseball career are
listed below. Find the mean and median number of runs batted in. Round the mean to the nearest whole
number.
The numbers of runs batted in that Sammy Sosa hit in the first 15 years of his major league baseball career are
listed below. Find the mean and median number of runs batted in. Round the mean to the nearest whole
number.
Unlock Deck
Unlock for access to all 165 flashcards in this deck.
Unlock Deck
k this deck
80
For the given data , construct a frequency distribution and frequency histogram of the data using five classes. Describe
the shape of the histogram as symmetric, uniform, skewed left, or skewed right.
-Data set: California Pick Three Lottery
A)skewed left
B)symmetric
C)uniform
D)skewed right
the shape of the histogram as symmetric, uniform, skewed left, or skewed right.
-Data set: California Pick Three Lottery
A)skewed left
B)symmetric
C)uniform
D)skewed right
Unlock Deck
Unlock for access to all 165 flashcards in this deck.
Unlock Deck
k this deck
Unlock Deck
Unlock for access to all 165 flashcards in this deck.


