Deck 11: Nonparametric Tests Online and CD Only
Full screen (f)
Question
Perform the indicated sign test. Be sure to do the following: Identify the claim mathematically and state the null and
alternative hypotheses. Determine the critical value and find the test statistic. Decide whether to reject or fail to reject
the null hypothesis and interpret the decision in the context of the original claim.
A government agency claims that the median hourly wages for workers at fast food restaurants in the western
U.S. is $6.35. In a random sample of 100 workers, 68 were paid less than $6.35, 10 were paid
$6.35, and the rest more than $6.35. Test the governmentʹs claim. Use
Question
Question
Question
Question
Question
Perform the indicated sign test. Be sure to do the following: Identify the claim mathematically and state the null and
alternative hypotheses. Determine the critical value and find the test statistic. Decide whether to reject or fail to reject
the null hypothesis and interpret the decision in the context of the original claim.
Test the hypothesis that the median age of statistics teachers is 51 years. A random sample of 60 statistics
teachers found 25 above 51 years and 35 below 51 years. Use
Question
Question
Question
Question
Perform the indicated sign test. Be sure to do the following: Identify the claim mathematically and state the null and
alternative hypotheses. Determine the critical value and find the test statistic. Decide whether to reject or fail to reject
the null hypothesis and interpret the decision in the context of the original claim.
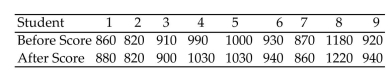
Nine students took the SAT test. Their scores are listed below. Later on, they took a test preparation course and
retook the SAT. Their new scores are listed below. Use the sign test to test the claim that the test preparation
has no effect on their scores. Use
alternative hypotheses. Determine the critical value and find the test statistic. Decide whether to reject or fail to reject
the null hypothesis and interpret the decision in the context of the original claim.
Nine students took the SAT test. Their scores are listed below. Later on, they took a test preparation course and
retook the SAT. Their new scores are listed below. Use the sign test to test the claim that the test preparation
has no effect on their scores. Use
Question
Perform the indicated sign test. Be sure to do the following: Identify the claim mathematically and state the null and
alternative hypotheses. Determine the critical value and find the test statistic. Decide whether to reject or fail to reject
the null hypothesis and interpret the decision in the context of the original claim.
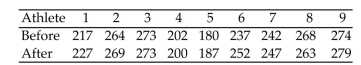
A weight-lifting coach claims that weight-lifters can increase strength by taking vitamin E. To test the theory,
the coach randomly selects 9 athletes and gives them a strength test using a bench press. Thirty days later, after
regular training supplemented by vitamin E, they are tested again. The results are listed below. Use the sign
test to test the claim that the vitamin E supplement is effective in increasing the athletesʹ strength. Use
alternative hypotheses. Determine the critical value and find the test statistic. Decide whether to reject or fail to reject
the null hypothesis and interpret the decision in the context of the original claim.
A weight-lifting coach claims that weight-lifters can increase strength by taking vitamin E. To test the theory,
the coach randomly selects 9 athletes and gives them a strength test using a bench press. Thirty days later, after
regular training supplemented by vitamin E, they are tested again. The results are listed below. Use the sign
test to test the claim that the vitamin E supplement is effective in increasing the athletesʹ strength. Use
Question
Perform the indicated sign test. Be sure to do the following: Identify the claim mathematically and state the null and
alternative hypotheses. Determine the critical value and find the test statistic. Decide whether to reject or fail to reject
the null hypothesis and interpret the decision in the context of the original claim.
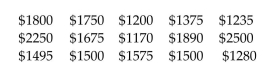
A real estate agent surmises that the median rent for a one-bedroom apartment in a beach community in
southern California is at least $1500 per month. The rents for a random sample of 15 one-bedroom apartments
are listed below. Test the agentʹs claim. Use
alternative hypotheses. Determine the critical value and find the test statistic. Decide whether to reject or fail to reject
the null hypothesis and interpret the decision in the context of the original claim.
A real estate agent surmises that the median rent for a one-bedroom apartment in a beach community in
southern California is at least $1500 per month. The rents for a random sample of 15 one-bedroom apartments
are listed below. Test the agentʹs claim. Use
Question
Perform the indicated sign test. Be sure to do the following: Identify the claim mathematically and state the null and
alternative hypotheses. Determine the critical value and find the test statistic. Decide whether to reject or fail to reject
the null hypothesis and interpret the decision in the context of the original claim.
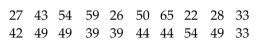
A convenience store owner believes that the median number of lottery tickets sold per day is 44. A random
sample of 20 days yields the data below. Test the ownerʹs claim. Use
alternative hypotheses. Determine the critical value and find the test statistic. Decide whether to reject or fail to reject
the null hypothesis and interpret the decision in the context of the original claim.
A convenience store owner believes that the median number of lottery tickets sold per day is 44. A random
sample of 20 days yields the data below. Test the ownerʹs claim. Use
Question
Perform the indicated sign test. Be sure to do the following: Identify the claim mathematically and state the null and
alternative hypotheses. Determine the critical value and find the test statistic. Decide whether to reject or fail to reject
the null hypothesis and interpret the decision in the context of the original claim.
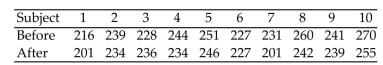
A pharmaceutical company wishes to test a new drug with the expectation of lowering cholesterol levels. Ten
subjects are randomly selected and their cholesterol levels are recorded. The results are listed below. The
subjects were placed on the drug for a period of 6 months, after which their cholesterol levels were tested
again. The results are listed below. (All units are milligrams per deciliter.)Use the sign test to test the
companyʹs claim that the drug lowers cholesterol levels. Use = 0.01.
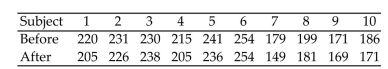
alternative hypotheses. Determine the critical value and find the test statistic. Decide whether to reject or fail to reject
the null hypothesis and interpret the decision in the context of the original claim.
A pharmaceutical company wishes to test a new drug with the expectation of lowering cholesterol levels. Ten
subjects are randomly selected and their cholesterol levels are recorded. The results are listed below. The
subjects were placed on the drug for a period of 6 months, after which their cholesterol levels were tested
again. The results are listed below. (All units are milligrams per deciliter.)Use the sign test to test the
companyʹs claim that the drug lowers cholesterol levels. Use
= 0.01. Question
Perform the indicated sign test. Be sure to do the following: Identify the claim mathematically and state the null and
alternative hypotheses. Determine the critical value and find the test statistic. Decide whether to reject or fail to reject
the null hypothesis and interpret the decision in the context of the original claim.
A car dealer claims that its new model car still gets at least 21 miles per gallon of gas. Ten cars are tested. The
results are given below. Test the dealerʹs claim. Use
Question
Perform the indicated sign test. Be sure to do the following: Identify the claim mathematically and state the null and
alternative hypotheses. Determine the critical value and find the test statistic. Decide whether to reject or fail to reject
the null hypothesis and interpret the decision in the context of the original claim.
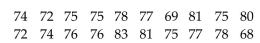
A club professional at a major golf course claims that the course is so tough that the median score is greater
than 75. The scores from a random sample of 20 professional golfers are listed below. Test the club
professionalʹs claim. Use
alternative hypotheses. Determine the critical value and find the test statistic. Decide whether to reject or fail to reject
the null hypothesis and interpret the decision in the context of the original claim.
A club professional at a major golf course claims that the course is so tough that the median score is greater
than 75. The scores from a random sample of 20 professional golfers are listed below. Test the club
professionalʹs claim. Use
Question
Question
Question
Perform the indicated sign test. Be sure to do the following: Identify the claim mathematically and state the null and
alternative hypotheses. Determine the critical value and find the test statistic. Decide whether to reject or fail to reject
the null hypothesis and interpret the decision in the context of the original claim.
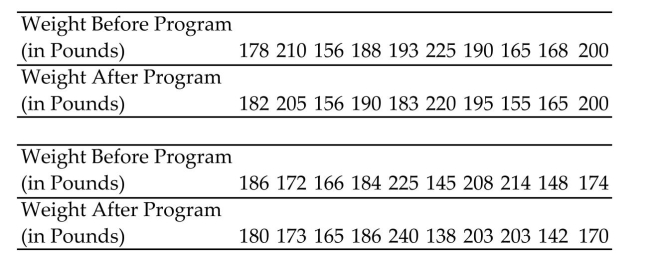
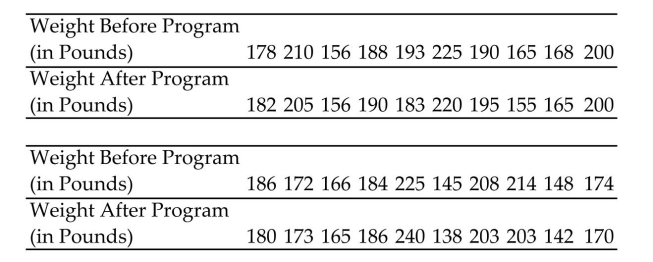
In a study of the effectiveness of physical exercise in weight loss, 20 people were randomly selected to
participate in a program for 30 days. Use the sign test to test the claim that exercise has no effect on weight loss.
Use
alternative hypotheses. Determine the critical value and find the test statistic. Decide whether to reject or fail to reject
the null hypothesis and interpret the decision in the context of the original claim.
In a study of the effectiveness of physical exercise in weight loss, 20 people were randomly selected to
participate in a program for 30 days. Use the sign test to test the claim that exercise has no effect on weight loss.
Use
Question
Question
Perform the indicated sign test. Be sure to do the following: Identify the claim mathematically and state the null and
alternative hypotheses. Determine the critical value and find the test statistic. Decide whether to reject or fail to reject
the null hypothesis and interpret the decision in the context of the original claim.
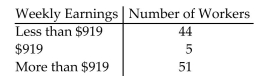
A company claims that the median monthly earnings of its farm workers is greater than $919. To test the claim,
100 workers are randomly selected and asked to provide their monthly earnings. The data is shown below. Test
the companyʹs claim. Use
alternative hypotheses. Determine the critical value and find the test statistic. Decide whether to reject or fail to reject
the null hypothesis and interpret the decision in the context of the original claim.
A company claims that the median monthly earnings of its farm workers is greater than $919. To test the claim,
100 workers are randomly selected and asked to provide their monthly earnings. The data is shown below. Test
the companyʹs claim. Use
Question
Perform the indicated sign test. Be sure to do the following: Identify the claim mathematically and state the null and
alternative hypotheses. Determine the critical value and find the test statistic. Decide whether to reject or fail to reject
the null hypothesis and interpret the decision in the context of the original claim.
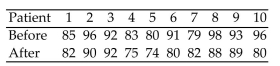
A physicianʹs group claims that a personʹs diastolic blood pressure can be lowered by listening to a relaxation
tape each evening. Ten subjects are randomly selected and their blood pressures are measured. The 10 patients
are given the tapes and told to listen to them each evening for one month. At the end of the month, their blood
pressures are measured again. The blood pressures in mm Hg are listed below. Use the sign test to test the
physicianʹs claim. Use
alternative hypotheses. Determine the critical value and find the test statistic. Decide whether to reject or fail to reject
the null hypothesis and interpret the decision in the context of the original claim.
A physicianʹs group claims that a personʹs diastolic blood pressure can be lowered by listening to a relaxation
tape each evening. Ten subjects are randomly selected and their blood pressures are measured. The 10 patients
are given the tapes and told to listen to them each evening for one month. At the end of the month, their blood
pressures are measured again. The blood pressures in mm Hg are listed below. Use the sign test to test the
physicianʹs claim. Use
Question
Question
Perform the indicated Wilcoxon test. Be sure to do the following: Identify the claim mathematically and state the null
and alternative hypotheses. Determine the critical value and find the test statistic. Decide whether to reject or fail to
reject the null hypothesis and interpret the decision in the context of the original claim.
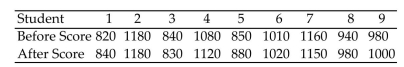
A random sample of nine students took the SAT test. and later on retook the test after taking a test preparation
course. Their scores are listed below. Use the Wilcoxon signed-rank test to test the claim that the test
preparation has no effect on their scores. Use
and alternative hypotheses. Determine the critical value and find the test statistic. Decide whether to reject or fail to
reject the null hypothesis and interpret the decision in the context of the original claim.
A random sample of nine students took the SAT test. and later on retook the test after taking a test preparation
course. Their scores are listed below. Use the Wilcoxon signed-rank test to test the claim that the test
preparation has no effect on their scores. Use
Question
Perform the indicated Wilcoxon test. Be sure to do the following: Identify the claim mathematically and state the null
and alternative hypotheses. Determine the critical value and find the test statistic. Decide whether to reject or fail to
reject the null hypothesis and interpret the decision in the context of the original claim.
In a study of the effectiveness of physical exercise on weight loss, 20 people were randomly selected to
participate in a program for 30 days. Use the Wilcoxon signed-rank test to test the claim that exercise has no
effect on weight loss. Use
Question
Question
Question
Question
Question
Perform the indicated Wilcoxon test. Be sure to do the following: Identify the claim mathematically and state the null
and alternative hypotheses. Determine the critical value and find the test statistic. Decide whether to reject or fail to
reject the null hypothesis and interpret the decision in the context of the original claim.
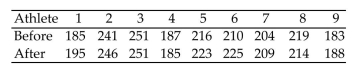
A weight-lifting coach claims that weight-lifters can increase their strength by taking vitamin E. To test the
theory, the coach randomly selects 9 athletes and gives them a strength test using a bench press. Thirty days
later, after regular training supplemented by vitamin E, they are tested again. The results are listed below. Use
the Wilcoxon signed-rank test to test the claim that the vitamin E supplement is effective in increasing athletesʹ
strength. Use
and alternative hypotheses. Determine the critical value and find the test statistic. Decide whether to reject or fail to
reject the null hypothesis and interpret the decision in the context of the original claim.
A weight-lifting coach claims that weight-lifters can increase their strength by taking vitamin E. To test the
theory, the coach randomly selects 9 athletes and gives them a strength test using a bench press. Thirty days
later, after regular training supplemented by vitamin E, they are tested again. The results are listed below. Use
the Wilcoxon signed-rank test to test the claim that the vitamin E supplement is effective in increasing athletesʹ
strength. Use
Question
Question
Perform the indicated Wilcoxon test. Be sure to do the following: Identify the claim mathematically and state the null
and alternative hypotheses. Determine the critical value and find the test statistic. Decide whether to reject or fail to
reject the null hypothesis and interpret the decision in the context of the original claim.
A local school district is concerned about the number of school days missed by its teachers due to illness. A
random sample of 10 teachers is selected. The numbers of absences in one year are recorded. An incentive
program is then offered in an attempt to reduce the absences. The numbers of absences in the year after the
incentive program are recorded. The results are listed below. Use the Wilcoxon signed-rank test to test the
claim that the incentive program is effective in reducing the number of days missed by teachers. Use = 0.05.
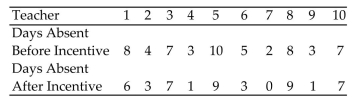
and alternative hypotheses. Determine the critical value and find the test statistic. Decide whether to reject or fail to
reject the null hypothesis and interpret the decision in the context of the original claim.
A local school district is concerned about the number of school days missed by its teachers due to illness. A
random sample of 10 teachers is selected. The numbers of absences in one year are recorded. An incentive
program is then offered in an attempt to reduce the absences. The numbers of absences in the year after the
incentive program are recorded. The results are listed below. Use the Wilcoxon signed-rank test to test the
claim that the incentive program is effective in reducing the number of days missed by teachers. Use
= 0.05. Question
Question
Perform the indicated sign test. Be sure to do the following: Identify the claim mathematically and state the null and
alternative hypotheses. Determine the critical value and find the test statistic. Decide whether to reject or fail to reject
the null hypothesis and interpret the decision in the context of the original claim.
Test the hypothesis that the median age of statistics teachers is less than 45 years. A random sample of 60
statistics teachers found 25 above 45 years, 33 below 45 years, and the rest exactly 45 years. Use
Question
Perform the indicated Wilcoxon test. Be sure to do the following: Identify the claim mathematically and state the null
and alternative hypotheses. Determine the critical value and find the test statistic. Decide whether to reject or fail to
reject the null hypothesis and interpret the decision in the context of the original claim.
A physician claims that a personʹs diastolic blood pressure can be lowered by listening to a relaxation tape each
evening. Ten subjects are randomly selected and their blood pressures are measured. The 10 patients then listen
to the tapes each evening for one month. At the end of the month, their blood pressures are measured again.
The data (in mm Hg)are listed below. Use the Wilcoxon signed-rank test to test the physicianʹs claim. Use .05.
.05. 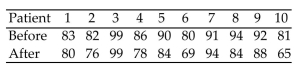
and alternative hypotheses. Determine the critical value and find the test statistic. Decide whether to reject or fail to
reject the null hypothesis and interpret the decision in the context of the original claim.
A physician claims that a personʹs diastolic blood pressure can be lowered by listening to a relaxation tape each
evening. Ten subjects are randomly selected and their blood pressures are measured. The 10 patients then listen
to the tapes each evening for one month. At the end of the month, their blood pressures are measured again.
The data (in mm Hg)are listed below. Use the Wilcoxon signed-rank test to test the physicianʹs claim. Use
.05. Question
Perform the indicated sign test. Be sure to do the following: Identify the claim mathematically and state the null and
alternative hypotheses. Determine the critical value and find the test statistic. Decide whether to reject or fail to reject
the null hypothesis and interpret the decision in the context of the original claim.
A local school district is concerned about the number of school days missed by its teachers due to illness. A
random sample of 10 teachers is selected. The numbers of absences in one year are listed below. An incentive
program is offered in an attempt to decrease the number of days absent. The numbers of absences in the year
after the incentive program are also listed. Use the sign test to test the claim that the incentive program reduces
the number of days missed by teachers. Use = 0.05.
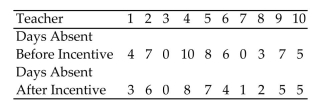
alternative hypotheses. Determine the critical value and find the test statistic. Decide whether to reject or fail to reject
the null hypothesis and interpret the decision in the context of the original claim.
A local school district is concerned about the number of school days missed by its teachers due to illness. A
random sample of 10 teachers is selected. The numbers of absences in one year are listed below. An incentive
program is offered in an attempt to decrease the number of days absent. The numbers of absences in the year
after the incentive program are also listed. Use the sign test to test the claim that the incentive program reduces
the number of days missed by teachers. Use
= 0.05. Question
Perform the indicated Wilcoxon test. Be sure to do the following: Identify the claim mathematically and state the null
and alternative hypotheses. Determine the critical value and find the test statistic. Decide whether to reject or fail to
reject the null hypothesis and interpret the decision in the context of the original claim.
Verbal SAT scores for students randomly selected from two different schools are listed below. Use the
Wilcoxon rank sum test to test the claim that there is no difference in the scores from the two schools.
Use = 0.05.
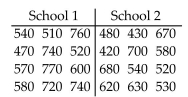
and alternative hypotheses. Determine the critical value and find the test statistic. Decide whether to reject or fail to
reject the null hypothesis and interpret the decision in the context of the original claim.
Verbal SAT scores for students randomly selected from two different schools are listed below. Use the
Wilcoxon rank sum test to test the claim that there is no difference in the scores from the two schools.
Use
= 0.05. Question
Perform the indicated sign test. Be sure to do the following: Identify the claim mathematically and state the null and
alternative hypotheses. Determine the critical value and find the test statistic. Decide whether to reject or fail to reject
the null hypothesis and interpret the decision in the context of the original claim.
One hundred people go on a special diet with the intention of losing weight. At the end of 6 weeks, 59 lost
weight, 27 gained weight and the rest remained the same. Test the hypothesis that the diet is effective in
reducing weight. Use = 0.05. (Note: The diet will be effective if at least 50% lose weight.)
alternative hypotheses. Determine the critical value and find the test statistic. Decide whether to reject or fail to reject
the null hypothesis and interpret the decision in the context of the original claim.
One hundred people go on a special diet with the intention of losing weight. At the end of 6 weeks, 59 lost
weight, 27 gained weight and the rest remained the same. Test the hypothesis that the diet is effective in
reducing weight. Use
= 0.05. (Note: The diet will be effective if at least 50% lose weight.) Question
Perform the indicated sign test. Be sure to do the following: Identify the claim mathematically and state the null and
alternative hypotheses. Determine the critical value and find the test statistic. Decide whether to reject or fail to reject
the null hypothesis and interpret the decision in the context of the original claim.
A college researcher claims that the median time worked by full time students is at least 10 hours per week. In
a random sample of 100 students, 59 worked more than 10 hours, 10 worked exactly 10 hours and the rest
worked less than 10 hours. Test the researcherʹs claim. Use
Question
Perform the indicated Wilcoxon test. Be sure to do the following: Identify the claim mathematically and state the null
and alternative hypotheses. Determine the critical value and find the test statistic. Decide whether to reject or fail to
reject the null hypothesis and interpret the decision in the context of the original claim.
A pharmaceutical company wishes to test a new drug with the expectation of lowering cholesterol levels. Ten
subjects are randomly selected and their cholesterol levels are recorded. The subjects were then placed on the
drug for a period of 6 months, after which their cholesterol levels were tested again. The results (in mg per
deciliter)are listed below. Use the Wilcoxon signed-rank test to test the companyʹs claim that the drug lowers
cholesterol levels. Use
Question
Perform the indicated Wilcoxon test. Be sure to do the following: Identify the claim mathematically and state the null
and alternative hypotheses. Determine the critical value and find the test statistic. Decide whether to reject or fail to
reject the null hypothesis and interpret the decision in the context of the original claim.
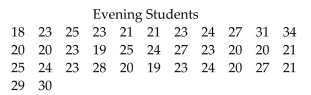
A statistics teacher wanted to see whether there was a significant difference in age between day students and
night students. A random sample of 35 students from each group was selected. The data are given below. Use
the Wilcoxon rank sum test to test the claim that there is no difference in age between the two groups. Use .05.
.05. 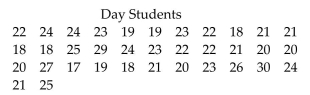
and alternative hypotheses. Determine the critical value and find the test statistic. Decide whether to reject or fail to
reject the null hypothesis and interpret the decision in the context of the original claim.
A statistics teacher wanted to see whether there was a significant difference in age between day students and
night students. A random sample of 35 students from each group was selected. The data are given below. Use
the Wilcoxon rank sum test to test the claim that there is no difference in age between the two groups. Use
.05. Question
Question
Use the Spearman rank correlation coefficient to determine whether the correlation between the given variables is
significant. Be sure to do the following: Identify the claim mathematically and state the null and alternative hypotheses.
Determine the critical value and find the test statistic. Decide whether to reject or fail to reject the null hypothesis and
interpret the decision in the context of the original claim.
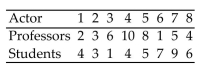
The drama department at a college asked professors and students in the drama department to rank 8 actors
according to their performance. The data are listed below. A 10 is the highest ranking and a 1 the lowest
ranking. Test the claim that there is no correlation between professorsʹ and studentsʹ rankings. Use
significant. Be sure to do the following: Identify the claim mathematically and state the null and alternative hypotheses.
Determine the critical value and find the test statistic. Decide whether to reject or fail to reject the null hypothesis and
interpret the decision in the context of the original claim.
The drama department at a college asked professors and students in the drama department to rank 8 actors
according to their performance. The data are listed below. A 10 is the highest ranking and a 1 the lowest
ranking. Test the claim that there is no correlation between professorsʹ and studentsʹ rankings. Use
Question
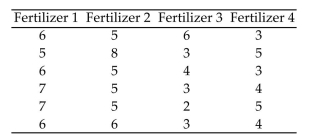
Perform the indicated Kruskall-Wallis test. Be sure to do the following: Identify the claim mathematically and state the
null and alternative hypotheses. Determine the critical value and find the test statistic. Decide whether to reject or fail
to reject the null hypothesis and interpret the decision in the context of the original claim.
Four different types of fertilizers are used on raspberry plants. The number of raspberries on each randomly
selected plant is given below. Use the Kruskal-Wallis test to test the claim that there is no difference in the
distributions of the number of raspberries for the four different types of fertilizer. Use α = 0.05.
8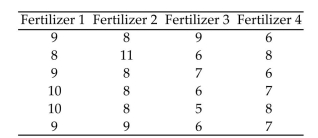 6
6
6
7
null and alternative hypotheses. Determine the critical value and find the test statistic. Decide whether to reject or fail
to reject the null hypothesis and interpret the decision in the context of the original claim.
Four different types of fertilizers are used on raspberry plants. The number of raspberries on each randomly
selected plant is given below. Use the Kruskal-Wallis test to test the claim that there is no difference in the
distributions of the number of raspberries for the four different types of fertilizer. Use
α = 0.05.8
66
7
Question
Question
Perform the indicated Kruskall-Wallis test. Be sure to do the following: Identify the claim mathematically and state the
null and alternative hypotheses. Determine the critical value and find the test statistic. Decide whether to reject or fail
to reject the null hypothesis and interpret the decision in the context of the original claim.
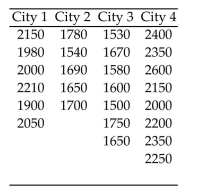
A realtor wishes to compare the square footage of houses of similar prices in 4 different cities. The data are
listed below. Use the Kruskal-Wallis test to test the claim that there is a difference in the distributions of the
square footages in the 4 different cities. Use
null and alternative hypotheses. Determine the critical value and find the test statistic. Decide whether to reject or fail
to reject the null hypothesis and interpret the decision in the context of the original claim.
A realtor wishes to compare the square footage of houses of similar prices in 4 different cities. The data are
listed below. Use the Kruskal-Wallis test to test the claim that there is a difference in the distributions of the
square footages in the 4 different cities. Use
Question
A researcher claims that the lifetimes (in hours)of fluorescent light bulbs are the same regardless of
manufacturer. Random samples are selected from 3 different manufacturers. The data are listed below. Test the
claim that the samples come from identical populations by using (a)a one-way ANOVA test and
(b)a Kruskal-Wallis test. Compare the results. Use = 0.05.
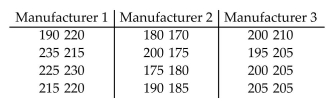
manufacturer. Random samples are selected from 3 different manufacturers. The data are listed below. Test the
claim that the samples come from identical populations by using (a)a one-way ANOVA test and
(b)a Kruskal-Wallis test. Compare the results. Use
= 0.05. Question
Perform the indicated Kruskall-Wallis test. Be sure to do the following: Identify the claim mathematically and state the
null and alternative hypotheses. Determine the critical value and find the test statistic. Decide whether to reject or fail
to reject the null hypothesis and interpret the decision in the context of the original claim.
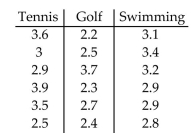
The grade point averages of students participating in different sports at a college are to be compared. The data
are listed below. Use the Kruskal-Wallis test to test the claim that there is a difference in the distribution of the
GPAs of the three different sports groups. Use
null and alternative hypotheses. Determine the critical value and find the test statistic. Decide whether to reject or fail
to reject the null hypothesis and interpret the decision in the context of the original claim.
The grade point averages of students participating in different sports at a college are to be compared. The data
are listed below. Use the Kruskal-Wallis test to test the claim that there is a difference in the distribution of the
GPAs of the three different sports groups. Use
Question
Perform the indicated Kruskall-Wallis test. Be sure to do the following: Identify the claim mathematically and state the
null and alternative hypotheses. Determine the critical value and find the test statistic. Decide whether to reject or fail
to reject the null hypothesis and interpret the decision in the context of the original claim.
A medical researcher wishes to try three different techniques to lower blood pressure of patients with high
blood pressure. The subjects are randomly selected and randomly assigned to one of three groups. Group 1 is
given medication, Group 2 is given an exercise program, and Group 3 is assigned a special diet. At the end of
six weeks, the reduction in each subjectʹs blood pressure is recorded. Use the Kruskal-Wallis test to test the
claim that there is no difference in the distributions of the blood pressures of the three populations. Use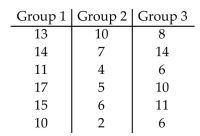
Question
Perform the indicated Wilcoxon test. Be sure to do the following: Identify the claim mathematically and state the null
and alternative hypotheses. Determine the critical value and find the test statistic. Decide whether to reject or fail to
reject the null hypothesis and interpret the decision in the context of the original claim.
A researcher wants to know if the length of sentences received for a particular type of crime was the same for
men and women. The length of sentence received was recorded for a random sample of men and women . The
data, in years, are listed below. Use the Wilcoxon rank sum test to test the claim that there is no difference
between the sentences received by men and the sentences received by women. Use = 0.05.
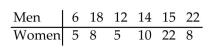

and alternative hypotheses. Determine the critical value and find the test statistic. Decide whether to reject or fail to
reject the null hypothesis and interpret the decision in the context of the original claim.
A researcher wants to know if the length of sentences received for a particular type of crime was the same for
men and women. The length of sentence received was recorded for a random sample of men and women . The
data, in years, are listed below. Use the Wilcoxon rank sum test to test the claim that there is no difference
between the sentences received by men and the sentences received by women. Use
= 0.05. Question
Question
Question
Perform the indicated Kruskall-Wallis test. Be sure to do the following: Identify the claim mathematically and state the
null and alternative hypotheses. Determine the critical value and find the test statistic. Decide whether to reject or fail
to reject the null hypothesis and interpret the decision in the context of the original claim.
A researcher wishes to test the claim that there is a difference in the distribution of ages of elementary school,
high school, and community college teachers. Teachers are randomly selected from each group. Their ages are
recorded below. Can you conclude that the distributions of teachersʹ ages at these different levels of education
are different? Use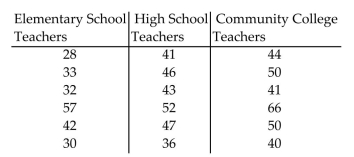
Question
Perform the indicated Kruskall-Wallis test. Be sure to do the following: Identify the claim mathematically and state the
null and alternative hypotheses. Determine the critical value and find the test statistic. Decide whether to reject or fail
to reject the null hypothesis and interpret the decision in the context of the original claim.
A researcher wishes to compare times it takes workers to assemble a certain computer component using
different machines. Workers are randomly selected and randomly assigned to one of three different machines.
The time (in minutes)it takes each worker to assemble the component is recorded. Use the Kruskal-Wallis test
to test the claim that there is a difference in the distributions of the assembly times for the three machines. Use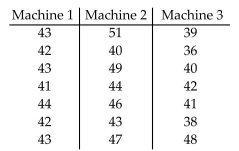
Question
Four different types of fertilizers are used on raspberry plants. The number of raspberries on each randomly
selected plant is given below. Test the claim using (a)a Kurskal-Wallis test and (b)a one-way ANOVA test
that the type of fertilizer makes no difference in the mean number of raspberries per plant. Compare the results.
Use
selected plant is given below. Test the claim using (a)a Kurskal-Wallis test and (b)a one-way ANOVA test
that the type of fertilizer makes no difference in the mean number of raspberries per plant. Compare the results.
Use
Question
Use the Spearman rank correlation coefficient to determine whether the correlation between the given variables is
significant. Be sure to do the following: Identify the claim mathematically and state the null and alternative hypotheses.
Determine the critical value and find the test statistic. Decide whether to reject or fail to reject the null hypothesis and
interpret the decision in the context of the original claim.
The table below lists the verbal and math SAT scores of 10 students selected at random. Test the claim that
there is no correlation between verbal and math SAT scores. Use = 0.05.
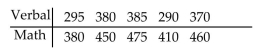

significant. Be sure to do the following: Identify the claim mathematically and state the null and alternative hypotheses.
Determine the critical value and find the test statistic. Decide whether to reject or fail to reject the null hypothesis and
interpret the decision in the context of the original claim.
The table below lists the verbal and math SAT scores of 10 students selected at random. Test the claim that
there is no correlation between verbal and math SAT scores. Use
= 0.05. Question
Question
Question
Question
Question
Use the Spearman rank correlation coefficient to determine whether the correlation between the given variables is
significant. Be sure to do the following: Identify the claim mathematically and state the null and alternative hypotheses.
Determine the critical value and find the test statistic. Decide whether to reject or fail to reject the null hypothesis and
interpret the decision in the context of the original claim.
The ages and systolic blood pressures of 9 randomly selected adults are given below. Can you conclude that
there is a correlation between age and blood pressure? Use = 0.05.
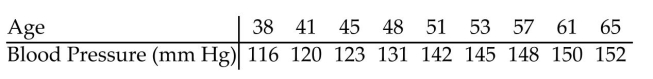
significant. Be sure to do the following: Identify the claim mathematically and state the null and alternative hypotheses.
Determine the critical value and find the test statistic. Decide whether to reject or fail to reject the null hypothesis and
interpret the decision in the context of the original claim.
The ages and systolic blood pressures of 9 randomly selected adults are given below. Can you conclude that
there is a correlation between age and blood pressure? Use
= 0.05. Question
Perform a runs test for randomness. Be sure to do the following: Identify the claim mathematically and state the null
and alternative hypotheses. Determine the critical value and find the test statistic. Decide whether to reject or fail to
reject the null hypothesis and interpret the decision in the context of the original claim.
A telemarketer solicited households to change their long-distance carrier. The results for one afternoon are
shown, where C represents the households that changed their carrier and S represents the households that kept
their existing carrier. Can you conclude that the sequence of results is random? Use = 0.05.
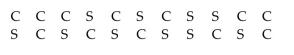
and alternative hypotheses. Determine the critical value and find the test statistic. Decide whether to reject or fail to
reject the null hypothesis and interpret the decision in the context of the original claim.
A telemarketer solicited households to change their long-distance carrier. The results for one afternoon are
shown, where C represents the households that changed their carrier and S represents the households that kept
their existing carrier. Can you conclude that the sequence of results is random? Use
= 0.05. Question
Perform a runs test for randomness. Be sure to do the following: Identify the claim mathematically and state the null
and alternative hypotheses. Determine the critical value and find the test statistic. Decide whether to reject or fail to
reject the null hypothesis and interpret the decision in the context of the original claim.
An airport security officer searched carry-on bags of people boarding a plane in the sequence shown, where S
represents a searched bag and N represents a bag not searched. Can you conclude that the officer conducted a
random search? Use = 0.05.
and alternative hypotheses. Determine the critical value and find the test statistic. Decide whether to reject or fail to
reject the null hypothesis and interpret the decision in the context of the original claim.
An airport security officer searched carry-on bags of people boarding a plane in the sequence shown, where S
represents a searched bag and N represents a bag not searched. Can you conclude that the officer conducted a
random search? Use
= 0.05. Question
A telemarketer solicited households to change their long-distance carrier. The results for one afternoon are
shown, where C represents the households that changed their carrier and S represents the households that kept
their same carrier. Find the test statistic G to test for randomness.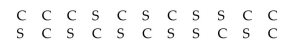 SC
SC
shown, where C represents the households that changed their carrier and S represents the households that kept
their same carrier. Find the test statistic G to test for randomness.
SC Question
Use the Spearman rank correlation coefficient to determine whether the correlation between the given variables is
significant. Be sure to do the following: Identify the claim mathematically and state the null and alternative hypotheses.
Determine the critical value and find the test statistic. Decide whether to reject or fail to reject the null hypothesis and
interpret the decision in the context of the original claim.
A manager wishes to determine whether there is a relationship between the distance traveled per month by the
sales representatives and the amount of sales generated per month. Can you conclude that there is a correlation
between distance traveled and sales generated? Use = 0.05.
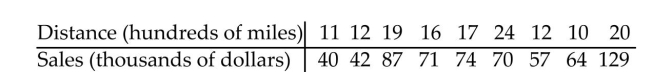
significant. Be sure to do the following: Identify the claim mathematically and state the null and alternative hypotheses.
Determine the critical value and find the test statistic. Decide whether to reject or fail to reject the null hypothesis and
interpret the decision in the context of the original claim.
A manager wishes to determine whether there is a relationship between the distance traveled per month by the
sales representatives and the amount of sales generated per month. Can you conclude that there is a correlation
between distance traveled and sales generated? Use
= 0.05. Question
An airport security officer manually searched carry-on bags of people boarding a plane in the sequence shown,
where S represents a searched bag and N represents a bag not searched. Find the test statistic z to test for
randomness.
where S represents a searched bag and N represents a bag not searched. Find the test statistic z to test for
randomness.
Question
A pitching machine throws baseballs that are either strikes (S)or balls (B). A coach records whether each ball
thrown during batting practice is a strike or a ball. Find the standardized test statistic z to test for randomness.
thrown during batting practice is a strike or a ball. Find the standardized test statistic z to test for randomness.
Question
Use the Spearman rank correlation coefficient to determine whether the correlation between the given variables is
significant. Be sure to do the following: Identify the claim mathematically and state the null and alternative hypotheses.
Determine the critical value and find the test statistic. Decide whether to reject or fail to reject the null hypothesis and
interpret the decision in the context of the original claim.
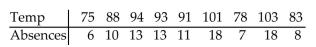
The temperatures on randomly chosen days during a summer class and the number of absences from class on
those days are listed below. Can you conclude that there is a correlation between temperature and the number
absent? Use
significant. Be sure to do the following: Identify the claim mathematically and state the null and alternative hypotheses.
Determine the critical value and find the test statistic. Decide whether to reject or fail to reject the null hypothesis and
interpret the decision in the context of the original claim.
The temperatures on randomly chosen days during a summer class and the number of absences from class on
those days are listed below. Can you conclude that there is a correlation between temperature and the number
absent? Use
Question
Use the sequence to find the values of 

Question
Use the sequence to find the values of 

Question
Question
Perform a runs test for randomness. Be sure to do the following: Identify the claim mathematically and state the null
and alternative hypotheses. Determine the critical value and find the test statistic. Decide whether to reject or fail to
reject the null hypothesis and interpret the decision in the context of the original claim.
Two poker players are dealt cards in the sequence shown, where B represents a black card and R represents a
red card. Can you conclude that the dealing of cards was not random? Use = 0.05.
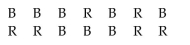
and alternative hypotheses. Determine the critical value and find the test statistic. Decide whether to reject or fail to
reject the null hypothesis and interpret the decision in the context of the original claim.
Two poker players are dealt cards in the sequence shown, where B represents a black card and R represents a
red card. Can you conclude that the dealing of cards was not random? Use
= 0.05. Question
The sequence shows a companyʹs daily sales, in thousands of dollars, for the business days during the month of
September. Find the standardized test statistic, G, to test for randomness.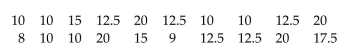
September. Find the standardized test statistic, G, to test for randomness.
Question
Use the Spearman rank correlation coefficient to determine whether the correlation between the given variables is
significant. Be sure to do the following: Identify the claim mathematically and state the null and alternative hypotheses.
Determine the critical value and find the test statistic. Decide whether to reject or fail to reject the null hypothesis and
interpret the decision in the context of the original claim.
The number of absences and the final grades of 9 randomly selected students from a statistics class are given
below. Can you conclude that there is a correlation between final grade and number of absences? Use = 0.01.
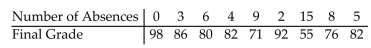
significant. Be sure to do the following: Identify the claim mathematically and state the null and alternative hypotheses.
Determine the critical value and find the test statistic. Decide whether to reject or fail to reject the null hypothesis and
interpret the decision in the context of the original claim.
The number of absences and the final grades of 9 randomly selected students from a statistics class are given
below. Can you conclude that there is a correlation between final grade and number of absences? Use
= 0.01. Question
Two poker players are dealt cards in the sequence shown, where B represents a black card and R represents a
red card. Find the test statistic G to test for randomness.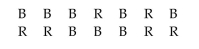
red card. Find the test statistic G to test for randomness.
Question
Use the Spearman rank correlation coefficient to determine whether the correlation between the given variables is
significant. Be sure to do the following: Identify the claim mathematically and state the null and alternative hypotheses.
Determine the critical value and find the test statistic. Decide whether to reject or fail to reject the null hypothesis and
interpret the decision in the context of the original claim.
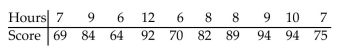
The final exam scores of 10 randomly selected statistics students and the number of hours they studied for the
exam are given below. Can you conclude that there is a correlation between scores on the test and time spent
studying? Use
significant. Be sure to do the following: Identify the claim mathematically and state the null and alternative hypotheses.
Determine the critical value and find the test statistic. Decide whether to reject or fail to reject the null hypothesis and
interpret the decision in the context of the original claim.
The final exam scores of 10 randomly selected statistics students and the number of hours they studied for the
exam are given below. Can you conclude that there is a correlation between scores on the test and time spent
studying? Use
Question
Perform a runs test for randomness. Be sure to do the following: Identify the claim mathematically and state the null
and alternative hypotheses. Determine the critical value and find the test statistic. Decide whether to reject or fail to
reject the null hypothesis and interpret the decision in the context of the original claim.
A pitching machine throws baseballs that are either strikes (S)or balls (B). A coach records whether each ball
thrown during batting practice is a strike or a ball. Can you conclude that the sequence of pitches is random?
Use = 0.05.
  B
B
and alternative hypotheses. Determine the critical value and find the test statistic. Decide whether to reject or fail to
reject the null hypothesis and interpret the decision in the context of the original claim.
A pitching machine throws baseballs that are either strikes (S)or balls (B). A coach records whether each ball
thrown during batting practice is a strike or a ball. Can you conclude that the sequence of pitches is random?
Use
= 0.05. B Question
Use the Spearman rank correlation coefficient to determine whether the correlation between the given variables is
significant. Be sure to do the following: Identify the claim mathematically and state the null and alternative hypotheses.
Determine the critical value and find the test statistic. Decide whether to reject or fail to reject the null hypothesis and
interpret the decision in the context of the original claim.
In an area of the Midwest, records were kept on the rainfall and the yield of wheat. Can you conclude that
there is a correlation between rainfall and yield of wheat? Use = 0.01.
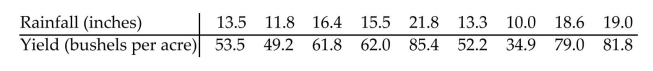
significant. Be sure to do the following: Identify the claim mathematically and state the null and alternative hypotheses.
Determine the critical value and find the test statistic. Decide whether to reject or fail to reject the null hypothesis and
interpret the decision in the context of the original claim.
In an area of the Midwest, records were kept on the rainfall and the yield of wheat. Can you conclude that
there is a correlation between rainfall and yield of wheat? Use
= 0.01. Question
The table below lists the verbal and math SAT scores of 35 students selected at random. Test the claim of no
correlation between verbal and math SAT scores. Use = 0.05.
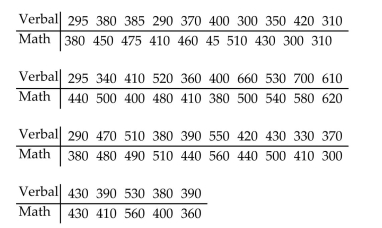
correlation between verbal and math SAT scores. Use
= 0.05. Question

Unlock Deck
Sign up to unlock the cards in this deck!
Unlock Deck
Unlock Deck
1/81
Play
Full screen (f)
Deck 11: Nonparametric Tests Online and CD Only
1
Perform the indicated sign test. Be sure to do the following: Identify the claim mathematically and state the null and
alternative hypotheses. Determine the critical value and find the test statistic. Decide whether to reject or fail to reject
the null hypothesis and interpret the decision in the context of the original claim.
A government agency claims that the median hourly wages for workers at fast food restaurants in the western
U.S. is $6.35. In a random sample of 100 workers, 68 were paid less than $6.35, 10 were paid
$6.35, and the rest more than $6.35. Test the governmentʹs claim. Use
H₀: median = $6.35 (claim);  critical value -1.96; test statistic z
  reject H₀; There is sufficient evidence at the 5% significance level to reject
the claim that the median hourly wages for workers at fast food restaurants in the western U.S. is $6.35.
critical value -1.96; test statistic z reject H₀; There is sufficient evidence at the 5% significance level to rejectthe claim that the median hourly wages for workers at fast food restaurants in the western U.S. is $6.35.
2
A college researcher claims that the median hours worked by full time students is at least 10 hours per week. In a random sample of 100 students, 65 worked more than 10 hours, 10 worked exactly 10 hours and the rest
Worked less than 10 hours. Find the critical value to test the researcherʹs claim. Use = 0.05.
A)-1.645
B)-1.96
C)-2.33
D)-2.575
Worked less than 10 hours. Find the critical value to test the researcherʹs claim. Use = 0.05.
A)-1.645
B)-1.96
C)-2.33
D)-2.575
-1.645
3
A college researcher claims that the median hours worked by full time students is at least 13 hours per week. In a random sample of 100 students, 58 worked more than 13 hours, 10 worked exactly 13 hours and the rest
Worked less than 13 hours. Find the test statistic to test the researcherʹs claim.
A)-2.635
B)-2.741
C)-3.5
D)-3.6
Worked less than 13 hours. Find the test statistic to test the researcherʹs claim.
A)-2.635
B)-2.741
C)-3.5
D)-3.6
-2.635
4
A convenience store owner believes that the median number of lottery tickets sold per day is 73. A random sample of 20 days yields the data below. Find the test statistic x to test the ownerʹs claim.
A)8
B)10
C)2
D)18
A)8
B)10
C)2
D)18
Unlock Deck
Unlock for access to all 81 flashcards in this deck.
Unlock Deck
k this deck
5
A government agency claims that the median hourly wages for workers at fast food restaurants in the western U.S. is $6.55. In a random sample of 100 workers, 68 were paid less than $6.55, 10 were paid
$6.55, and the rest more than $6.55. Find the test statistic z to test the governmentʹs claim.
A)-4.743
B)-3.912
C)-3.187
D)-2.386
$6.55, and the rest more than $6.55. Find the test statistic z to test the governmentʹs claim.
A)-4.743
B)-3.912
C)-3.187
D)-2.386
Unlock Deck
Unlock for access to all 81 flashcards in this deck.
Unlock Deck
k this deck
6
Perform the indicated sign test. Be sure to do the following: Identify the claim mathematically and state the null and
alternative hypotheses. Determine the critical value and find the test statistic. Decide whether to reject or fail to reject
the null hypothesis and interpret the decision in the context of the original claim.
Test the hypothesis that the median age of statistics teachers is 51 years. A random sample of 60 statistics
teachers found 25 above 51 years and 35 below 51 years. Use
Unlock Deck
Unlock for access to all 81 flashcards in this deck.
Unlock Deck
k this deck
7
A convenience store owner believes that the median number of lottery tickets sold per day is 49. A random sample of 20 days yields the data below. Find the critical value to test the ownerʹs claim.
A)4
B)2
C)3
D)5
A)4
B)2
C)3
D)5
Unlock Deck
Unlock for access to all 81 flashcards in this deck.
Unlock Deck
k this deck
8
A club professional at a major golf course claims that the course is so tough that even professional golfers rarely break par of 73. The scores from a random sample of 20 professional golfers are listed below. Find the
Test statistic x to test the club professionalʹs claim.
A)6
B)4
C)14
D)10
Test statistic x to test the club professionalʹs claim.
A)6
B)4
C)14
D)10
Unlock Deck
Unlock for access to all 81 flashcards in this deck.
Unlock Deck
k this deck
9
A real estate agent surmises that the median rent for a one-bedroom apartment in a beach community in southern California is at least $1700 per month. The rents for a random sample of 15 one-bedroom apartments
Are listed below. Find the test statistic x to test the agentʹs claim.
A)6
B)7
C)13
D)1
Are listed below. Find the test statistic x to test the agentʹs claim.
A)6
B)7
C)13
D)1
Unlock Deck
Unlock for access to all 81 flashcards in this deck.
Unlock Deck
k this deck
10
Perform the indicated sign test. Be sure to do the following: Identify the claim mathematically and state the null and
alternative hypotheses. Determine the critical value and find the test statistic. Decide whether to reject or fail to reject
the null hypothesis and interpret the decision in the context of the original claim.
Nine students took the SAT test. Their scores are listed below. Later on, they took a test preparation course and
retook the SAT. Their new scores are listed below. Use the sign test to test the claim that the test preparation
has no effect on their scores. Use
Unlock Deck
Unlock for access to all 81 flashcards in this deck.
Unlock Deck
k this deck
11
Perform the indicated sign test. Be sure to do the following: Identify the claim mathematically and state the null and
alternative hypotheses. Determine the critical value and find the test statistic. Decide whether to reject or fail to reject
the null hypothesis and interpret the decision in the context of the original claim.
A weight-lifting coach claims that weight-lifters can increase strength by taking vitamin E. To test the theory,
the coach randomly selects 9 athletes and gives them a strength test using a bench press. Thirty days later, after
regular training supplemented by vitamin E, they are tested again. The results are listed below. Use the sign
test to test the claim that the vitamin E supplement is effective in increasing the athletesʹ strength. Use
Unlock Deck
Unlock for access to all 81 flashcards in this deck.
Unlock Deck
k this deck
12
Perform the indicated sign test. Be sure to do the following: Identify the claim mathematically and state the null and
alternative hypotheses. Determine the critical value and find the test statistic. Decide whether to reject or fail to reject
the null hypothesis and interpret the decision in the context of the original claim.
A real estate agent surmises that the median rent for a one-bedroom apartment in a beach community in
southern California is at least $1500 per month. The rents for a random sample of 15 one-bedroom apartments
are listed below. Test the agentʹs claim. Use
Unlock Deck
Unlock for access to all 81 flashcards in this deck.
Unlock Deck
k this deck
13
Perform the indicated sign test. Be sure to do the following: Identify the claim mathematically and state the null and
alternative hypotheses. Determine the critical value and find the test statistic. Decide whether to reject or fail to reject
the null hypothesis and interpret the decision in the context of the original claim.
A convenience store owner believes that the median number of lottery tickets sold per day is 44. A random
sample of 20 days yields the data below. Test the ownerʹs claim. Use
Unlock Deck
Unlock for access to all 81 flashcards in this deck.
Unlock Deck
k this deck
14
Perform the indicated sign test. Be sure to do the following: Identify the claim mathematically and state the null and
alternative hypotheses. Determine the critical value and find the test statistic. Decide whether to reject or fail to reject
the null hypothesis and interpret the decision in the context of the original claim.
A pharmaceutical company wishes to test a new drug with the expectation of lowering cholesterol levels. Ten
subjects are randomly selected and their cholesterol levels are recorded. The results are listed below. The
subjects were placed on the drug for a period of 6 months, after which their cholesterol levels were tested
again. The results are listed below. (All units are milligrams per deciliter.)Use the sign test to test the
companyʹs claim that the drug lowers cholesterol levels. Use = 0.01.
alternative hypotheses. Determine the critical value and find the test statistic. Decide whether to reject or fail to reject
the null hypothesis and interpret the decision in the context of the original claim.
A pharmaceutical company wishes to test a new drug with the expectation of lowering cholesterol levels. Ten
subjects are randomly selected and their cholesterol levels are recorded. The results are listed below. The
subjects were placed on the drug for a period of 6 months, after which their cholesterol levels were tested
again. The results are listed below. (All units are milligrams per deciliter.)Use the sign test to test the
companyʹs claim that the drug lowers cholesterol levels. Use
= 0.01. Unlock Deck
Unlock for access to all 81 flashcards in this deck.
Unlock Deck
k this deck
15
Perform the indicated sign test. Be sure to do the following: Identify the claim mathematically and state the null and
alternative hypotheses. Determine the critical value and find the test statistic. Decide whether to reject or fail to reject
the null hypothesis and interpret the decision in the context of the original claim.
A car dealer claims that its new model car still gets at least 21 miles per gallon of gas. Ten cars are tested. The
results are given below. Test the dealerʹs claim. Use
Unlock Deck
Unlock for access to all 81 flashcards in this deck.
Unlock Deck
k this deck
16
Perform the indicated sign test. Be sure to do the following: Identify the claim mathematically and state the null and
alternative hypotheses. Determine the critical value and find the test statistic. Decide whether to reject or fail to reject
the null hypothesis and interpret the decision in the context of the original claim.
A club professional at a major golf course claims that the course is so tough that the median score is greater
than 75. The scores from a random sample of 20 professional golfers are listed below. Test the club
professionalʹs claim. Use
Unlock Deck
Unlock for access to all 81 flashcards in this deck.
Unlock Deck
k this deck
17
A real estate agent surmises that the median rent for a one-bedroom apartment in a beach community in southern California is at least $1300 per month. The rents for a random sample of 15 one-bedroom apartments
Are listed below. Find the critical value to test the agentʹs claim. Use .
A)1
B)2
C)3
D)4
Are listed below. Find the critical value to test the agentʹs claim. Use .
A)1
B)2
C)3
D)4
Unlock Deck
Unlock for access to all 81 flashcards in this deck.
Unlock Deck
k this deck
18
A club professional at a major golf course claims that the course is so tough that even professional golfers rarely break par of 68. The scores from a random sample of 20 professional golfers are listed below. Find the
Critical value to test the club professionalʹs claim. Use
A)4
B)3
C)2
D)1
Critical value to test the club professionalʹs claim. Use
A)4
B)3
C)2
D)1
Unlock Deck
Unlock for access to all 81 flashcards in this deck.
Unlock Deck
k this deck
19
Perform the indicated sign test. Be sure to do the following: Identify the claim mathematically and state the null and
alternative hypotheses. Determine the critical value and find the test statistic. Decide whether to reject or fail to reject
the null hypothesis and interpret the decision in the context of the original claim.
In a study of the effectiveness of physical exercise in weight loss, 20 people were randomly selected to
participate in a program for 30 days. Use the sign test to test the claim that exercise has no effect on weight loss.
Use
Unlock Deck
Unlock for access to all 81 flashcards in this deck.
Unlock Deck
k this deck
20
A government agency claims that the median hourly wages for workers at fast food restaurants in the western U.S. is $6.65. In a random sample of 100 workers, 68 were paid less than $6.65, 10 were paid $6.65, and the rest
More than $6.65. Find the critical values to test the governmentʹs claim. Use
A)-1.96
B)1.96
C)-1.645
D)2.575
More than $6.65. Find the critical values to test the governmentʹs claim. Use
A)-1.96
B)1.96
C)-1.645
D)2.575
Unlock Deck
Unlock for access to all 81 flashcards in this deck.
Unlock Deck
k this deck
21
Perform the indicated sign test. Be sure to do the following: Identify the claim mathematically and state the null and
alternative hypotheses. Determine the critical value and find the test statistic. Decide whether to reject or fail to reject
the null hypothesis and interpret the decision in the context of the original claim.
A company claims that the median monthly earnings of its farm workers is greater than $919. To test the claim,
100 workers are randomly selected and asked to provide their monthly earnings. The data is shown below. Test
the companyʹs claim. Use
Unlock Deck
Unlock for access to all 81 flashcards in this deck.
Unlock Deck
k this deck
22
Perform the indicated sign test. Be sure to do the following: Identify the claim mathematically and state the null and
alternative hypotheses. Determine the critical value and find the test statistic. Decide whether to reject or fail to reject
the null hypothesis and interpret the decision in the context of the original claim.
A physicianʹs group claims that a personʹs diastolic blood pressure can be lowered by listening to a relaxation
tape each evening. Ten subjects are randomly selected and their blood pressures are measured. The 10 patients
are given the tapes and told to listen to them each evening for one month. At the end of the month, their blood
pressures are measured again. The blood pressures in mm Hg are listed below. Use the sign test to test the
physicianʹs claim. Use
Unlock Deck
Unlock for access to all 81 flashcards in this deck.
Unlock Deck
k this deck
23
A researcher wants to know if the time spent in prison for a particular type of crime was the same for men and women. A random sample of men and women were each asked to give the length of sentence received. The
Data, in years, are listed below. What is the appropriate test to test the claim that there is no difference in the
Sentence received by each sex?
A)Wilcoxon rank sum test
B)Wilcoxon signed-rank test
C)Sign test
D)t-test
Data, in years, are listed below. What is the appropriate test to test the claim that there is no difference in the
Sentence received by each sex?
A)Wilcoxon rank sum test
B)Wilcoxon signed-rank test
C)Sign test
D)t-test
Unlock Deck
Unlock for access to all 81 flashcards in this deck.
Unlock Deck
k this deck
24
Perform the indicated Wilcoxon test. Be sure to do the following: Identify the claim mathematically and state the null
and alternative hypotheses. Determine the critical value and find the test statistic. Decide whether to reject or fail to
reject the null hypothesis and interpret the decision in the context of the original claim.
A random sample of nine students took the SAT test. and later on retook the test after taking a test preparation
course. Their scores are listed below. Use the Wilcoxon signed-rank test to test the claim that the test
preparation has no effect on their scores. Use
Unlock Deck
Unlock for access to all 81 flashcards in this deck.
Unlock Deck
k this deck
25
Perform the indicated Wilcoxon test. Be sure to do the following: Identify the claim mathematically and state the null
and alternative hypotheses. Determine the critical value and find the test statistic. Decide whether to reject or fail to
reject the null hypothesis and interpret the decision in the context of the original claim.
In a study of the effectiveness of physical exercise on weight loss, 20 people were randomly selected to
participate in a program for 30 days. Use the Wilcoxon signed-rank test to test the claim that exercise has no
effect on weight loss. Use
Unlock Deck
Unlock for access to all 81 flashcards in this deck.
Unlock Deck
k this deck
26
A weight-lifting coach claims that a weight-lifter can increase strength by taking vitamin E. To test the theory, the coach randomly selects 9 athletes and gives them a strength test using a bench press. The results are listed
Below. Thirty days later, after regular training supplemented by vitamin E, they are tested again. The new
Results are listed below. Find the critical value for a Wilcoxon signed-rank test to test the claim that the vitamin
E supplement is effective in increasing the athletesʹ strength. Use = 0.05.
A)6
B)4
C)2
D)3
Unlock Deck
Unlock for access to all 81 flashcards in this deck.
Unlock Deck
k this deck
27
A pharmaceutical company wishes to test a new drug with the expectation of lowering cholesterol levels. Ten subjects are randomly selected and their cholesterol levels are recorded. The results are listed below. The
Subjects were placed on the drug for a period of 6 months, after which their cholesterol levels were tested
Again. The results are listed below. (All units are milligrams per deciliter.)Use the Wilcoxon signed-rank test to
Find the test statistic to test the companyʹs claim that the drug lowers cholesterol levels.
A)4
B)7.5
C)-2
D)5.5
Unlock Deck
Unlock for access to all 81 flashcards in this deck.
Unlock Deck
k this deck
28
A researcher wants to know if the time spent in prison for a particular type of crime was the same for men and women. A random sample of men and women were each asked to give the length of sentence received. The
Data, in years, are listed below. Use the Wilcoxon rank sum test to find R, the sum of the ranks for the smaller
Sample, to test the claim that there is no difference in the sentence received by each gender.
A)125.5
B)115.5
C)173.5
D)155.5
Data, in years, are listed below. Use the Wilcoxon rank sum test to find R, the sum of the ranks for the smaller
Sample, to test the claim that there is no difference in the sentence received by each gender.
A)125.5
B)115.5
C)173.5
D)155.5
Unlock Deck
Unlock for access to all 81 flashcards in this deck.
Unlock Deck
k this deck
29
Verbal SAT scores for students randomly selected from two different schools are listed below. Use the Wilcoxon rank sum test to find R to test the claim that there is no difference in the scores from each school.
A)128.5
B)171.5
C)75.5
D)38.5
A)128.5
B)171.5
C)75.5
D)38.5
Unlock Deck
Unlock for access to all 81 flashcards in this deck.
Unlock Deck
k this deck
30
Perform the indicated Wilcoxon test. Be sure to do the following: Identify the claim mathematically and state the null
and alternative hypotheses. Determine the critical value and find the test statistic. Decide whether to reject or fail to
reject the null hypothesis and interpret the decision in the context of the original claim.
A weight-lifting coach claims that weight-lifters can increase their strength by taking vitamin E. To test the
theory, the coach randomly selects 9 athletes and gives them a strength test using a bench press. Thirty days
later, after regular training supplemented by vitamin E, they are tested again. The results are listed below. Use
the Wilcoxon signed-rank test to test the claim that the vitamin E supplement is effective in increasing athletesʹ
strength. Use
Unlock Deck
Unlock for access to all 81 flashcards in this deck.
Unlock Deck
k this deck
31
Nine students took the SAT test. Their scores are listed below. Later on, they took a test preparation course and retook the SAT. Their new scores are listed below. Use the Wilcoxon signed-rank test to find the test statistic
Ws to test the claim that the test preparation had no effect on their scores. Use = 0.05.
A)4
B)-4
C)41
D)-41
Ws to test the claim that the test preparation had no effect on their scores. Use = 0.05.
A)4
B)-4
C)41
D)-41
Unlock Deck
Unlock for access to all 81 flashcards in this deck.
Unlock Deck
k this deck
32
Perform the indicated Wilcoxon test. Be sure to do the following: Identify the claim mathematically and state the null
and alternative hypotheses. Determine the critical value and find the test statistic. Decide whether to reject or fail to
reject the null hypothesis and interpret the decision in the context of the original claim.
A local school district is concerned about the number of school days missed by its teachers due to illness. A
random sample of 10 teachers is selected. The numbers of absences in one year are recorded. An incentive
program is then offered in an attempt to reduce the absences. The numbers of absences in the year after the
incentive program are recorded. The results are listed below. Use the Wilcoxon signed-rank test to test the
claim that the incentive program is effective in reducing the number of days missed by teachers. Use = 0.05.
and alternative hypotheses. Determine the critical value and find the test statistic. Decide whether to reject or fail to
reject the null hypothesis and interpret the decision in the context of the original claim.
A local school district is concerned about the number of school days missed by its teachers due to illness. A
random sample of 10 teachers is selected. The numbers of absences in one year are recorded. An incentive
program is then offered in an attempt to reduce the absences. The numbers of absences in the year after the
incentive program are recorded. The results are listed below. Use the Wilcoxon signed-rank test to test the
claim that the incentive program is effective in reducing the number of days missed by teachers. Use
= 0.05. Unlock Deck
Unlock for access to all 81 flashcards in this deck.
Unlock Deck
k this deck
33
A physician claims that a personʹs diastolic blood pressure can be lowered, if, instead of taking a drug, the person listens to a relaxation tape each evening. Ten subjects are randomly selected. Their blood pressures,
Measured in millimeters of mercury, are listed below. The 10 patients are given the tapes and told to listen to
Them each evening for one month. At the end of the month, their blood pressures are taken again. The data are
Listed below. Find the critical value for a Wilcoxon signed-rank test to test the physicianʹs claim. Use = 0.05.
A)8
B)6
C)2
D)4
Unlock Deck
Unlock for access to all 81 flashcards in this deck.
Unlock Deck
k this deck
34
Perform the indicated sign test. Be sure to do the following: Identify the claim mathematically and state the null and
alternative hypotheses. Determine the critical value and find the test statistic. Decide whether to reject or fail to reject
the null hypothesis and interpret the decision in the context of the original claim.
Test the hypothesis that the median age of statistics teachers is less than 45 years. A random sample of 60
statistics teachers found 25 above 45 years, 33 below 45 years, and the rest exactly 45 years. Use
Unlock Deck
Unlock for access to all 81 flashcards in this deck.
Unlock Deck
k this deck
35
Perform the indicated Wilcoxon test. Be sure to do the following: Identify the claim mathematically and state the null
and alternative hypotheses. Determine the critical value and find the test statistic. Decide whether to reject or fail to
reject the null hypothesis and interpret the decision in the context of the original claim.
A physician claims that a personʹs diastolic blood pressure can be lowered by listening to a relaxation tape each
evening. Ten subjects are randomly selected and their blood pressures are measured. The 10 patients then listen
to the tapes each evening for one month. At the end of the month, their blood pressures are measured again.
The data (in mm Hg)are listed below. Use the Wilcoxon signed-rank test to test the physicianʹs claim. Use .05.
and alternative hypotheses. Determine the critical value and find the test statistic. Decide whether to reject or fail to
reject the null hypothesis and interpret the decision in the context of the original claim.
A physician claims that a personʹs diastolic blood pressure can be lowered by listening to a relaxation tape each
evening. Ten subjects are randomly selected and their blood pressures are measured. The 10 patients then listen
to the tapes each evening for one month. At the end of the month, their blood pressures are measured again.
The data (in mm Hg)are listed below. Use the Wilcoxon signed-rank test to test the physicianʹs claim. Use
.05. Unlock Deck
Unlock for access to all 81 flashcards in this deck.
Unlock Deck
k this deck
36
Perform the indicated sign test. Be sure to do the following: Identify the claim mathematically and state the null and
alternative hypotheses. Determine the critical value and find the test statistic. Decide whether to reject or fail to reject
the null hypothesis and interpret the decision in the context of the original claim.
A local school district is concerned about the number of school days missed by its teachers due to illness. A
random sample of 10 teachers is selected. The numbers of absences in one year are listed below. An incentive
program is offered in an attempt to decrease the number of days absent. The numbers of absences in the year
after the incentive program are also listed. Use the sign test to test the claim that the incentive program reduces
the number of days missed by teachers. Use = 0.05.
alternative hypotheses. Determine the critical value and find the test statistic. Decide whether to reject or fail to reject
the null hypothesis and interpret the decision in the context of the original claim.
A local school district is concerned about the number of school days missed by its teachers due to illness. A
random sample of 10 teachers is selected. The numbers of absences in one year are listed below. An incentive
program is offered in an attempt to decrease the number of days absent. The numbers of absences in the year
after the incentive program are also listed. Use the sign test to test the claim that the incentive program reduces
the number of days missed by teachers. Use
= 0.05. Unlock Deck
Unlock for access to all 81 flashcards in this deck.
Unlock Deck
k this deck
37
Perform the indicated Wilcoxon test. Be sure to do the following: Identify the claim mathematically and state the null
and alternative hypotheses. Determine the critical value and find the test statistic. Decide whether to reject or fail to
reject the null hypothesis and interpret the decision in the context of the original claim.
Verbal SAT scores for students randomly selected from two different schools are listed below. Use the
Wilcoxon rank sum test to test the claim that there is no difference in the scores from the two schools.
Use = 0.05.
and alternative hypotheses. Determine the critical value and find the test statistic. Decide whether to reject or fail to
reject the null hypothesis and interpret the decision in the context of the original claim.
Verbal SAT scores for students randomly selected from two different schools are listed below. Use the
Wilcoxon rank sum test to test the claim that there is no difference in the scores from the two schools.
Use
= 0.05. Unlock Deck
Unlock for access to all 81 flashcards in this deck.
Unlock Deck
k this deck
38
Perform the indicated sign test. Be sure to do the following: Identify the claim mathematically and state the null and
alternative hypotheses. Determine the critical value and find the test statistic. Decide whether to reject or fail to reject
the null hypothesis and interpret the decision in the context of the original claim.
One hundred people go on a special diet with the intention of losing weight. At the end of 6 weeks, 59 lost
weight, 27 gained weight and the rest remained the same. Test the hypothesis that the diet is effective in
reducing weight. Use = 0.05. (Note: The diet will be effective if at least 50% lose weight.)
alternative hypotheses. Determine the critical value and find the test statistic. Decide whether to reject or fail to reject
the null hypothesis and interpret the decision in the context of the original claim.
One hundred people go on a special diet with the intention of losing weight. At the end of 6 weeks, 59 lost
weight, 27 gained weight and the rest remained the same. Test the hypothesis that the diet is effective in
reducing weight. Use
= 0.05. (Note: The diet will be effective if at least 50% lose weight.) Unlock Deck
Unlock for access to all 81 flashcards in this deck.
Unlock Deck
k this deck
39
Perform the indicated sign test. Be sure to do the following: Identify the claim mathematically and state the null and
alternative hypotheses. Determine the critical value and find the test statistic. Decide whether to reject or fail to reject
the null hypothesis and interpret the decision in the context of the original claim.
A college researcher claims that the median time worked by full time students is at least 10 hours per week. In
a random sample of 100 students, 59 worked more than 10 hours, 10 worked exactly 10 hours and the rest
worked less than 10 hours. Test the researcherʹs claim. Use
Unlock Deck
Unlock for access to all 81 flashcards in this deck.
Unlock Deck
k this deck
40
Perform the indicated Wilcoxon test. Be sure to do the following: Identify the claim mathematically and state the null
and alternative hypotheses. Determine the critical value and find the test statistic. Decide whether to reject or fail to
reject the null hypothesis and interpret the decision in the context of the original claim.
A pharmaceutical company wishes to test a new drug with the expectation of lowering cholesterol levels. Ten
subjects are randomly selected and their cholesterol levels are recorded. The subjects were then placed on the
drug for a period of 6 months, after which their cholesterol levels were tested again. The results (in mg per
deciliter)are listed below. Use the Wilcoxon signed-rank test to test the companyʹs claim that the drug lowers
cholesterol levels. Use
Unlock Deck
Unlock for access to all 81 flashcards in this deck.
Unlock Deck
k this deck
41
Perform the indicated Wilcoxon test. Be sure to do the following: Identify the claim mathematically and state the null
and alternative hypotheses. Determine the critical value and find the test statistic. Decide whether to reject or fail to
reject the null hypothesis and interpret the decision in the context of the original claim.
A statistics teacher wanted to see whether there was a significant difference in age between day students and
night students. A random sample of 35 students from each group was selected. The data are given below. Use
the Wilcoxon rank sum test to test the claim that there is no difference in age between the two groups. Use .05.
and alternative hypotheses. Determine the critical value and find the test statistic. Decide whether to reject or fail to
reject the null hypothesis and interpret the decision in the context of the original claim.
A statistics teacher wanted to see whether there was a significant difference in age between day students and
night students. A random sample of 35 students from each group was selected. The data are given below. Use
the Wilcoxon rank sum test to test the claim that there is no difference in age between the two groups. Use
.05. Unlock Deck
Unlock for access to all 81 flashcards in this deck.
Unlock Deck
k this deck
42
The table below lists the verbal and math SAT scores of 10 students selected at random. Find the test statistic to test the claim of no correlation between verbal and math SAT scores.
A)-0.006
B)-0.0192
C)-0.218
D)-0.326
A)-0.006
B)-0.0192
C)-0.218
D)-0.326
Unlock Deck
Unlock for access to all 81 flashcards in this deck.
Unlock Deck
k this deck
43
Use the Spearman rank correlation coefficient to determine whether the correlation between the given variables is
significant. Be sure to do the following: Identify the claim mathematically and state the null and alternative hypotheses.
Determine the critical value and find the test statistic. Decide whether to reject or fail to reject the null hypothesis and
interpret the decision in the context of the original claim.
The drama department at a college asked professors and students in the drama department to rank 8 actors
according to their performance. The data are listed below. A 10 is the highest ranking and a 1 the lowest
ranking. Test the claim that there is no correlation between professorsʹ and studentsʹ rankings. Use
Unlock Deck
Unlock for access to all 81 flashcards in this deck.
Unlock Deck
k this deck
44
Perform the indicated Kruskall-Wallis test. Be sure to do the following: Identify the claim mathematically and state the
null and alternative hypotheses. Determine the critical value and find the test statistic. Decide whether to reject or fail
to reject the null hypothesis and interpret the decision in the context of the original claim.
Four different types of fertilizers are used on raspberry plants. The number of raspberries on each randomly
selected plant is given below. Use the Kruskal-Wallis test to test the claim that there is no difference in the
distributions of the number of raspberries for the four different types of fertilizer. Use α = 0.05.
8 6
6
7
null and alternative hypotheses. Determine the critical value and find the test statistic. Decide whether to reject or fail
to reject the null hypothesis and interpret the decision in the context of the original claim.
Four different types of fertilizers are used on raspberry plants. The number of raspberries on each randomly
selected plant is given below. Use the Kruskal-Wallis test to test the claim that there is no difference in the
distributions of the number of raspberries for the four different types of fertilizer. Use
α = 0.05.8
66
7
Unlock Deck
Unlock for access to all 81 flashcards in this deck.
Unlock Deck
k this deck
45
A medical researcher wishes to try three different techniques to lower blood pressure of patients with high blood pressure. The subjects are randomly selected and assigned to one of three groups. Group 1 is given
Medication, Group 2 is given an exercise program, and Group 3 is assigned a diet program. At the end of six
Weeks, the reduction in each subjectʹs blood pressure is recorded. Use the Kruskal-Wallis test to find the critical
Value to test the claim that there is no difference in the distribution of the populations. Use = 0.05.
A)5.991
B)4.153
C)3.195
D)1.960
Unlock Deck
Unlock for access to all 81 flashcards in this deck.
Unlock Deck
k this deck
46
Perform the indicated Kruskall-Wallis test. Be sure to do the following: Identify the claim mathematically and state the
null and alternative hypotheses. Determine the critical value and find the test statistic. Decide whether to reject or fail
to reject the null hypothesis and interpret the decision in the context of the original claim.
A realtor wishes to compare the square footage of houses of similar prices in 4 different cities. The data are
listed below. Use the Kruskal-Wallis test to test the claim that there is a difference in the distributions of the
square footages in the 4 different cities. Use
Unlock Deck
Unlock for access to all 81 flashcards in this deck.
Unlock Deck
k this deck
47
A researcher claims that the lifetimes (in hours)of fluorescent light bulbs are the same regardless of
manufacturer. Random samples are selected from 3 different manufacturers. The data are listed below. Test the
claim that the samples come from identical populations by using (a)a one-way ANOVA test and
(b)a Kruskal-Wallis test. Compare the results. Use = 0.05.
manufacturer. Random samples are selected from 3 different manufacturers. The data are listed below. Test the
claim that the samples come from identical populations by using (a)a one-way ANOVA test and
(b)a Kruskal-Wallis test. Compare the results. Use
= 0.05. Unlock Deck
Unlock for access to all 81 flashcards in this deck.
Unlock Deck
k this deck
48
Perform the indicated Kruskall-Wallis test. Be sure to do the following: Identify the claim mathematically and state the
null and alternative hypotheses. Determine the critical value and find the test statistic. Decide whether to reject or fail
to reject the null hypothesis and interpret the decision in the context of the original claim.
The grade point averages of students participating in different sports at a college are to be compared. The data
are listed below. Use the Kruskal-Wallis test to test the claim that there is a difference in the distribution of the
GPAs of the three different sports groups. Use
Unlock Deck
Unlock for access to all 81 flashcards in this deck.
Unlock Deck
k this deck
49
Perform the indicated Kruskall-Wallis test. Be sure to do the following: Identify the claim mathematically and state the
null and alternative hypotheses. Determine the critical value and find the test statistic. Decide whether to reject or fail
to reject the null hypothesis and interpret the decision in the context of the original claim.
A medical researcher wishes to try three different techniques to lower blood pressure of patients with high
blood pressure. The subjects are randomly selected and randomly assigned to one of three groups. Group 1 is
given medication, Group 2 is given an exercise program, and Group 3 is assigned a special diet. At the end of
six weeks, the reduction in each subjectʹs blood pressure is recorded. Use the Kruskal-Wallis test to test the
claim that there is no difference in the distributions of the blood pressures of the three populations. Use
Unlock Deck
Unlock for access to all 81 flashcards in this deck.
Unlock Deck
k this deck
50
Perform the indicated Wilcoxon test. Be sure to do the following: Identify the claim mathematically and state the null
and alternative hypotheses. Determine the critical value and find the test statistic. Decide whether to reject or fail to
reject the null hypothesis and interpret the decision in the context of the original claim.
A researcher wants to know if the length of sentences received for a particular type of crime was the same for
men and women. The length of sentence received was recorded for a random sample of men and women . The
data, in years, are listed below. Use the Wilcoxon rank sum test to test the claim that there is no difference
between the sentences received by men and the sentences received by women. Use = 0.05.
and alternative hypotheses. Determine the critical value and find the test statistic. Decide whether to reject or fail to
reject the null hypothesis and interpret the decision in the context of the original claim.
A researcher wants to know if the length of sentences received for a particular type of crime was the same for
men and women. The length of sentence received was recorded for a random sample of men and women . The
data, in years, are listed below. Use the Wilcoxon rank sum test to test the claim that there is no difference
between the sentences received by men and the sentences received by women. Use
= 0.05. Unlock Deck
Unlock for access to all 81 flashcards in this deck.
Unlock Deck
k this deck
51
Four different types of fertilizers are used on raspberry plants. The number of raspberries on each randomly selected plant is given below. Use the Kruskal-Wallis test to find the test statistic H to test the claim that there
Is no difference in the distribution of the populations.
A)12.833
B)10.922
C)15.364
D)14.818
Is no difference in the distribution of the populations.
A)12.833
B)10.922
C)15.364
D)14.818
Unlock Deck
Unlock for access to all 81 flashcards in this deck.
Unlock Deck
k this deck
52
A medical researcher wishes to try three different techniques to lower blood pressure of patients with high blood pressure. The subjects are randomly selected and assigned to one of three groups. Group 1 is given
Medication, Group 2 is given an exercise program, and Group 3 is assigned a diet program. At the end of six
Weeks, the reduction in each subjectʹs blood pressure is recorded. Use the Kruskal-Wallis test to find the test
Statistic H to test the claim that there is no difference in the distribution of the populations.
A)10.187
B)8.312
C)6.813
D)5.321
Unlock Deck
Unlock for access to all 81 flashcards in this deck.
Unlock Deck
k this deck
53
Perform the indicated Kruskall-Wallis test. Be sure to do the following: Identify the claim mathematically and state the
null and alternative hypotheses. Determine the critical value and find the test statistic. Decide whether to reject or fail
to reject the null hypothesis and interpret the decision in the context of the original claim.
A researcher wishes to test the claim that there is a difference in the distribution of ages of elementary school,
high school, and community college teachers. Teachers are randomly selected from each group. Their ages are
recorded below. Can you conclude that the distributions of teachersʹ ages at these different levels of education
are different? Use
Unlock Deck
Unlock for access to all 81 flashcards in this deck.
Unlock Deck
k this deck
54
Perform the indicated Kruskall-Wallis test. Be sure to do the following: Identify the claim mathematically and state the
null and alternative hypotheses. Determine the critical value and find the test statistic. Decide whether to reject or fail
to reject the null hypothesis and interpret the decision in the context of the original claim.
A researcher wishes to compare times it takes workers to assemble a certain computer component using
different machines. Workers are randomly selected and randomly assigned to one of three different machines.
The time (in minutes)it takes each worker to assemble the component is recorded. Use the Kruskal-Wallis test
to test the claim that there is a difference in the distributions of the assembly times for the three machines. Use
Unlock Deck
Unlock for access to all 81 flashcards in this deck.
Unlock Deck
k this deck
55
Four different types of fertilizers are used on raspberry plants. The number of raspberries on each randomly
selected plant is given below. Test the claim using (a)a Kurskal-Wallis test and (b)a one-way ANOVA test
that the type of fertilizer makes no difference in the mean number of raspberries per plant. Compare the results.
Use
selected plant is given below. Test the claim using (a)a Kurskal-Wallis test and (b)a one-way ANOVA test
that the type of fertilizer makes no difference in the mean number of raspberries per plant. Compare the results.
Use
Unlock Deck
Unlock for access to all 81 flashcards in this deck.
Unlock Deck
k this deck
56
Use the Spearman rank correlation coefficient to determine whether the correlation between the given variables is
significant. Be sure to do the following: Identify the claim mathematically and state the null and alternative hypotheses.
Determine the critical value and find the test statistic. Decide whether to reject or fail to reject the null hypothesis and
interpret the decision in the context of the original claim.
The table below lists the verbal and math SAT scores of 10 students selected at random. Test the claim that
there is no correlation between verbal and math SAT scores. Use = 0.05.
significant. Be sure to do the following: Identify the claim mathematically and state the null and alternative hypotheses.
Determine the critical value and find the test statistic. Decide whether to reject or fail to reject the null hypothesis and
interpret the decision in the context of the original claim.
The table below lists the verbal and math SAT scores of 10 students selected at random. Test the claim that
there is no correlation between verbal and math SAT scores. Use
= 0.05. Unlock Deck
Unlock for access to all 81 flashcards in this deck.
Unlock Deck
k this deck
57
Four different types of fertilizers are used on raspberry plants. The number of raspberries on each randomly selected plant is given below. Use the Kruskal-Wallis test to find the critical value H to test the claim that there
Is no difference in the distribution of the populations. Use = 0.05.
A)7.815
B)7.352
C)6.531
D)5.198
Is no difference in the distribution of the populations. Use = 0.05.
A)7.815
B)7.352
C)6.531
D)5.198
Unlock Deck
Unlock for access to all 81 flashcards in this deck.
Unlock Deck
k this deck
58
The drama department at a college asked professors and students in the drama department to rank 8 actors according to their performance. The data are listed below. A 10 is the highest ranking and a 1 the lowest
Ranking. Find the test statistic to test the claim of no correlation between the rankings.
A)-0.208
B)-0.198
C)-0.354
D)-0.278
Ranking. Find the test statistic to test the claim of no correlation between the rankings.
A)-0.208
B)-0.198
C)-0.354
D)-0.278
Unlock Deck
Unlock for access to all 81 flashcards in this deck.
Unlock Deck
k this deck
59
The drama department at a college asked professors and students in the drama department to rank 8 actors according to their performance. The data are listed below. A 10 is the highest ranking and a 1 the lowest
Ranking. Find the critical value to test the claim of no correlation between the rankings.
Use = 0.05.
A)0.738
B)0.643
C)0.881
D)0.833
Ranking. Find the critical value to test the claim of no correlation between the rankings.
Use = 0.05.
A)0.738
B)0.643
C)0.881
D)0.833
Unlock Deck
Unlock for access to all 81 flashcards in this deck.
Unlock Deck
k this deck
60
The table below lists the verbal and math SAT scores of 10 students selected at random. Find the critical value to test the claim of no correlation between verbal and math SAT scores. Use
A)0.648
B)0.564
C)0.794
D)-0.648
A)0.648
B)0.564
C)0.794
D)-0.648
Unlock Deck
Unlock for access to all 81 flashcards in this deck.
Unlock Deck
k this deck
61
Use the Spearman rank correlation coefficient to determine whether the correlation between the given variables is
significant. Be sure to do the following: Identify the claim mathematically and state the null and alternative hypotheses.
Determine the critical value and find the test statistic. Decide whether to reject or fail to reject the null hypothesis and
interpret the decision in the context of the original claim.
The ages and systolic blood pressures of 9 randomly selected adults are given below. Can you conclude that
there is a correlation between age and blood pressure? Use = 0.05.
significant. Be sure to do the following: Identify the claim mathematically and state the null and alternative hypotheses.
Determine the critical value and find the test statistic. Decide whether to reject or fail to reject the null hypothesis and
interpret the decision in the context of the original claim.
The ages and systolic blood pressures of 9 randomly selected adults are given below. Can you conclude that
there is a correlation between age and blood pressure? Use
= 0.05. Unlock Deck
Unlock for access to all 81 flashcards in this deck.
Unlock Deck
k this deck
62
Perform a runs test for randomness. Be sure to do the following: Identify the claim mathematically and state the null
and alternative hypotheses. Determine the critical value and find the test statistic. Decide whether to reject or fail to
reject the null hypothesis and interpret the decision in the context of the original claim.
A telemarketer solicited households to change their long-distance carrier. The results for one afternoon are
shown, where C represents the households that changed their carrier and S represents the households that kept
their existing carrier. Can you conclude that the sequence of results is random? Use = 0.05.
and alternative hypotheses. Determine the critical value and find the test statistic. Decide whether to reject or fail to
reject the null hypothesis and interpret the decision in the context of the original claim.
A telemarketer solicited households to change their long-distance carrier. The results for one afternoon are
shown, where C represents the households that changed their carrier and S represents the households that kept
their existing carrier. Can you conclude that the sequence of results is random? Use
= 0.05. Unlock Deck
Unlock for access to all 81 flashcards in this deck.
Unlock Deck
k this deck
63
Perform a runs test for randomness. Be sure to do the following: Identify the claim mathematically and state the null
and alternative hypotheses. Determine the critical value and find the test statistic. Decide whether to reject or fail to
reject the null hypothesis and interpret the decision in the context of the original claim.
An airport security officer searched carry-on bags of people boarding a plane in the sequence shown, where S
represents a searched bag and N represents a bag not searched. Can you conclude that the officer conducted a
random search? Use = 0.05.
and alternative hypotheses. Determine the critical value and find the test statistic. Decide whether to reject or fail to
reject the null hypothesis and interpret the decision in the context of the original claim.
An airport security officer searched carry-on bags of people boarding a plane in the sequence shown, where S
represents a searched bag and N represents a bag not searched. Can you conclude that the officer conducted a
random search? Use
= 0.05. Unlock Deck
Unlock for access to all 81 flashcards in this deck.
Unlock Deck
k this deck
64
A telemarketer solicited households to change their long-distance carrier. The results for one afternoon are
shown, where C represents the households that changed their carrier and S represents the households that kept
their same carrier. Find the test statistic G to test for randomness. SC
shown, where C represents the households that changed their carrier and S represents the households that kept
their same carrier. Find the test statistic G to test for randomness.
SC Unlock Deck
Unlock for access to all 81 flashcards in this deck.
Unlock Deck
k this deck
65
Use the Spearman rank correlation coefficient to determine whether the correlation between the given variables is
significant. Be sure to do the following: Identify the claim mathematically and state the null and alternative hypotheses.
Determine the critical value and find the test statistic. Decide whether to reject or fail to reject the null hypothesis and
interpret the decision in the context of the original claim.
A manager wishes to determine whether there is a relationship between the distance traveled per month by the
sales representatives and the amount of sales generated per month. Can you conclude that there is a correlation
between distance traveled and sales generated? Use = 0.05.
significant. Be sure to do the following: Identify the claim mathematically and state the null and alternative hypotheses.
Determine the critical value and find the test statistic. Decide whether to reject or fail to reject the null hypothesis and
interpret the decision in the context of the original claim.
A manager wishes to determine whether there is a relationship between the distance traveled per month by the
sales representatives and the amount of sales generated per month. Can you conclude that there is a correlation
between distance traveled and sales generated? Use
= 0.05. Unlock Deck
Unlock for access to all 81 flashcards in this deck.
Unlock Deck
k this deck
66
An airport security officer manually searched carry-on bags of people boarding a plane in the sequence shown,
where S represents a searched bag and N represents a bag not searched. Find the test statistic z to test for
randomness.
where S represents a searched bag and N represents a bag not searched. Find the test statistic z to test for
randomness.
Unlock Deck
Unlock for access to all 81 flashcards in this deck.
Unlock Deck
k this deck
67
A pitching machine throws baseballs that are either strikes (S)or balls (B). A coach records whether each ball
thrown during batting practice is a strike or a ball. Find the standardized test statistic z to test for randomness.
thrown during batting practice is a strike or a ball. Find the standardized test statistic z to test for randomness.
Unlock Deck
Unlock for access to all 81 flashcards in this deck.
Unlock Deck
k this deck
68
Use the Spearman rank correlation coefficient to determine whether the correlation between the given variables is
significant. Be sure to do the following: Identify the claim mathematically and state the null and alternative hypotheses.
Determine the critical value and find the test statistic. Decide whether to reject or fail to reject the null hypothesis and
interpret the decision in the context of the original claim.
The temperatures on randomly chosen days during a summer class and the number of absences from class on
those days are listed below. Can you conclude that there is a correlation between temperature and the number
absent? Use
Unlock Deck
Unlock for access to all 81 flashcards in this deck.
Unlock Deck
k this deck
69
Use the sequence to find the values of
Unlock Deck
Unlock for access to all 81 flashcards in this deck.
Unlock Deck
k this deck
70
Use the sequence to find the values of
Unlock Deck
Unlock for access to all 81 flashcards in this deck.
Unlock Deck
k this deck
71
The table below lists the verbal and math SAT scores of 35 students selected at random. Find the test statistic, to test the claim of no correlation between verbal and math SAT scores.
A)0.545
B)0.616
C)0.731
D)0.819
A)0.545
B)0.616
C)0.731
D)0.819
Unlock Deck
Unlock for access to all 81 flashcards in this deck.
Unlock Deck
k this deck
72
Perform a runs test for randomness. Be sure to do the following: Identify the claim mathematically and state the null
and alternative hypotheses. Determine the critical value and find the test statistic. Decide whether to reject or fail to
reject the null hypothesis and interpret the decision in the context of the original claim.
Two poker players are dealt cards in the sequence shown, where B represents a black card and R represents a
red card. Can you conclude that the dealing of cards was not random? Use = 0.05.
and alternative hypotheses. Determine the critical value and find the test statistic. Decide whether to reject or fail to
reject the null hypothesis and interpret the decision in the context of the original claim.
Two poker players are dealt cards in the sequence shown, where B represents a black card and R represents a
red card. Can you conclude that the dealing of cards was not random? Use
= 0.05. Unlock Deck
Unlock for access to all 81 flashcards in this deck.
Unlock Deck
k this deck
73
The sequence shows a companyʹs daily sales, in thousands of dollars, for the business days during the month of
September. Find the standardized test statistic, G, to test for randomness.
September. Find the standardized test statistic, G, to test for randomness.
Unlock Deck
Unlock for access to all 81 flashcards in this deck.
Unlock Deck
k this deck
74
Use the Spearman rank correlation coefficient to determine whether the correlation between the given variables is
significant. Be sure to do the following: Identify the claim mathematically and state the null and alternative hypotheses.
Determine the critical value and find the test statistic. Decide whether to reject or fail to reject the null hypothesis and
interpret the decision in the context of the original claim.
The number of absences and the final grades of 9 randomly selected students from a statistics class are given
below. Can you conclude that there is a correlation between final grade and number of absences? Use = 0.01.
significant. Be sure to do the following: Identify the claim mathematically and state the null and alternative hypotheses.
Determine the critical value and find the test statistic. Decide whether to reject or fail to reject the null hypothesis and
interpret the decision in the context of the original claim.
The number of absences and the final grades of 9 randomly selected students from a statistics class are given
below. Can you conclude that there is a correlation between final grade and number of absences? Use
= 0.01. Unlock Deck
Unlock for access to all 81 flashcards in this deck.
Unlock Deck
k this deck
75
Two poker players are dealt cards in the sequence shown, where B represents a black card and R represents a
red card. Find the test statistic G to test for randomness.
red card. Find the test statistic G to test for randomness.
Unlock Deck
Unlock for access to all 81 flashcards in this deck.
Unlock Deck
k this deck
76
Use the Spearman rank correlation coefficient to determine whether the correlation between the given variables is
significant. Be sure to do the following: Identify the claim mathematically and state the null and alternative hypotheses.
Determine the critical value and find the test statistic. Decide whether to reject or fail to reject the null hypothesis and
interpret the decision in the context of the original claim.
The final exam scores of 10 randomly selected statistics students and the number of hours they studied for the
exam are given below. Can you conclude that there is a correlation between scores on the test and time spent
studying? Use
Unlock Deck
Unlock for access to all 81 flashcards in this deck.
Unlock Deck
k this deck
77
Perform a runs test for randomness. Be sure to do the following: Identify the claim mathematically and state the null
and alternative hypotheses. Determine the critical value and find the test statistic. Decide whether to reject or fail to
reject the null hypothesis and interpret the decision in the context of the original claim.
A pitching machine throws baseballs that are either strikes (S)or balls (B). A coach records whether each ball
thrown during batting practice is a strike or a ball. Can you conclude that the sequence of pitches is random?
Use = 0.05. B
and alternative hypotheses. Determine the critical value and find the test statistic. Decide whether to reject or fail to
reject the null hypothesis and interpret the decision in the context of the original claim.
A pitching machine throws baseballs that are either strikes (S)or balls (B). A coach records whether each ball
thrown during batting practice is a strike or a ball. Can you conclude that the sequence of pitches is random?
Use
= 0.05. B Unlock Deck
Unlock for access to all 81 flashcards in this deck.
Unlock Deck
k this deck
78
Use the Spearman rank correlation coefficient to determine whether the correlation between the given variables is
significant. Be sure to do the following: Identify the claim mathematically and state the null and alternative hypotheses.
Determine the critical value and find the test statistic. Decide whether to reject or fail to reject the null hypothesis and
interpret the decision in the context of the original claim.
In an area of the Midwest, records were kept on the rainfall and the yield of wheat. Can you conclude that
there is a correlation between rainfall and yield of wheat? Use = 0.01.
significant. Be sure to do the following: Identify the claim mathematically and state the null and alternative hypotheses.
Determine the critical value and find the test statistic. Decide whether to reject or fail to reject the null hypothesis and
interpret the decision in the context of the original claim.
In an area of the Midwest, records were kept on the rainfall and the yield of wheat. Can you conclude that
there is a correlation between rainfall and yield of wheat? Use
= 0.01. Unlock Deck
Unlock for access to all 81 flashcards in this deck.
Unlock Deck
k this deck
79
The table below lists the verbal and math SAT scores of 35 students selected at random. Test the claim of no
correlation between verbal and math SAT scores. Use = 0.05.
correlation between verbal and math SAT scores. Use
= 0.05. Unlock Deck
Unlock for access to all 81 flashcards in this deck.
Unlock Deck
k this deck
80
The table below lists the verbal and math SAT scores of 35 students selected at random. Find the critical values to test the claim of no correlation between verbal and math SAT scores. Use = 0.05.
A)
B)
C)±
D)
A)
B)
C)±
D)
Unlock Deck
Unlock for access to all 81 flashcards in this deck.
Unlock Deck
k this deck
Unlock Deck
Unlock for access to all 81 flashcards in this deck.


