Deck 35: Statistical Graphs
Full screen (f)
Question
Question
Use the following graph for problems 3 through 7. This graph represents the percent of drafters employed by a company by type of drafter.  In the graph above, what percent of the drafters are Mechanical?
In the graph above, what percent of the drafters are Mechanical? Question
Question
Question
Question
Question
Question
Question
Question
Use the following graph for problems 8 through 10. This graph represents the number of hours by month spent by company XYZ on special projects. 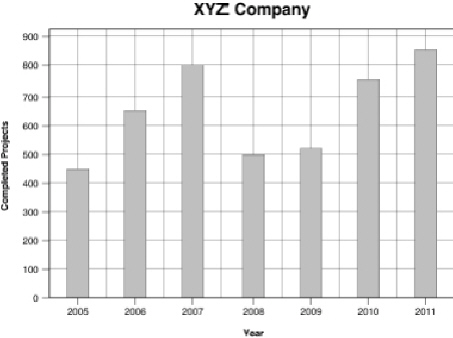 In the graph above, which year had the least completed projects?
In the graph above, which year had the least completed projects?
Unlock Deck
Sign up to unlock the cards in this deck!
Unlock Deck
Unlock Deck
1/10
Play
Full screen (f)
Deck 35: Statistical Graphs
1
In the graph above, if the total number of employees in this company is 1,000, how many employees are electrical drafters?
190
2
Use the following graph for problems 3 through 7. This graph represents the percent of drafters employed by a company by type of drafter. In the graph above, what percent of the drafters are Mechanical?
In the graph above, what percent of the drafters are Mechanical?9%
3
In the graph above, what percent represents the total architectural, electrical, and civil drafters?
78%
4
Circle graphs are used to display the relationship among parts of a whole.
Unlock Deck
Unlock for access to all 10 flashcards in this deck.
Unlock Deck
k this deck
5
In the graph above, which type of drafter has the most employees?
Unlock Deck
Unlock for access to all 10 flashcards in this deck.
Unlock Deck
k this deck
6
In the graph above, which type of drafter has the least employees?
Unlock Deck
Unlock for access to all 10 flashcards in this deck.
Unlock Deck
k this deck
7
In the graph above, how many projects were completed for all the years represented in the graph (2005 through 2011)?
Unlock Deck
Unlock for access to all 10 flashcards in this deck.
Unlock Deck
k this deck
8
Bar graphs and line graphs are most often used to compare relationships between two sets of data.
Unlock Deck
Unlock for access to all 10 flashcards in this deck.
Unlock Deck
k this deck
9
In the graph above, between which two years was there the biggest drop in completed projects?
Unlock Deck
Unlock for access to all 10 flashcards in this deck.
Unlock Deck
k this deck
10
Use the following graph for problems 8 through 10. This graph represents the number of hours by month spent by company XYZ on special projects. In the graph above, which year had the least completed projects?
In the graph above, which year had the least completed projects? Unlock Deck
Unlock for access to all 10 flashcards in this deck.
Unlock Deck
k this deck
Unlock Deck
Unlock for access to all 10 flashcards in this deck.


