Deck 13: They Protect Eagles, Dont They: Using Health Disparity Research to Tell New Stories - Case Study I
Full screen (f)
Question
Question
Question
Correctly reading data table is important. Table 13.1 has been included below. Please answer questions using this table.

-Which of the following statement or statements is/are true?
A) The State of South Dakota had a life expectancy that was above the mean at birth for the country as a whole.
B) The State of Nevada has a life expectancy that exceeded the 2014 mean for the country as a whole.
C) The State of Illinois had a life expectancy that exceeded the 2014 mean for the country as a whole.
D) Neither a, b, nor c
E) a, b, and c are correct
Question
Correctly reading data table is important. Table 13.1 has been included below. Please answer questions using this table.
-No state in the country in 2014 had a life expectancy that did not fit in the range of 74.91 - 81.15.
-No state in the country in 2014 had a life expectancy that did not fit in the range of 74.91 - 81.15.
Question
Correctly reading data table is important. Table 13.1 has been included below. Please answer questions using this table.
-When one analyzes the data in Table 13.1, it reveals that there is a possibility that a Disparity Chain which began before the War Between the States may have continued in a way that affects life expectancy today. What patterns in Table 13.1 would support the described thesis?
A) There is nothing in the Table that can be used to support such a thesis.
B) The Table reveals disparities in life expectancy between Southern and Northern states since a greater proportion of southern states had live expectancies below the mean for the country in 2014.
C) The thesis is unsupported because southern states are also represented among those states with the highest life expectancy.
D) Too little information exists regarding the north and south's history to speculate on this hypothesis.
Question
Question
Referring to Table 13.2 below, please answer the following question: In 2014, which statement or statements regarding life expectancy disparities were true:
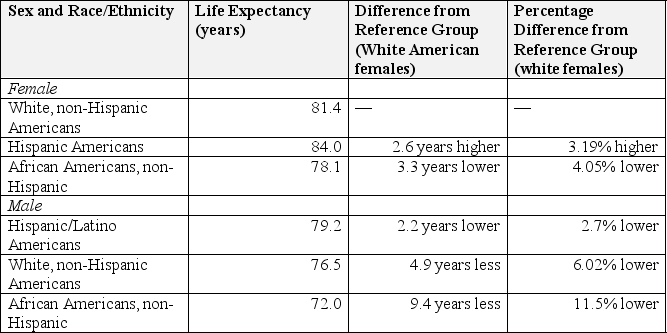
A) The subgroup in the United States with the highest life expectancy at birth in 2014 was Latino females.
B) If a female was passionate regarding having a life expectancy that was the closest possible with the male she married, the sex and race/ethnicity match that would result in the lowest mean disparity between potential death rates would be a Latino American male and an African American, non-Latino female.
C) White, non-Hispanic American males, on average died at a rate that was 5.67% lower than a White, non-Hispanic female
D) a and b
E) b and c
F) a, b and c
G) None of the above
Question
Please use table 13.3 below
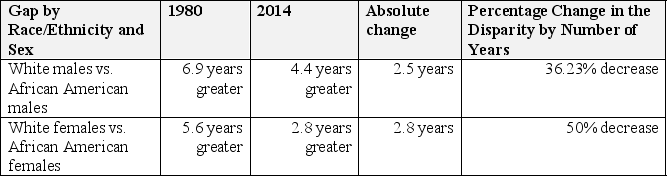
-Based upon Table 13.3., which statement or statements below are correct:
A) In 1980, the disparity in life expectancy at birth was greater between males of European descent and those of African descent than was the case for their female counterparts.
B) The male/female disparity by race/ethnicity closed the most between females from 1980 to 2014.
C) Both a and b
D) None of the above
Question
Please use table 13.3 below
-The disparity in life expectancy actually decreased in absolute years between 1980 and 2014.
-The disparity in life expectancy actually decreased in absolute years between 1980 and 2014.
Question
Disparities can be further disaggregated in order to identify areas of need that may be under-addressed. Table 13.4 presents data on death rates per 100,000 by age, race/ethnicity, and sex for 2013. Please refer to Table 13.4 for any questions that contain data from this table. These questions assess your competencies in correctly reading, analyzing and evaluating data on life expectancy disparities.

-Across all ages, race/ethnicities, and sexes, which statement or statements is/are true based upon Table 13.4?
A) The death rates disparity per 100,000 was 4.31% higher for females than for males
B) The death rate disparity for White American males was 2.24% higher than for White American females
C) the death rate disparity for African American females was 13.5% higher than for African American males
D) The death rates for Native American females was 19.6% higher than for Native American males
E) The death rates of Asian/Pacific Islander Americans females was 16.8% higher than for their male counterparts.
Question
Disparities can be further disaggregated in order to identify areas of need that may be under-addressed. Table 13.4 presents data on death rates per 100,000 by age, race/ethnicity, and sex for 2013. Please refer to Table 13.4 for any questions that contain data from this table. These questions assess your competencies in correctly reading, analyzing and evaluating data on life expectancy disparities.
-The male/female death rates at age <1 is highest for which group:
A) White Americans
B) African Americans
C) American Indian/Alaskan Native Americans
D) Asian/Pacific Islander American
-The male/female death rates at age <1 is highest for which group:
A) White Americans
B) African Americans
C) American Indian/Alaskan Native Americans
D) Asian/Pacific Islander American
Question
Disparities can be further disaggregated in order to identify areas of need that may be under-addressed. Table 13.4 presents data on death rates per 100,000 by age, race/ethnicity, and sex for 2013. Please refer to Table 13.4 for any questions that contain data from this table. These questions assess your competencies in correctly reading, analyzing and evaluating data on life expectancy disparities.
-The male/female death rates at age <1 is lowest for which group:
A) White Americans
B) African Americans
C) American Indian/Alaskan Native Americans
D) Asian/Pacific Islander American
-The male/female death rates at age <1 is lowest for which group:
A) White Americans
B) African Americans
C) American Indian/Alaskan Native Americans
D) Asian/Pacific Islander American
Question
Disparities can be further disaggregated in order to identify areas of need that may be under-addressed. Table 13.4 presents data on death rates per 100,000 by age, race/ethnicity, and sex for 2013. Please refer to Table 13.4 for any questions that contain data from this table. These questions assess your competencies in correctly reading, analyzing and evaluating data on life expectancy disparities.
-The data in Table 13.4 reveal that mean death rates per 100,000 in the United States are higher at age <1 than in any other category under age 55.
-The data in Table 13.4 reveal that mean death rates per 100,000 in the United States are higher at age <1 than in any other category under age 55.
Question
Disparities can be further disaggregated in order to identify areas of need that may be under-addressed. Table 13.4 presents data on death rates per 100,000 by age, race/ethnicity, and sex for 2013. Please refer to Table 13.4 for any questions that contain data from this table. These questions assess your competencies in correctly reading, analyzing and evaluating data on life expectancy disparities.
-According to the data in Table 13.4, in 2013 extreme disparity existed in death rates per 100,000 for children under age 1 and all other children for which subgroup or subgroups listed below?
A) White American males and females
B) African American males and females
C) American Indian/Alaskan Native Americans
D) Asian/Pacific Islander Americans
E) This question cannot be answered based on Table 13.4
Question
Disparities can be further disaggregated in order to identify areas of need that may be under-addressed. Table 13.4 presents data on death rates per 100,000 by age, race/ethnicity, and sex for 2013. Please refer to Table 13.4 for any questions that contain data from this table. These questions assess your competencies in correctly reading, analyzing and evaluating data on life expectancy disparities.
-Infant mortality rates are normally cited per 1,000 while death rates in general are cited per 100,000. Based upon your analysis and/or evaluation of this practice, which statement below could be inferred by stating either infant mortality rates and/or death rates for children under 1 as number per 1,000?
A) The public will not truly notice the age disparate needs of children under age 1
B) The public will be less alarmed by the rate per 1,000 than by the rate per 100,000
C) If the public is less alarmed, however, less attention will be directed towards decreasing death rates per 100,000
D) a, b and c
E) Neither a, b, nor c
Question
Disparities can be further disaggregated in order to identify areas of need that may be under-addressed. Table 13.4 presents data on death rates per 100,000 by age, race/ethnicity, and sex for 2013. Please refer to Table 13.4 for any questions that contain data from this table. These questions assess your competencies in correctly reading, analyzing and evaluating data on life expectancy disparities.
-Based upon your analysis of the data in Table 13.4, the percentage increase in death rates per 100,000 increases from the age bracket of 10-14 to the age bracket of 15-19. Which statement or statements listed below is/are true regarding this increase. The mean death rate of males increased by:
A) 3.869%
B) 386.95%
C) 286.95%
D) None of the above
Question
Disparities can be further disaggregated in order to identify areas of need that may be under-addressed. Table 13.4 presents data on death rates per 100,000 by age, race/ethnicity, and sex for 2013. Please refer to Table 13.4 for any questions that contain data from this table. These questions assess your competencies in correctly reading, analyzing and evaluating data on life expectancy disparities.
-The mean death rates for females increased by:
A) 67%
B) 167%
C) 1.67%
D) None of the above
-The mean death rates for females increased by:
A) 67%
B) 167%
C) 1.67%
D) None of the above
Question
Disparities can be further disaggregated in order to identify areas of need that may be under-addressed. Table 13.4 presents data on death rates per 100,000 by age, race/ethnicity, and sex for 2013. Please refer to Table 13.4 for any questions that contain data from this table. These questions assess your competencies in correctly reading, analyzing and evaluating data on life expectancy disparities.
-Stated differently, the change in the death rate for males is ___% greater than the change in the death rate of females.
A) 328.2%
B) 428.2%
C) 28.2%
D) 319.95%
E) 219.95%
F) None of the above
-Stated differently, the change in the death rate for males is ___% greater than the change in the death rate of females.
A) 328.2%
B) 428.2%
C) 28.2%
D) 319.95%
E) 219.95%
F) None of the above
Question
Disparities can be further disaggregated in order to identify areas of need that may be under-addressed. Table 13.4 presents data on death rates per 100,000 by age, race/ethnicity, and sex for 2013. Please refer to Table 13.4 for any questions that contain data from this table. These questions assess your competencies in correctly reading, analyzing and evaluating data on life expectancy disparities.
-Based upon the use of the simple percentage difference with reference group computations, we uncovered a crisis in life expectancy that is being paid too little attention by health care professionals. This largely unacknowledged crisis is that:
A) The subgroup of males ages 15-19 are in a midst of a disparate crisis of sheer survival
B) While increases in death rates occur for both males and females as they transition from the age categories 10-14 to the age category 15-19, the crisis disproportionately affects males.
C) The title of this chapter, "They Protect Eagles, Don't They" suggests that parents, educators, policymakers, and health care professionals may wish to immediately begin implementing measures to decrease this disparity.
D) All of the above
E) None of the above
Question
Disparities can be further disaggregated in order to identify areas of need that may be under-addressed. Table 13.4 presents data on death rates per 100,000 by age, race/ethnicity, and sex for 2013. Please refer to Table 13.4 for any questions that contain data from this table. These questions assess your competencies in correctly reading, analyzing and evaluating data on life expectancy disparities.
-The extreme disparities ratio in the death rates of males vs females of all races/ethnicities changes to ____ between the 15-19 age groups and the 20-29 age groups.
A) 93.9% vs. 67%
B) 193.9% vs. 167%
C) .939% vs. .67%
D) None of the above
-The extreme disparities ratio in the death rates of males vs females of all races/ethnicities changes to ____ between the 15-19 age groups and the 20-29 age groups.
A) 93.9% vs. 67%
B) 193.9% vs. 167%
C) .939% vs. .67%
D) None of the above
Question
Disparities can be further disaggregated in order to identify areas of need that may be under-addressed. Table 13.4 presents data on death rates per 100,000 by age, race/ethnicity, and sex for 2013. Please refer to Table 13.4 for any questions that contain data from this table. These questions assess your competencies in correctly reading, analyzing and evaluating data on life expectancy disparities.
-By age 25-29, the death rate of all males is 241.3% as high as that of all females.
-By age 25-29, the death rate of all males is 241.3% as high as that of all females.
Question
Disparities can be further disaggregated in order to identify areas of need that may be under-addressed. Table 13.4 presents data on death rates per 100,000 by age, race/ethnicity, and sex for 2013. Please refer to Table 13.4 for any questions that contain data from this table. These questions assess your competencies in correctly reading, analyzing and evaluating data on life expectancy disparities.
-When the disparities in death rates are disaggregated by race/ethnicity and sex, which statement or statements below are true for the 25-29 age bracket?
A) The death rate for Asians/Pacific Islanders males age 25-29 is 153.3% higher than for their female counterparts
B) The comparable rate for African American males age 25-29 is 167.1% higher than for their female counterparts
C) The comparable rate for American Indian/Alaskan Native males age 25-29 is 94.37% higher than for their female counterparts.
D) The comparable rate for White American males age 25-29 is 136.15% higher than for their female counterparts.
E) All of the above are true
F) a and b are true
G) b and e
H) All of the above are true
I) None of the above are true
Question
Disparities can be further disaggregated in order to identify areas of need that may be under-addressed. Table 13.4 presents data on death rates per 100,000 by age, race/ethnicity, and sex for 2013. Please refer to Table 13.4 for any questions that contain data from this table. These questions assess your competencies in correctly reading, analyzing and evaluating data on life expectancy disparities.
-The male/female death disparities are lowest between males and females of all races/ethnicities in which age group below:
A) 15-19
B) 20-24
C) 40-44
D) ≥85
E) All of the above age groups have male/female disparities that exceed 25%
-The male/female death disparities are lowest between males and females of all races/ethnicities in which age group below:
A) 15-19
B) 20-24
C) 40-44
D) ≥85
E) All of the above age groups have male/female disparities that exceed 25%
Question
Disparities can be further disaggregated in order to identify areas of need that may be under-addressed. Table 13.4 presents data on death rates per 100,000 by age, race/ethnicity, and sex for 2013. Please refer to Table 13.4 for any questions that contain data from this table. These questions assess your competencies in correctly reading, analyzing and evaluating data on life expectancy disparities.
-Based upon this analysis, we may tentatively conclude that in some respects adverse male health disparities have been:
A) Highlighted by health care professionals more than female health disparities but not addressed as a health disparity matter
B) Subordinated by those of females
C) Equally addressed
D) None of the above
Question
Disparities can be further disaggregated in order to identify areas of need that may be under-addressed. Table 13.4 presents data on death rates per 100,000 by age, race/ethnicity, and sex for 2013. Please refer to Table 13.4 for any questions that contain data from this table. These questions assess your competencies in correctly reading, analyzing and evaluating data on life expectancy disparities.
-An article by Choy (2015) argues that America's top 50 highest ranked hospitals:
A) Had established an equal number of male and female clinics
B) Had established a greater percent of male clinics
C) Were closing down male and female clinics
D) Had established a larger proportion of female clinics
-An article by Choy (2015) argues that America's top 50 highest ranked hospitals:
A) Had established an equal number of male and female clinics
B) Had established a greater percent of male clinics
C) Were closing down male and female clinics
D) Had established a larger proportion of female clinics
Question
Disparities can be further disaggregated in order to identify areas of need that may be under-addressed. Table 13.4 presents data on death rates per 100,000 by age, race/ethnicity, and sex for 2013. Please refer to Table 13.4 for any questions that contain data from this table. These questions assess your competencies in correctly reading, analyzing and evaluating data on life expectancy disparities.
-Can you see that this application of percent difference with reference group allowed a new story to be told?
A) Definitely
B) Somewhat
C) Not fully
D) Not at all
-Can you see that this application of percent difference with reference group allowed a new story to be told?
A) Definitely
B) Somewhat
C) Not fully
D) Not at all
Question
Disparities can be further disaggregated in order to identify areas of need that may be under-addressed. Table 13.4 presents data on death rates per 100,000 by age, race/ethnicity, and sex for 2013. Please refer to Table 13.4 for any questions that contain data from this table. These questions assess your competencies in correctly reading, analyzing and evaluating data on life expectancy disparities.
-What is the approximate life expectancy for all the states in the country.
A) 79.1 years
B) 89.1 years
C) 78.11 years
D) 91.8 years
E) None of the above
-What is the approximate life expectancy for all the states in the country.
A) 79.1 years
B) 89.1 years
C) 78.11 years
D) 91.8 years
E) None of the above
Question
Disparities can be further disaggregated in order to identify areas of need that may be under-addressed. Table 13.4 presents data on death rates per 100,000 by age, race/ethnicity, and sex for 2013. Please refer to Table 13.4 for any questions that contain data from this table. These questions assess your competencies in correctly reading, analyzing and evaluating data on life expectancy disparities.
-According to the text, which two areas of the country have the highest and lowest life expectancies respectively:
A) Maui County, Hawaii and Owsley County, Kentucky
B) Summit County, Colorado and Oglala Lakota County of South Dakota
C) Caledonia County, Vermont and Union County, Florida
D) Hennepin County, Minnesota and Hinds County, Mississippi
E) None of the above
Question
Disparities can be further disaggregated in order to identify areas of need that may be under-addressed. Table 13.4 presents data on death rates per 100,000 by age, race/ethnicity, and sex for 2013. Please refer to Table 13.4 for any questions that contain data from this table. These questions assess your competencies in correctly reading, analyzing and evaluating data on life expectancy disparities.
-What is the definition of transdisciplinary that is presented in the text.
A) An approach to knowledge in which one discipline and/or issues in one discipline are viewed from the perspective of another
B) An approach to a subject that involves two or more fields within the same discipline and/or two or more disciplines
C) An approach where the theories, methods, and concepts of one discipline are neither merged nor viewed from the perspective of another discipline
D) None of the above
Question
Disparities can be further disaggregated in order to identify areas of need that may be under-addressed. Table 13.4 presents data on death rates per 100,000 by age, race/ethnicity, and sex for 2013. Please refer to Table 13.4 for any questions that contain data from this table. These questions assess your competencies in correctly reading, analyzing and evaluating data on life expectancy disparities.
-A group of physician assistants, physicians, statisticians and others gather to discuss the alarming rise in infant death rates in their county. They are discussing possible interventions that may be used in the community. What approach are they using:
A) cross-disciplinary
B) interdisciplinary
C) multidisciplinary
D) transdisciplinary
Question
Disparities can be further disaggregated in order to identify areas of need that may be under-addressed. Table 13.4 presents data on death rates per 100,000 by age, race/ethnicity, and sex for 2013. Please refer to Table 13.4 for any questions that contain data from this table. These questions assess your competencies in correctly reading, analyzing and evaluating data on life expectancy disparities.
-The text discusses the crisis of early death disparities among young males in the country. Which of the following statement(s) is/are true.
A) The group with the highest death rates among males age 15-29 is African Americans.
B) The group with the second highest death rates among males is Asians.
C) The group with the second highest death rates among males is American Indian/Alaskan Native Americans
D) A White American male is 250% more likely to die than a White female
E) a & b only
F) a & c only
D) a & d only
E) b & d only
F) None of the above
Question
Disparities can be further disaggregated in order to identify areas of need that may be under-addressed. Table 13.4 presents data on death rates per 100,000 by age, race/ethnicity, and sex for 2013. Please refer to Table 13.4 for any questions that contain data from this table. These questions assess your competencies in correctly reading, analyzing and evaluating data on life expectancy disparities.
-Which step(s) listed below is/are steps on how to interpret tabular data:
A) Look at the unit of measurement of the data.
B) Read any notes attached to the data.
C) Examine overall patterns in the data and describe what those patterns mean.
D) Read the labels going downward so that the labels for each row can be correctly identified.
E) All of the above
F) None of the above
Question
Disparities can be further disaggregated in order to identify areas of need that may be under-addressed. Table 13.4 presents data on death rates per 100,000 by age, race/ethnicity, and sex for 2013. Please refer to Table 13.4 for any questions that contain data from this table. These questions assess your competencies in correctly reading, analyzing and evaluating data on life expectancy disparities.
-The purpose of this chapter is to:
A) Introduce future health care administrators and others to the steps required to gather and interpret data.
B) To introduce simple statistical tools that can be used by health care administrators and others.
C) To recommend that current health disparity frameworks be "retooled" in order to be more effective in addressing health disparities in the United States.
D) To draw attention to the high death rates of our country's young males.
E) All of the above
F) None of the above
Question
Disparities can be further disaggregated in order to identify areas of need that may be under-addressed. Table 13.4 presents data on death rates per 100,000 by age, race/ethnicity, and sex for 2013. Please refer to Table 13.4 for any questions that contain data from this table. These questions assess your competencies in correctly reading, analyzing and evaluating data on life expectancy disparities.
-The age data in some tables is listed in 4-year intervals. This is referred to as _____ data.
A) arbitrary
B) age-specific
C) age-appropriate
D) narrow
E) None of the above
-The age data in some tables is listed in 4-year intervals. This is referred to as _____ data.
A) arbitrary
B) age-specific
C) age-appropriate
D) narrow
E) None of the above
Question
Disparities can be further disaggregated in order to identify areas of need that may be under-addressed. Table 13.4 presents data on death rates per 100,000 by age, race/ethnicity, and sex for 2013. Please refer to Table 13.4 for any questions that contain data from this table. These questions assess your competencies in correctly reading, analyzing and evaluating data on life expectancy disparities.
-According to the text, the linkages between health disparities and healthcare disparities are undefined and nonlinear:
-According to the text, the linkages between health disparities and healthcare disparities are undefined and nonlinear:

Unlock Deck
Sign up to unlock the cards in this deck!
Unlock Deck
Unlock Deck
1/35
Play
Full screen (f)
Deck 13: They Protect Eagles, Dont They: Using Health Disparity Research to Tell New Stories - Case Study I
1
Chapter 13 introduces several definitions of life expectancy. The one finally adopted by the authors most closely matched which source below
A) Merriam Webster's Learner's definition
B) Collins Dictionary's definition
C) Dictionary.com
D) None of the above
E) All of the above
A) Merriam Webster's Learner's definition
B) Collins Dictionary's definition
C) Dictionary.com
D) None of the above
E) All of the above
A
2
Based upon the text, in 2014, the year upon which this case study is based, which statement or statements below is/are true?
A) Mean life expectancy in the U.S. had further increased by 2014
B) Mean life expectancy in the U.S. had remained constant
C) Mean life expectancy had decreased
D) This was not discussed in this test
A) Mean life expectancy in the U.S. had further increased by 2014
B) Mean life expectancy in the U.S. had remained constant
C) Mean life expectancy had decreased
D) This was not discussed in this test
C
3
Correctly reading data table is important. Table 13.1 has been included below. Please answer questions using this table.
-Which of the following statement or statements is/are true?
A) The State of South Dakota had a life expectancy that was above the mean at birth for the country as a whole.
B) The State of Nevada has a life expectancy that exceeded the 2014 mean for the country as a whole.
C) The State of Illinois had a life expectancy that exceeded the 2014 mean for the country as a whole.
D) Neither a, b, nor c
E) a, b, and c are correct
A
4
Correctly reading data table is important. Table 13.1 has been included below. Please answer questions using this table.
-No state in the country in 2014 had a life expectancy that did not fit in the range of 74.91 - 81.15.
-No state in the country in 2014 had a life expectancy that did not fit in the range of 74.91 - 81.15.
Unlock Deck
Unlock for access to all 35 flashcards in this deck.
Unlock Deck
k this deck
5
Correctly reading data table is important. Table 13.1 has been included below. Please answer questions using this table.
-When one analyzes the data in Table 13.1, it reveals that there is a possibility that a Disparity Chain which began before the War Between the States may have continued in a way that affects life expectancy today. What patterns in Table 13.1 would support the described thesis?
A) There is nothing in the Table that can be used to support such a thesis.
B) The Table reveals disparities in life expectancy between Southern and Northern states since a greater proportion of southern states had live expectancies below the mean for the country in 2014.
C) The thesis is unsupported because southern states are also represented among those states with the highest life expectancy.
D) Too little information exists regarding the north and south's history to speculate on this hypothesis.
Unlock Deck
Unlock for access to all 35 flashcards in this deck.
Unlock Deck
k this deck
6
Based upon the research cited in the text by Dwyer-Lindgren et al. (2017) regarding life expectancy in the United States, which statements listed below are true:
A) The greatest difference in life expectancy in 2014 or birth within the United States by state was 6+ years.
B) Life expectancy across the country's 4,142 counties reveal a similar disparity between counties.
C) The greatest life expectancy between counties is more than three times the disparity that exists between the states with the highest and lowest life expectancy.
D) The disparities in life expectancy between counties do not exceed ten years when the subpopulation of interest is White Americans.
E) a and b
F) b and c
G) c and d
H) a, c and d
I) b, c, and d
J) a, b, c and d
K) None of the above
Unlock Deck
Unlock for access to all 35 flashcards in this deck.
Unlock Deck
k this deck
7
Referring to Table 13.2 below, please answer the following question: In 2014, which statement or statements regarding life expectancy disparities were true:
A) The subgroup in the United States with the highest life expectancy at birth in 2014 was Latino females.
B) If a female was passionate regarding having a life expectancy that was the closest possible with the male she married, the sex and race/ethnicity match that would result in the lowest mean disparity between potential death rates would be a Latino American male and an African American, non-Latino female.
C) White, non-Hispanic American males, on average died at a rate that was 5.67% lower than a White, non-Hispanic female
D) a and b
E) b and c
F) a, b and c
G) None of the above
Unlock Deck
Unlock for access to all 35 flashcards in this deck.
Unlock Deck
k this deck
8
Please use table 13.3 below
-Based upon Table 13.3., which statement or statements below are correct:
A) In 1980, the disparity in life expectancy at birth was greater between males of European descent and those of African descent than was the case for their female counterparts.
B) The male/female disparity by race/ethnicity closed the most between females from 1980 to 2014.
C) Both a and b
D) None of the above
Unlock Deck
Unlock for access to all 35 flashcards in this deck.
Unlock Deck
k this deck
9
Please use table 13.3 below
-The disparity in life expectancy actually decreased in absolute years between 1980 and 2014.
-The disparity in life expectancy actually decreased in absolute years between 1980 and 2014.
Unlock Deck
Unlock for access to all 35 flashcards in this deck.
Unlock Deck
k this deck
10
Disparities can be further disaggregated in order to identify areas of need that may be under-addressed. Table 13.4 presents data on death rates per 100,000 by age, race/ethnicity, and sex for 2013. Please refer to Table 13.4 for any questions that contain data from this table. These questions assess your competencies in correctly reading, analyzing and evaluating data on life expectancy disparities.
-Across all ages, race/ethnicities, and sexes, which statement or statements is/are true based upon Table 13.4?
A) The death rates disparity per 100,000 was 4.31% higher for females than for males
B) The death rate disparity for White American males was 2.24% higher than for White American females
C) the death rate disparity for African American females was 13.5% higher than for African American males
D) The death rates for Native American females was 19.6% higher than for Native American males
E) The death rates of Asian/Pacific Islander Americans females was 16.8% higher than for their male counterparts.
Unlock Deck
Unlock for access to all 35 flashcards in this deck.
Unlock Deck
k this deck
11
Disparities can be further disaggregated in order to identify areas of need that may be under-addressed. Table 13.4 presents data on death rates per 100,000 by age, race/ethnicity, and sex for 2013. Please refer to Table 13.4 for any questions that contain data from this table. These questions assess your competencies in correctly reading, analyzing and evaluating data on life expectancy disparities.
-The male/female death rates at age <1 is highest for which group:
A) White Americans
B) African Americans
C) American Indian/Alaskan Native Americans
D) Asian/Pacific Islander American
-The male/female death rates at age <1 is highest for which group:
A) White Americans
B) African Americans
C) American Indian/Alaskan Native Americans
D) Asian/Pacific Islander American
Unlock Deck
Unlock for access to all 35 flashcards in this deck.
Unlock Deck
k this deck
12
Disparities can be further disaggregated in order to identify areas of need that may be under-addressed. Table 13.4 presents data on death rates per 100,000 by age, race/ethnicity, and sex for 2013. Please refer to Table 13.4 for any questions that contain data from this table. These questions assess your competencies in correctly reading, analyzing and evaluating data on life expectancy disparities.
-The male/female death rates at age <1 is lowest for which group:
A) White Americans
B) African Americans
C) American Indian/Alaskan Native Americans
D) Asian/Pacific Islander American
-The male/female death rates at age <1 is lowest for which group:
A) White Americans
B) African Americans
C) American Indian/Alaskan Native Americans
D) Asian/Pacific Islander American
Unlock Deck
Unlock for access to all 35 flashcards in this deck.
Unlock Deck
k this deck
13
Disparities can be further disaggregated in order to identify areas of need that may be under-addressed. Table 13.4 presents data on death rates per 100,000 by age, race/ethnicity, and sex for 2013. Please refer to Table 13.4 for any questions that contain data from this table. These questions assess your competencies in correctly reading, analyzing and evaluating data on life expectancy disparities.
-The data in Table 13.4 reveal that mean death rates per 100,000 in the United States are higher at age <1 than in any other category under age 55.
-The data in Table 13.4 reveal that mean death rates per 100,000 in the United States are higher at age <1 than in any other category under age 55.
Unlock Deck
Unlock for access to all 35 flashcards in this deck.
Unlock Deck
k this deck
14
Disparities can be further disaggregated in order to identify areas of need that may be under-addressed. Table 13.4 presents data on death rates per 100,000 by age, race/ethnicity, and sex for 2013. Please refer to Table 13.4 for any questions that contain data from this table. These questions assess your competencies in correctly reading, analyzing and evaluating data on life expectancy disparities.
-According to the data in Table 13.4, in 2013 extreme disparity existed in death rates per 100,000 for children under age 1 and all other children for which subgroup or subgroups listed below?
A) White American males and females
B) African American males and females
C) American Indian/Alaskan Native Americans
D) Asian/Pacific Islander Americans
E) This question cannot be answered based on Table 13.4
Unlock Deck
Unlock for access to all 35 flashcards in this deck.
Unlock Deck
k this deck
15
Disparities can be further disaggregated in order to identify areas of need that may be under-addressed. Table 13.4 presents data on death rates per 100,000 by age, race/ethnicity, and sex for 2013. Please refer to Table 13.4 for any questions that contain data from this table. These questions assess your competencies in correctly reading, analyzing and evaluating data on life expectancy disparities.
-Infant mortality rates are normally cited per 1,000 while death rates in general are cited per 100,000. Based upon your analysis and/or evaluation of this practice, which statement below could be inferred by stating either infant mortality rates and/or death rates for children under 1 as number per 1,000?
A) The public will not truly notice the age disparate needs of children under age 1
B) The public will be less alarmed by the rate per 1,000 than by the rate per 100,000
C) If the public is less alarmed, however, less attention will be directed towards decreasing death rates per 100,000
D) a, b and c
E) Neither a, b, nor c
Unlock Deck
Unlock for access to all 35 flashcards in this deck.
Unlock Deck
k this deck
16
Disparities can be further disaggregated in order to identify areas of need that may be under-addressed. Table 13.4 presents data on death rates per 100,000 by age, race/ethnicity, and sex for 2013. Please refer to Table 13.4 for any questions that contain data from this table. These questions assess your competencies in correctly reading, analyzing and evaluating data on life expectancy disparities.
-Based upon your analysis of the data in Table 13.4, the percentage increase in death rates per 100,000 increases from the age bracket of 10-14 to the age bracket of 15-19. Which statement or statements listed below is/are true regarding this increase. The mean death rate of males increased by:
A) 3.869%
B) 386.95%
C) 286.95%
D) None of the above
Unlock Deck
Unlock for access to all 35 flashcards in this deck.
Unlock Deck
k this deck
17
Disparities can be further disaggregated in order to identify areas of need that may be under-addressed. Table 13.4 presents data on death rates per 100,000 by age, race/ethnicity, and sex for 2013. Please refer to Table 13.4 for any questions that contain data from this table. These questions assess your competencies in correctly reading, analyzing and evaluating data on life expectancy disparities.
-The mean death rates for females increased by:
A) 67%
B) 167%
C) 1.67%
D) None of the above
-The mean death rates for females increased by:
A) 67%
B) 167%
C) 1.67%
D) None of the above
Unlock Deck
Unlock for access to all 35 flashcards in this deck.
Unlock Deck
k this deck
18
Disparities can be further disaggregated in order to identify areas of need that may be under-addressed. Table 13.4 presents data on death rates per 100,000 by age, race/ethnicity, and sex for 2013. Please refer to Table 13.4 for any questions that contain data from this table. These questions assess your competencies in correctly reading, analyzing and evaluating data on life expectancy disparities.
-Stated differently, the change in the death rate for males is ___% greater than the change in the death rate of females.
A) 328.2%
B) 428.2%
C) 28.2%
D) 319.95%
E) 219.95%
F) None of the above
-Stated differently, the change in the death rate for males is ___% greater than the change in the death rate of females.
A) 328.2%
B) 428.2%
C) 28.2%
D) 319.95%
E) 219.95%
F) None of the above
Unlock Deck
Unlock for access to all 35 flashcards in this deck.
Unlock Deck
k this deck
19
Disparities can be further disaggregated in order to identify areas of need that may be under-addressed. Table 13.4 presents data on death rates per 100,000 by age, race/ethnicity, and sex for 2013. Please refer to Table 13.4 for any questions that contain data from this table. These questions assess your competencies in correctly reading, analyzing and evaluating data on life expectancy disparities.
-Based upon the use of the simple percentage difference with reference group computations, we uncovered a crisis in life expectancy that is being paid too little attention by health care professionals. This largely unacknowledged crisis is that:
A) The subgroup of males ages 15-19 are in a midst of a disparate crisis of sheer survival
B) While increases in death rates occur for both males and females as they transition from the age categories 10-14 to the age category 15-19, the crisis disproportionately affects males.
C) The title of this chapter, "They Protect Eagles, Don't They" suggests that parents, educators, policymakers, and health care professionals may wish to immediately begin implementing measures to decrease this disparity.
D) All of the above
E) None of the above
Unlock Deck
Unlock for access to all 35 flashcards in this deck.
Unlock Deck
k this deck
20
Disparities can be further disaggregated in order to identify areas of need that may be under-addressed. Table 13.4 presents data on death rates per 100,000 by age, race/ethnicity, and sex for 2013. Please refer to Table 13.4 for any questions that contain data from this table. These questions assess your competencies in correctly reading, analyzing and evaluating data on life expectancy disparities.
-The extreme disparities ratio in the death rates of males vs females of all races/ethnicities changes to ____ between the 15-19 age groups and the 20-29 age groups.
A) 93.9% vs. 67%
B) 193.9% vs. 167%
C) .939% vs. .67%
D) None of the above
-The extreme disparities ratio in the death rates of males vs females of all races/ethnicities changes to ____ between the 15-19 age groups and the 20-29 age groups.
A) 93.9% vs. 67%
B) 193.9% vs. 167%
C) .939% vs. .67%
D) None of the above
Unlock Deck
Unlock for access to all 35 flashcards in this deck.
Unlock Deck
k this deck
21
Disparities can be further disaggregated in order to identify areas of need that may be under-addressed. Table 13.4 presents data on death rates per 100,000 by age, race/ethnicity, and sex for 2013. Please refer to Table 13.4 for any questions that contain data from this table. These questions assess your competencies in correctly reading, analyzing and evaluating data on life expectancy disparities.
-By age 25-29, the death rate of all males is 241.3% as high as that of all females.
-By age 25-29, the death rate of all males is 241.3% as high as that of all females.
Unlock Deck
Unlock for access to all 35 flashcards in this deck.
Unlock Deck
k this deck
22
Disparities can be further disaggregated in order to identify areas of need that may be under-addressed. Table 13.4 presents data on death rates per 100,000 by age, race/ethnicity, and sex for 2013. Please refer to Table 13.4 for any questions that contain data from this table. These questions assess your competencies in correctly reading, analyzing and evaluating data on life expectancy disparities.
-When the disparities in death rates are disaggregated by race/ethnicity and sex, which statement or statements below are true for the 25-29 age bracket?
A) The death rate for Asians/Pacific Islanders males age 25-29 is 153.3% higher than for their female counterparts
B) The comparable rate for African American males age 25-29 is 167.1% higher than for their female counterparts
C) The comparable rate for American Indian/Alaskan Native males age 25-29 is 94.37% higher than for their female counterparts.
D) The comparable rate for White American males age 25-29 is 136.15% higher than for their female counterparts.
E) All of the above are true
F) a and b are true
G) b and e
H) All of the above are true
I) None of the above are true
Unlock Deck
Unlock for access to all 35 flashcards in this deck.
Unlock Deck
k this deck
23
Disparities can be further disaggregated in order to identify areas of need that may be under-addressed. Table 13.4 presents data on death rates per 100,000 by age, race/ethnicity, and sex for 2013. Please refer to Table 13.4 for any questions that contain data from this table. These questions assess your competencies in correctly reading, analyzing and evaluating data on life expectancy disparities.
-The male/female death disparities are lowest between males and females of all races/ethnicities in which age group below:
A) 15-19
B) 20-24
C) 40-44
D) ≥85
E) All of the above age groups have male/female disparities that exceed 25%
-The male/female death disparities are lowest between males and females of all races/ethnicities in which age group below:
A) 15-19
B) 20-24
C) 40-44
D) ≥85
E) All of the above age groups have male/female disparities that exceed 25%
Unlock Deck
Unlock for access to all 35 flashcards in this deck.
Unlock Deck
k this deck
24
Disparities can be further disaggregated in order to identify areas of need that may be under-addressed. Table 13.4 presents data on death rates per 100,000 by age, race/ethnicity, and sex for 2013. Please refer to Table 13.4 for any questions that contain data from this table. These questions assess your competencies in correctly reading, analyzing and evaluating data on life expectancy disparities.
-Based upon this analysis, we may tentatively conclude that in some respects adverse male health disparities have been:
A) Highlighted by health care professionals more than female health disparities but not addressed as a health disparity matter
B) Subordinated by those of females
C) Equally addressed
D) None of the above
Unlock Deck
Unlock for access to all 35 flashcards in this deck.
Unlock Deck
k this deck
25
Disparities can be further disaggregated in order to identify areas of need that may be under-addressed. Table 13.4 presents data on death rates per 100,000 by age, race/ethnicity, and sex for 2013. Please refer to Table 13.4 for any questions that contain data from this table. These questions assess your competencies in correctly reading, analyzing and evaluating data on life expectancy disparities.
-An article by Choy (2015) argues that America's top 50 highest ranked hospitals:
A) Had established an equal number of male and female clinics
B) Had established a greater percent of male clinics
C) Were closing down male and female clinics
D) Had established a larger proportion of female clinics
-An article by Choy (2015) argues that America's top 50 highest ranked hospitals:
A) Had established an equal number of male and female clinics
B) Had established a greater percent of male clinics
C) Were closing down male and female clinics
D) Had established a larger proportion of female clinics
Unlock Deck
Unlock for access to all 35 flashcards in this deck.
Unlock Deck
k this deck
26
Disparities can be further disaggregated in order to identify areas of need that may be under-addressed. Table 13.4 presents data on death rates per 100,000 by age, race/ethnicity, and sex for 2013. Please refer to Table 13.4 for any questions that contain data from this table. These questions assess your competencies in correctly reading, analyzing and evaluating data on life expectancy disparities.
-Can you see that this application of percent difference with reference group allowed a new story to be told?
A) Definitely
B) Somewhat
C) Not fully
D) Not at all
-Can you see that this application of percent difference with reference group allowed a new story to be told?
A) Definitely
B) Somewhat
C) Not fully
D) Not at all
Unlock Deck
Unlock for access to all 35 flashcards in this deck.
Unlock Deck
k this deck
27
Disparities can be further disaggregated in order to identify areas of need that may be under-addressed. Table 13.4 presents data on death rates per 100,000 by age, race/ethnicity, and sex for 2013. Please refer to Table 13.4 for any questions that contain data from this table. These questions assess your competencies in correctly reading, analyzing and evaluating data on life expectancy disparities.
-What is the approximate life expectancy for all the states in the country.
A) 79.1 years
B) 89.1 years
C) 78.11 years
D) 91.8 years
E) None of the above
-What is the approximate life expectancy for all the states in the country.
A) 79.1 years
B) 89.1 years
C) 78.11 years
D) 91.8 years
E) None of the above
Unlock Deck
Unlock for access to all 35 flashcards in this deck.
Unlock Deck
k this deck
28
Disparities can be further disaggregated in order to identify areas of need that may be under-addressed. Table 13.4 presents data on death rates per 100,000 by age, race/ethnicity, and sex for 2013. Please refer to Table 13.4 for any questions that contain data from this table. These questions assess your competencies in correctly reading, analyzing and evaluating data on life expectancy disparities.
-According to the text, which two areas of the country have the highest and lowest life expectancies respectively:
A) Maui County, Hawaii and Owsley County, Kentucky
B) Summit County, Colorado and Oglala Lakota County of South Dakota
C) Caledonia County, Vermont and Union County, Florida
D) Hennepin County, Minnesota and Hinds County, Mississippi
E) None of the above
Unlock Deck
Unlock for access to all 35 flashcards in this deck.
Unlock Deck
k this deck
29
Disparities can be further disaggregated in order to identify areas of need that may be under-addressed. Table 13.4 presents data on death rates per 100,000 by age, race/ethnicity, and sex for 2013. Please refer to Table 13.4 for any questions that contain data from this table. These questions assess your competencies in correctly reading, analyzing and evaluating data on life expectancy disparities.
-What is the definition of transdisciplinary that is presented in the text.
A) An approach to knowledge in which one discipline and/or issues in one discipline are viewed from the perspective of another
B) An approach to a subject that involves two or more fields within the same discipline and/or two or more disciplines
C) An approach where the theories, methods, and concepts of one discipline are neither merged nor viewed from the perspective of another discipline
D) None of the above
Unlock Deck
Unlock for access to all 35 flashcards in this deck.
Unlock Deck
k this deck
30
Disparities can be further disaggregated in order to identify areas of need that may be under-addressed. Table 13.4 presents data on death rates per 100,000 by age, race/ethnicity, and sex for 2013. Please refer to Table 13.4 for any questions that contain data from this table. These questions assess your competencies in correctly reading, analyzing and evaluating data on life expectancy disparities.
-A group of physician assistants, physicians, statisticians and others gather to discuss the alarming rise in infant death rates in their county. They are discussing possible interventions that may be used in the community. What approach are they using:
A) cross-disciplinary
B) interdisciplinary
C) multidisciplinary
D) transdisciplinary
Unlock Deck
Unlock for access to all 35 flashcards in this deck.
Unlock Deck
k this deck
31
Disparities can be further disaggregated in order to identify areas of need that may be under-addressed. Table 13.4 presents data on death rates per 100,000 by age, race/ethnicity, and sex for 2013. Please refer to Table 13.4 for any questions that contain data from this table. These questions assess your competencies in correctly reading, analyzing and evaluating data on life expectancy disparities.
-The text discusses the crisis of early death disparities among young males in the country. Which of the following statement(s) is/are true.
A) The group with the highest death rates among males age 15-29 is African Americans.
B) The group with the second highest death rates among males is Asians.
C) The group with the second highest death rates among males is American Indian/Alaskan Native Americans
D) A White American male is 250% more likely to die than a White female
E) a & b only
F) a & c only
D) a & d only
E) b & d only
F) None of the above
Unlock Deck
Unlock for access to all 35 flashcards in this deck.
Unlock Deck
k this deck
32
Disparities can be further disaggregated in order to identify areas of need that may be under-addressed. Table 13.4 presents data on death rates per 100,000 by age, race/ethnicity, and sex for 2013. Please refer to Table 13.4 for any questions that contain data from this table. These questions assess your competencies in correctly reading, analyzing and evaluating data on life expectancy disparities.
-Which step(s) listed below is/are steps on how to interpret tabular data:
A) Look at the unit of measurement of the data.
B) Read any notes attached to the data.
C) Examine overall patterns in the data and describe what those patterns mean.
D) Read the labels going downward so that the labels for each row can be correctly identified.
E) All of the above
F) None of the above
Unlock Deck
Unlock for access to all 35 flashcards in this deck.
Unlock Deck
k this deck
33
Disparities can be further disaggregated in order to identify areas of need that may be under-addressed. Table 13.4 presents data on death rates per 100,000 by age, race/ethnicity, and sex for 2013. Please refer to Table 13.4 for any questions that contain data from this table. These questions assess your competencies in correctly reading, analyzing and evaluating data on life expectancy disparities.
-The purpose of this chapter is to:
A) Introduce future health care administrators and others to the steps required to gather and interpret data.
B) To introduce simple statistical tools that can be used by health care administrators and others.
C) To recommend that current health disparity frameworks be "retooled" in order to be more effective in addressing health disparities in the United States.
D) To draw attention to the high death rates of our country's young males.
E) All of the above
F) None of the above
Unlock Deck
Unlock for access to all 35 flashcards in this deck.
Unlock Deck
k this deck
34
Disparities can be further disaggregated in order to identify areas of need that may be under-addressed. Table 13.4 presents data on death rates per 100,000 by age, race/ethnicity, and sex for 2013. Please refer to Table 13.4 for any questions that contain data from this table. These questions assess your competencies in correctly reading, analyzing and evaluating data on life expectancy disparities.
-The age data in some tables is listed in 4-year intervals. This is referred to as _____ data.
A) arbitrary
B) age-specific
C) age-appropriate
D) narrow
E) None of the above
-The age data in some tables is listed in 4-year intervals. This is referred to as _____ data.
A) arbitrary
B) age-specific
C) age-appropriate
D) narrow
E) None of the above
Unlock Deck
Unlock for access to all 35 flashcards in this deck.
Unlock Deck
k this deck
35
Disparities can be further disaggregated in order to identify areas of need that may be under-addressed. Table 13.4 presents data on death rates per 100,000 by age, race/ethnicity, and sex for 2013. Please refer to Table 13.4 for any questions that contain data from this table. These questions assess your competencies in correctly reading, analyzing and evaluating data on life expectancy disparities.
-According to the text, the linkages between health disparities and healthcare disparities are undefined and nonlinear:
-According to the text, the linkages between health disparities and healthcare disparities are undefined and nonlinear:
Unlock Deck
Unlock for access to all 35 flashcards in this deck.
Unlock Deck
k this deck
Unlock Deck
Unlock for access to all 35 flashcards in this deck.


