Deck 19: International Trade and Finance
Full screen (f)
Question
Question
Question
Question
Question
Question
Question
Question
Question
Question
Question
Question
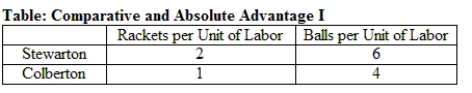
Refer to the table Comparative and Absolute Advantage I. The table summarizes the amount of tennis rackets and tennis balls that can be produced per unit of labor in Stewarton and Colberton. The opportunity cost of producing tennis rackets in Stewarton is:

A) one-half ball.
B) one-third ball.
C) two balls.
D) three balls.
A) one-half ball.
B) one-third ball.
C) two balls.
D) three balls.
Question
Refer to the table Comparative and Absolute Advantage I. The table summarizes the amount of tennis rackets and tennis balls that can be produced per unit of labor in Stewarton and Colberton. The opportunity cost of producing tennis balls in Stewarton is:

A) one-half racket.
B) one-third racket.
C) two rackets.
D) three rackets.
A) one-half racket.
B) one-third racket.
C) two rackets.
D) three rackets.
Question
Refer to the table Comparative and Absolute Advantage I. The table summarizes the amount of tennis rackets and tennis balls that can be produced per unit of labor in Stewarton and Colberton. The opportunity cost of producing tennis rackets in Colberton is:

A) one-quarter ball.
B) one-half ball.
C) one ball.
D) four balls.
A) one-quarter ball.
B) one-half ball.
C) one ball.
D) four balls.
Question
Refer to the table Comparative and Absolute Advantage I. The table summarizes the amount of tennis rackets and tennis balls that can be produced per unit of labor in Stewarton and Colberton. The opportunity cost of producing tennis balls in Colberton is:

A) one-quarter racket.
B) one-half racket.
C) one racket.
D) four rackets.
A) one-quarter racket.
B) one-half racket.
C) one racket.
D) four rackets.
Question
Refer to the table Comparative and Absolute Advantage I. The table summarizes the amount of tennis rackets and tennis balls that can be produced per unit of labor in Stewarton and Colberton. If both countries have the same amount of labor, then it can be concluded that Colberton has _____ advantage in producing:
A) a comparative; rackets.
B) an absolute; rackets.
C) a comparative; balls.
D) an absolute; balls.
A) a comparative; rackets.
B) an absolute; rackets.
C) a comparative; balls.
D) an absolute; balls.
Question
Refer to the table Comparative and Absolute Advantage I. The table summarizes the amount of tennis rackets and tennis balls that can be produced per unit of labor in Stewarton and Colberton. If both countries have the same amount of labor, then it can be concluded that Colberton has a comparative advantage in producing _____ and has an absolute advantage in:

A) balls; balls.
B) balls; neither good.
C) rackets; rackets.
D) rackets; neither good.
A) balls; balls.
B) balls; neither good.
C) rackets; rackets.
D) rackets; neither good.
Question
Refer to the table Comparative and Absolute Advantage I. The table summarizes the amount of tennis rackets and tennis balls that can be produced per unit of labor in Stewarton and Colberton. If both countries have the same amount of labor, then it can be concluded that Stewarton has a comparative advantage in producing _____ and has an absolute advantage in producing:

A) balls; neither good.
B) balls; both goods.
C) rackets; neither goods.
D) rackets; both goods.
A) balls; neither good.
B) balls; both goods.
C) rackets; neither goods.
D) rackets; both goods.
Question
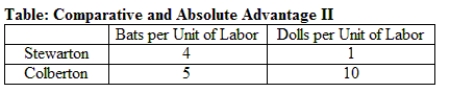
Refer to the table Comparative and Absolute Advantage II. The table summarizes the amount of baseball bats and bobblehead dolls that can be produced per unit of labor in Stewarton and Colberton. The opportunity cost of producing bats in Stewarton is:

A) one-quarter doll.
B) one-half doll.
C) one doll.
D) four dolls.
A) one-quarter doll.
B) one-half doll.
C) one doll.
D) four dolls.
Question
Refer to the table Comparative and Absolute Advantage II. The table summarizes the amount of baseball bats and bobblehead dolls that can be produced per unit of labor in Stewarton and Colberton. The opportunity cost of producing dolls in Stewarton is:

A) one-quarter bat.
B) one-half bat.
C) one bat.
D) four bats.
A) one-quarter bat.
B) one-half bat.
C) one bat.
D) four bats.
Question
Refer to the table Comparative and Absolute Advantage II. The table summarizes the amount of baseball bats and bobblehead dolls that can be produced per unit of labor in Stewarton and Colberton. The opportunity cost of producing bats in Colberton is:

A) one-half doll.
B) one doll.
C) two dolls.
D) four dolls.
A) one-half doll.
B) one doll.
C) two dolls.
D) four dolls.
Question
Refer to the table Comparative and Absolute Advantage II. The table summarizes the amount of baseball bats and bobblehead dolls that can be produced per unit of labor in Stewarton and Colberton. The opportunity cost of producing dolls in Colberton is:

A) one-half bat.
B) one bat.
C) two bats.
D) four bats.
A) one-half bat.
B) one bat.
C) two bats.
D) four bats.
Question
Refer to the table Comparative and Absolute Advantage II. The table summarizes the amount of baseball bats and bobblehead dolls that can be produced per unit of labor in Stewarton and Colberton. If both countries have the same amount of labor, then it can be concluded that Stewarton has _____ advantage in producing:

A) a comparative; dolls.
B) an absolute; dolls.
C) a comparative; bats.
D) an absolute; bats.
A) a comparative; dolls.
B) an absolute; dolls.
C) a comparative; bats.
D) an absolute; bats.
Question
Refer to the table Comparative and Absolute Advantage II. The table summarizes the amount of baseball bats and bobblehead dolls that can be produced per unit of labor in Stewarton and Colberton. If both countries have the same amount of labor, then it can be concluded that Stewarton has a comparative advantage in producing _____ and has an absolute advantage in:

A) dolls; bats.
B) dolls; neither good.
C) bats; dolls.
D) bats; neither good.
A) dolls; bats.
B) dolls; neither good.
C) bats; dolls.
D) bats; neither good.
Question
Refer to the table Comparative and Absolute Advantage II. The table summarizes the amount of baseball bats and bobblehead dolls that can be produced per unit of labor in Stewarton and Colberton. If both countries have the same amount of labor, then it can be concluded that Colberton has a comparative advantage in producing _____ and has an absolute advantage in producing:
A) bats; neither good.
B) bats; both goods.
C) dolls; neither good.
D) dolls; both goods.
A) bats; neither good.
B) bats; both goods.
C) dolls; neither good.
D) dolls; both goods.
Question
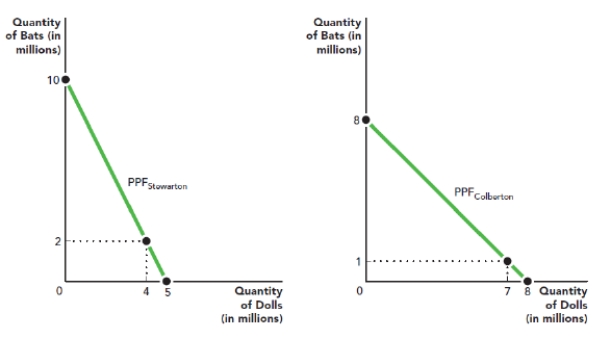
Refer to the figure PPF and Comparative Advantage. The figure shows the production possibility frontier for producing baseball bats and bobblehead dolls in Stewarton and Colberton. The opportunity cost of producing dolls in Stewarton is:
Figure: PPF and Comparative Advantage

A) two bats.
B) one bat.
C) one-half bat.
D) one-quarter bat.
Figure: PPF and Comparative Advantage
A) two bats.
B) one bat.
C) one-half bat.
D) one-quarter bat.
Question
Refer to the figure PPF and Comparative Advantage. The figure shows the production possibility frontier for producing baseball bats and bobblehead dolls in Stewarton and Colberton. The opportunity cost of producing bats in Stewarton is:
Figure: PPF and Comparative Advantage

A) two dolls.
B) one doll.
C) one-half doll.
D) one-quarter doll.
Figure: PPF and Comparative Advantage
A) two dolls.
B) one doll.
C) one-half doll.
D) one-quarter doll.
Question
Refer to the figure PPF and Comparative Advantage. The figure shows the production possibility frontier for producing baseball bats and bobblehead dolls in Stewarton and Colberton. The opportunity cost of producing dolls in Colberton is:
Figure: PPF and Comparative Advantage

A) one-half bat.
B) one bat.
C) two bats.
D) four bats.
Figure: PPF and Comparative Advantage
A) one-half bat.
B) one bat.
C) two bats.
D) four bats.
Question
Refer to the figure PPF and Comparative Advantage. The figure shows the production possibility frontier for producing baseball bats and bobblehead dolls in Stewarton and Colberton. The opportunity cost of producing bats in Colberton is:
Figure: PPF and Comparative Advantage
A) one-half doll.
B) one doll.
C) two dolls.
D) four dolls.
Figure: PPF and Comparative Advantage
A) one-half doll.
B) one doll.
C) two dolls.
D) four dolls.
Question
Refer to the figure PPF and Comparative Advantage. The figure shows the production possibility frontier for producing baseball bats and bobblehead dolls in Stewarton and Colberton. If both countries have identical resources, then Stewarton has a comparative advantage in producing_____ and has an absolute advantage in:
Figure: PPF and Comparative Advantage

A) bats; bats.
B) dolls; both goods.
C) dolls; dolls.
D) bats; both goods.
Figure: PPF and Comparative Advantage
A) bats; bats.
B) dolls; both goods.
C) dolls; dolls.
D) bats; both goods.
Question
Refer to the figure PPF and Comparative Advantage. The figure shows the production possibility frontier for producing baseball bats and bobblehead dolls in Stewarton and Colberton. If both countries have identical resources, then Colberton has a comparative advantage in producing_____ and has an absolute advantage in:
Figure: PPF and Comparative Advantage

A) bats; bats.
B) dolls; neither good.
C) dolls; dolls.
D) bats; neither good.
Figure: PPF and Comparative Advantage
A) bats; bats.
B) dolls; neither good.
C) dolls; dolls.
D) bats; neither good.
Question
Question
Question
Question
Question
Question
Question
Question
Question
Question
Question
Question
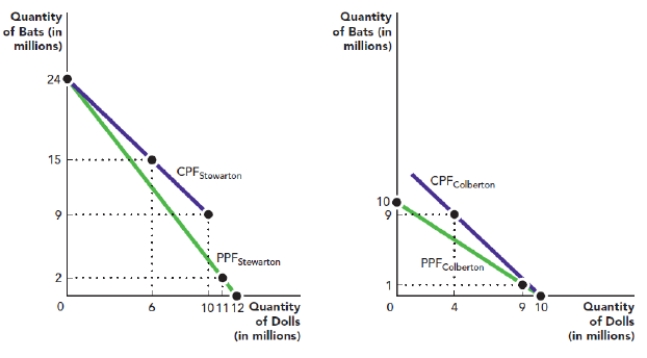
Refer to the figure Mutually Beneficial Trade I. The figure shows the production possibility frontier (PPF) and the consumption possibility frontier (CPF) for baseball bats and bobblehead dolls in Stewarton and Colberton. Based on the figure, the opportunity cost of producing one doll in Stewarton is:
Figure: Mutually Beneficial Trade I

A) one baseball bat.
B) two baseball bats.
C) one-half baseball bat.
D) one-quarter baseball bat.
Figure: Mutually Beneficial Trade I
A) one baseball bat.
B) two baseball bats.
C) one-half baseball bat.
D) one-quarter baseball bat.
Question
Refer to the figure Mutually Beneficial Trade I. The figure shows the production possibility frontier (PPF) and consumption possibility frontier (CPF) for baseball bats and bobblehead dolls in Stewarton and Colberton. Based on the figure, the opportunity cost of producing bats in Stewarton is:
Figure: Mutually Beneficial Trade I

A) one doll.
B) two dolls.
C) one-half doll.
D) one-quarter doll.
Figure: Mutually Beneficial Trade I
A) one doll.
B) two dolls.
C) one-half doll.
D) one-quarter doll.
Question
Refer to the figure Mutually Beneficial Trade I. The figure shows the production possibility frontier (PPF) and consumption possibility frontier (CPF) for baseball bats and bobblehead dolls in Stewarton and Colberton. Based on the figure, the opportunity cost of producing one doll in Colberton is:
Figure: Mutually Beneficial Trade I

A) one baseball bat.
B) two baseball bats.
C) one-half baseball bat.
D) one-quarter baseball bat.
Figure: Mutually Beneficial Trade I
A) one baseball bat.
B) two baseball bats.
C) one-half baseball bat.
D) one-quarter baseball bat.
Question
Refer to the figure Mutually Beneficial Trade I. The figure shows the production possibility frontier (PPF) and consumption possibility frontier (CPF) for baseball bats and bobblehead dolls in Stewarton and Colberton. Based on the figure, the opportunity cost of producing one bat in Colberton is:
Figure: Mutually Beneficial Trade I

A) one doll.
B) two dolls.
C) one-half doll.
D) one-quarter doll.
Figure: Mutually Beneficial Trade I
A) one doll.
B) two dolls.
C) one-half doll.
D) one-quarter doll.
Question
Refer to the figure Mutually Beneficial Trade I. The figure shows the production possibility frontier (PPF) and consumption possibility frontier (CPF) for baseball bats and bobblehead dolls in Stewarton and Colberton. In the absence of trade, if Stewarton is consuming 6 million dolls, then it can consume _____ million hats.
Figure: Mutually Beneficial Trade I

A) 6
B) 9
C) 12
D) 15
Figure: Mutually Beneficial Trade I
A) 6
B) 9
C) 12
D) 15
Question
Refer to the figure Mutually Beneficial Trade I. The figure shows the production possibility frontier (PPF) and consumption possibility frontier (CPF) for baseball bats and bobblehead dolls in Stewarton and Colberton. In the absence of trade, if Colberton is consuming 4 million dolls, then it can consume _____ million bats.
Figure: Mutually Beneficial Trade I

A) 2
B) 4
C) 6
D) 9
Figure: Mutually Beneficial Trade I
A) 2
B) 4
C) 6
D) 9
Question
Refer to the figure Mutually Beneficial Trade I. The figure shows the production possibility frontier (PPF) and consumption possibility frontier (CPF) for baseball bats and bobblehead dolls in Stewarton and Colberton. Based on the figure, we can conclude that the terms of trade is _____ for each bobblehead doll.
Figure: Mutually Beneficial Trade I

A) one-half baseball bat
B) one baseball bat
C) one and one-half baseball bats
D) two baseball bats
Figure: Mutually Beneficial Trade I
A) one-half baseball bat
B) one baseball bat
C) one and one-half baseball bats
D) two baseball bats
Question
Refer to the figure Mutually Beneficial Trade I. The figure shows the production possibility frontier (PPF) and consumption possibility frontier (CPF) for baseball bats and bobblehead dolls in Stewarton and Colberton. If both countries have identical resources, then Colberton has a comparative advantage in _____ and has an absolute advantage in:
Figure: Mutually Beneficial Trade I
A) dolls; dolls.
B) dolls; neither good.
C) bats; bats.
D) bats; neither good.
Figure: Mutually Beneficial Trade I
A) dolls; dolls.
B) dolls; neither good.
C) bats; bats.
D) bats; neither good.
Question
Refer to the figure Mutually Beneficial Trade I. The figure shows the production possibility frontier (PPF) and consumption possibility frontier (CPF) for baseball bats and bobblehead dolls in Stewarton and Colberton. If both countries have identical resources, then Stewarton has a comparative advantage in _____ and has an absolute advantage in:
Figure: Mutually Beneficial Trade I

A) dolls; dolls.
B) dolls; both goods.
C) bats; bats.
D) bats; both goods.
Figure: Mutually Beneficial Trade I
A) dolls; dolls.
B) dolls; both goods.
C) bats; bats.
D) bats; both goods.
Question
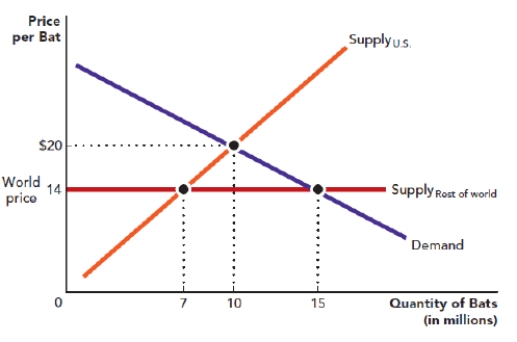
Refer to the figure Free Trade and Imports. The figure shows the demand, U.S. supply, and world supply curves for baseball bats. In the absence of trade, the equilibrium price will be _____, and the equilibrium quantity will be _____ million bats.
Figure: Free Trade and Imports

A) $14; 10
B) $20; 10
C) $14; 15
D) $20; 15
Figure: Free Trade and Imports
A) $14; 10
B) $20; 10
C) $14; 15
D) $20; 15
Question
Refer to the figure Free Trade and Imports. The figure shows the U.S. demand, U.S. supply, and world supply curves for baseball bats. With free trade, the consumers will purchase _____ million bats, of which _____ million will be supplied domestically.
Figure: Free Trade and Imports

A) 10; 7
B) 15; 10
C) 7; 7
D) 15; 7
Figure: Free Trade and Imports
A) 10; 7
B) 15; 10
C) 7; 7
D) 15; 7
Question
Refer to the figure Free Trade and Imports. The figure shows the U.S. demand, U.S. supply, and world supply curves for baseball bats. With free trade, the consumers will purchase _____ million bats, of which _____ million will be imported from the rest of the world.
Figure: Free Trade and Imports
A) 10; 7
B) 15; 7
C) 10; 8
D) 15; 8
Figure: Free Trade and Imports
A) 10; 7
B) 15; 7
C) 10; 8
D) 15; 8
Question
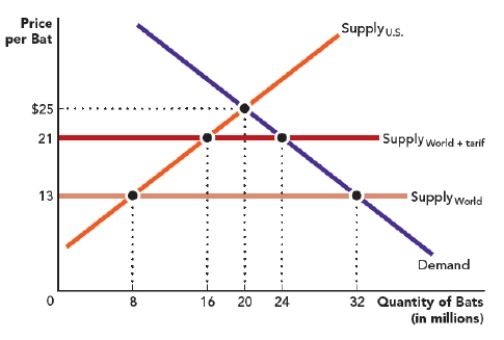
Refer to the figure Import Tariffs. The figure shows the U.S. demand, U.S. supply, and world supply curves for baseball bats. In the absence of trade, the equilibrium price of bats will be _____, and the equilibrium quantity will be _____ million bats.
Figure: Import Tariffs

A) $13; 20
B) $21; 24
C) $25; 20
D) $13; 32
Figure: Import Tariffs
A) $13; 20
B) $21; 24
C) $25; 20
D) $13; 32
Question
Refer to the figure Import Tariffs. The figure shows the U.S. demand, U.S. supply, and world supply curve for baseball bats. With free trade and no tariffs, the consumers will purchase _____ million bats, of which _____ million will be supplied domestically.
Figure: Import Tariffs

A) 32; 8
B) 20; 16
C) 32; 24
D) 20; 12
Figure: Import Tariffs
A) 32; 8
B) 20; 16
C) 32; 24
D) 20; 12
Question
Refer to the figure Import Tariffs. The figure shows the U.S. demand, U.S. supply, and world supply curves for baseball bats. With free trade and no tariffs, the consumers will purchase_____ million bats, of which _____ million will be imported from the rest of the world.
Figure: Import Tariffs

A) 32; 8
B) 32; 24
C) 20; 12
D) 20; 4
Figure: Import Tariffs
A) 32; 8
B) 32; 24
C) 20; 12
D) 20; 4
Question
Refer to the figure Import Tariffs. The figure shows the U.S. demand, U.S. supply, and world supply curves for baseball bats. If the United States imposes a $8 tariff on imports, then the price paid by consumers will be _____, and consumers will purchase _____ million bats.
Figure: Import Tariffs

A) $21; 16
B) $25; 16
C) $21; 24
D) $25; 24
Figure: Import Tariffs
A) $21; 16
B) $25; 16
C) $21; 24
D) $25; 24
Question
Refer to the figure Import Tariffs. The figure shows the U.S. demand, U.S. supply, and world supply curves for baseball bats. If the United States imposes a $8 tariff on imports, then the consumers will purchase _____ million bats, of which _____ million will be supplied domestically.
Figure: Import Tariffs

A) 20; 16
B) 20; 20
C) 24; 16
D) 24; 20
Figure: Import Tariffs
A) 20; 16
B) 20; 20
C) 24; 16
D) 24; 20
Question
Refer to the figure Import Tariffs. The figure shows the U.S. demand, U.S. supply, and world supply curves for baseball bats. If the United States imposes a $8 tariff on imports, then the consumers will buy _____ million bats, of which _____ million will be imported from the rest of the world.
Figure: Import Tariffs

A) 24; 8
B) 32; 8
C) 32; 4
D) 24; 4
Figure: Import Tariffs
A) 24; 8
B) 32; 8
C) 32; 4
D) 24; 4
Question
Refer to the figure Import Tariffs. The figure shows the demand, U.S. supply, and world supply curves for baseball bats. If the United States imposes a $8 tariff on imports, then the government's revenue from the tariff is _____ million.
Figure: Import Tariffs
A) $8
B) $16
C) $32
D) $64
Figure: Import Tariffs
A) $8
B) $16
C) $32
D) $64
Question
Question
Question
Question
Question
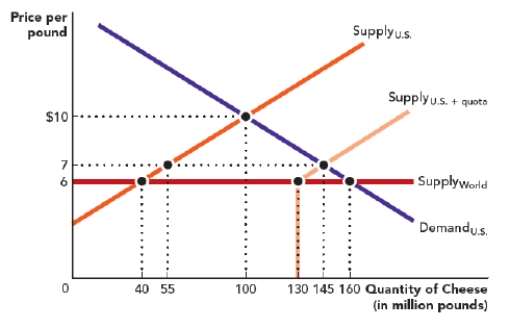
Refer to the figure Import Quota. The figure shows the U.S. supply, world supply, and U.S. demand curve for cheese. In the absence of trade, the equilibrium quantity of cheese consumed will be ____ million pounds, and the equilibrium price will be _____ per pound.
Figure: Import Quota

A) 100; $6
B) 145; $7
C) 100; $10
D) 160; $6
Figure: Import Quota
A) 100; $6
B) 145; $7
C) 100; $10
D) 160; $6
Question
Refer to the figure Import Quota. The figure shows the U.S. supply, world supply, and U.S. demand curve for cheese. With free trade, the total quantity of cheese purchased will be _____ million pounds, out of which _____ million pounds will be imported.
Figure: Import Quota

A) 145; 90
B) 100; 45
C) 160; 120
D) 100; 60
Figure: Import Quota
A) 145; 90
B) 100; 45
C) 160; 120
D) 100; 60
Question
Refer to the figure Import Quota. The figure shows the U.S. supply, world supply, and U.S. demand curve for cheese. With free trade, the domestic supply of cheese will be _____ million pounds, and the total imports will be _____ million pounds.
Figure: Import Quota

A) 40; 60
B) 100; 60
C) 40; 120
D) 100; 30
Figure: Import Quota
A) 40; 60
B) 100; 60
C) 40; 120
D) 100; 30
Question
Refer to the figure Import Quota. The figure shows the U.S. supply, world supply, and U.S. demand curve for cheese. If the United States imposes a quota and the resulting equilibrium price is $7, then the total domestic supply of cheese will be _____ million pounds, and the total imports will be _____ million pounds.
Figure: Import Quota

A) 100; 45
B) 55; 90
C) 145; 30
D) 40; 80
Figure: Import Quota
A) 100; 45
B) 55; 90
C) 145; 30
D) 40; 80
Question
Refer to the figure Import Quota. The figure shows the U.S. supply, world supply, and U.S. demand curve for cheese. If the United States imposes a quota and the resulting equilibrium price is $7, then the total import quota is _____ million pounds.
Figure: Import Quota
A) 60
B) 90
C) 105
D) 120
Figure: Import Quota
A) 60
B) 90
C) 105
D) 120
Question
Refer to the figure Import Quota. The figure shows the U.S. supply, world supply, and U.S. demand curve for cheese. If the United States imposes a quota and the resulting equilibrium price is $7, then the total quantity of cheese purchased is _____ million pounds, out of which _____ million pounds are imported.
Figure: Import Quota

A) 100; 90
B) 145; 90
C) 130; 75
D) 145; 105
Figure: Import Quota
A) 100; 90
B) 145; 90
C) 130; 75
D) 145; 105
Question
Refer to the figure Import Quota. The figure shows the U.S. supply, world supply, and U.S. demand curve for cheese. If the United States imposes a quota of 90 million pounds on imports, then the resulting equilibrium price will be _____, and the total consumption of cheese will be _____ million pounds.
Figure: Import Quota

A) $6; 160
B) $6; 145
C) $7; 160
D) $7; 145
Figure: Import Quota
A) $6; 160
B) $6; 145
C) $7; 160
D) $7; 145
Question
Refer to the figure Import Quota. The figure shows the U.S. supply, world supply, and U.S. demand curve for cheese. If the United States imposes a quota of 90 million pounds on imports, then _____ million pounds of cheese will be supplied domestically.
Figure: Import Quota

A) 40
B) 55
C) 100
D) 130
Figure: Import Quota
A) 40
B) 55
C) 100
D) 130
Question
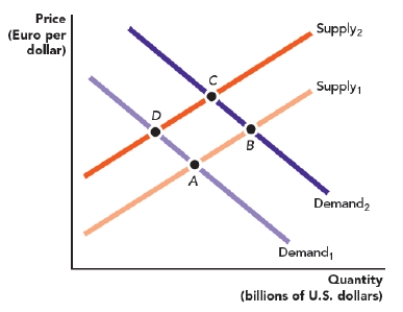
Refer to the figure Currency Appreciation and Depreciation. The figure shows the supply and demand of U.S. dollars in the euro-U.S. dollar foreign exchange market. A shift in the equilibrium from A to B implies that the U.S. dollar is _____ and the euro is:
Figure: Currency Appreciation and Depreciation

A) appreciating; appreciating.
B) appreciating; depreciating.
C) depreciating; appreciating.
D) depreciating; depreciating.
Figure: Currency Appreciation and Depreciation
A) appreciating; appreciating.
B) appreciating; depreciating.
C) depreciating; appreciating.
D) depreciating; depreciating.
Question
Refer to the figure Currency Appreciation and Depreciation. The figure shows the supply and demand of U.S. dollars in the euro-U.S. dollar foreign exchange market. A shift in the equilibrium from D to A implies that the U.S. dollar is _____ and the euro is:
Figure: Currency Appreciation and Depreciation

A) appreciating; not changing in value.
B) appreciating; depreciating.
C) depreciating; not changing in value.
D) depreciating; appreciating.
Figure: Currency Appreciation and Depreciation
A) appreciating; not changing in value.
B) appreciating; depreciating.
C) depreciating; not changing in value.
D) depreciating; appreciating.
Question
Refer to the figure Currency Appreciation and Depreciation. The figure shows the supply and demand of U.S. dollars in the euro-U.S. dollar foreign exchange market. A shift in the equilibrium from C to A implies that the U.S. dollar is _____ and the euro is:
Figure: Currency Appreciation and Depreciation

A) not changing in value; appreciating.
B) depreciating; appreciating.
C) not changing in value; depreciating.
D) appreciating; depreciating.
Figure: Currency Appreciation and Depreciation
A) not changing in value; appreciating.
B) depreciating; appreciating.
C) not changing in value; depreciating.
D) appreciating; depreciating.
Question
Refer to the figure Currency Appreciation and Depreciation. The figure shows the supply and demand of U.S. dollars in the euro-U.S. dollar foreign exchange market. A shift in the equilibrium from C to B implies that the U.S. dollar is _____ and the euro is:
Figure: Currency Appreciation and Depreciation

A) appreciating; appreciating.
B) appreciating; depreciating.
C) depreciating; appreciating.
D) depreciating; depreciating.
Figure: Currency Appreciation and Depreciation
A) appreciating; appreciating.
B) appreciating; depreciating.
C) depreciating; appreciating.
D) depreciating; depreciating.
Question
Refer to the figure Currency Appreciation and Depreciation. The figure shows the supply and demand of U.S. dollars in the euro-U.S. dollar foreign exchange market. A shift in the equilibrium from A to D implies that the U.S. dollar is _____ and the euro is:
Figure: Currency Appreciation and Depreciation
A) appreciating; not changing in value.
B) appreciating; depreciating.
C) depreciating; not changing in value.
D) depreciating; appreciating.
Figure: Currency Appreciation and Depreciation
A) appreciating; not changing in value.
B) appreciating; depreciating.
C) depreciating; not changing in value.
D) depreciating; appreciating.
Question
Refer to the figure Currency Appreciation and Depreciation. The figure shows the supply and demand of U.S. dollars in the euro-U.S. dollar foreign exchange market. Which of the following shifts in the equilibrium represents an appreciation in the U.S. dollar?
Figure: Currency Appreciation and Depreciation

A) C to A
B) D to A
C) A to B
D) B to A
Figure: Currency Appreciation and Depreciation
A) C to A
B) D to A
C) A to B
D) B to A
Question
Refer to the figure Currency Appreciation and Depreciation. The figure shows the supply and demand of U.S. dollars in the euro-U.S. dollar foreign exchange market. Which of the following shifts in the equilibrium represents a depreciation in the U.S. dollar?
Figure: Currency Appreciation and Depreciation

A) C to A
B) A to D
C) A to C
D) B to C
Figure: Currency Appreciation and Depreciation
A) C to A
B) A to D
C) A to C
D) B to C

Unlock Deck
Sign up to unlock the cards in this deck!
Unlock Deck
Unlock Deck
1/110
Play
Full screen (f)
Deck 19: International Trade and Finance
1
A country produces bread and cheese using only labor as input. The production possibility frontier of the country represents the:
A) amount of bread that can be produced using all the labor.
B) amount of cheese that can be produced using all the labor.
C) minimum amount of bread and cheese that can be produced using all the labor.
D) maximum amount of bread and cheese that can be produced using all the labor.
A) amount of bread that can be produced using all the labor.
B) amount of cheese that can be produced using all the labor.
C) minimum amount of bread and cheese that can be produced using all the labor.
D) maximum amount of bread and cheese that can be produced using all the labor.
D
2
A country produces bobblehead dolls and baseball bats using only labor as input. One unit of labor can produce four dolls or two bats, and the country has 100 units of labor. If the country is operating on its production possibility frontier (PPF) and producing 80 dolls, then how many bats is it producing?
A) 80 bats
B) 120 bats
C) 160 bats
D) 200 bats
A) 80 bats
B) 120 bats
C) 160 bats
D) 200 bats
C
3
A country produces bobblehead dolls and baseball bats using only labor as input. One unit of labor can produce four dolls or two bats, and the country has 100 units of labor. If the country is operating on its production possibility frontier (PPF) and producing 100 bats, then how many dolls is it producing?
A) 50 dolls
B) 100 dolls
C) 150 dolls
D) 200 dolls
A) 50 dolls
B) 100 dolls
C) 150 dolls
D) 200 dolls
D
4
A country produces bobblehead dolls and baseball bats using only labor as input. One unit of labor can produce four dolls or two bats. What is opportunity cost of producing bobblehead dolls?
A) one-half bat
B) one bat
C) one and one-half bats
D) two bats
A) one-half bat
B) one bat
C) one and one-half bats
D) two bats
Unlock Deck
Unlock for access to all 110 flashcards in this deck.
Unlock Deck
k this deck
5
A country produces bobblehead dolls and baseball bats using only labor as input. One unit of labor can produce four dolls or two bats. What is opportunity cost of producing baseball bats?
A) one-half doll
B) one doll
C) one and one-half dolls
D) two dolls
A) one-half doll
B) one doll
C) one and one-half dolls
D) two dolls
Unlock Deck
Unlock for access to all 110 flashcards in this deck.
Unlock Deck
k this deck
6
A country produces tennis rackets and tennis balls using only labor as input. One unit of labor can produce one tennis racket or four tennis balls, and the country has 200 units of labor. If the country uses all its labor to produce tennis rackets, then it can produce _____ rackets.
A) 200
B) 150
C) 100
D) 50
A) 200
B) 150
C) 100
D) 50
Unlock Deck
Unlock for access to all 110 flashcards in this deck.
Unlock Deck
k this deck
7
A country produces tennis rackets and tennis balls using only labor as input. One unit of labor can produce one tennis racket or four tennis balls, and the country has 200 units of labor. If the country uses all its labor to produce tennis balls, then it can produce _____ balls.
A) 200
B) 400
C) 600
D) 800
A) 200
B) 400
C) 600
D) 800
Unlock Deck
Unlock for access to all 110 flashcards in this deck.
Unlock Deck
k this deck
8
A country produces tennis rackets and tennis balls using only labor as input. One unit of labor can produce one tennis racket or four tennis balls, and the country has 200 units of labor. If the country is operating on its production possibility frontier (PPF) and producing 50 rackets, then how many balls is it producing?
A) 200 balls
B) 400 balls
C) 600 balls
D) 800 balls
A) 200 balls
B) 400 balls
C) 600 balls
D) 800 balls
Unlock Deck
Unlock for access to all 110 flashcards in this deck.
Unlock Deck
k this deck
9
A country produces tennis rackets and tennis balls using only labor as an input. One unit of labor can produce one tennis racket or four tennis balls, and the country has 200 units of labor. If the country is operating on its production possibility frontier (PPF) and producing 100 balls, then how many rackets is it producing?
A) 125 rackets
B) 150 rackets
C) 175 rackets
D) 200 rackets
A) 125 rackets
B) 150 rackets
C) 175 rackets
D) 200 rackets
Unlock Deck
Unlock for access to all 110 flashcards in this deck.
Unlock Deck
k this deck
10
A country produces tennis rackets and tennis balls using only labor as input. One unit of labor can produce one tennis racket or four tennis balls. What is the opportunity cost of producing a tennis racket?
A) one ball
B) two balls
C) three balls
D) four balls
A) one ball
B) two balls
C) three balls
D) four balls
Unlock Deck
Unlock for access to all 110 flashcards in this deck.
Unlock Deck
k this deck
11
A country produces tennis rackets and tennis balls using only labor as an input. One unit of labor can produce one tennis racket or four tennis balls. What is the opportunity cost of producing a tennis ball?
A) one-quarter racket
B) one-half racket
C) one racket
D) two rackets
A) one-quarter racket
B) one-half racket
C) one racket
D) two rackets
Unlock Deck
Unlock for access to all 110 flashcards in this deck.
Unlock Deck
k this deck
12
Refer to the table Comparative and Absolute Advantage I. The table summarizes the amount of tennis rackets and tennis balls that can be produced per unit of labor in Stewarton and Colberton. The opportunity cost of producing tennis rackets in Stewarton is:
A) one-half ball.
B) one-third ball.
C) two balls.
D) three balls.
A) one-half ball.
B) one-third ball.
C) two balls.
D) three balls.
Unlock Deck
Unlock for access to all 110 flashcards in this deck.
Unlock Deck
k this deck
13
Refer to the table Comparative and Absolute Advantage I. The table summarizes the amount of tennis rackets and tennis balls that can be produced per unit of labor in Stewarton and Colberton. The opportunity cost of producing tennis balls in Stewarton is:
A) one-half racket.
B) one-third racket.
C) two rackets.
D) three rackets.
A) one-half racket.
B) one-third racket.
C) two rackets.
D) three rackets.
Unlock Deck
Unlock for access to all 110 flashcards in this deck.
Unlock Deck
k this deck
14
Refer to the table Comparative and Absolute Advantage I. The table summarizes the amount of tennis rackets and tennis balls that can be produced per unit of labor in Stewarton and Colberton. The opportunity cost of producing tennis rackets in Colberton is:
A) one-quarter ball.
B) one-half ball.
C) one ball.
D) four balls.
A) one-quarter ball.
B) one-half ball.
C) one ball.
D) four balls.
Unlock Deck
Unlock for access to all 110 flashcards in this deck.
Unlock Deck
k this deck
15
Refer to the table Comparative and Absolute Advantage I. The table summarizes the amount of tennis rackets and tennis balls that can be produced per unit of labor in Stewarton and Colberton. The opportunity cost of producing tennis balls in Colberton is:
A) one-quarter racket.
B) one-half racket.
C) one racket.
D) four rackets.
A) one-quarter racket.
B) one-half racket.
C) one racket.
D) four rackets.
Unlock Deck
Unlock for access to all 110 flashcards in this deck.
Unlock Deck
k this deck
16
Refer to the table Comparative and Absolute Advantage I. The table summarizes the amount of tennis rackets and tennis balls that can be produced per unit of labor in Stewarton and Colberton. If both countries have the same amount of labor, then it can be concluded that Colberton has _____ advantage in producing:
A) a comparative; rackets.
B) an absolute; rackets.
C) a comparative; balls.
D) an absolute; balls.
A) a comparative; rackets.
B) an absolute; rackets.
C) a comparative; balls.
D) an absolute; balls.
Unlock Deck
Unlock for access to all 110 flashcards in this deck.
Unlock Deck
k this deck
17
Refer to the table Comparative and Absolute Advantage I. The table summarizes the amount of tennis rackets and tennis balls that can be produced per unit of labor in Stewarton and Colberton. If both countries have the same amount of labor, then it can be concluded that Colberton has a comparative advantage in producing _____ and has an absolute advantage in:
A) balls; balls.
B) balls; neither good.
C) rackets; rackets.
D) rackets; neither good.
A) balls; balls.
B) balls; neither good.
C) rackets; rackets.
D) rackets; neither good.
Unlock Deck
Unlock for access to all 110 flashcards in this deck.
Unlock Deck
k this deck
18
Refer to the table Comparative and Absolute Advantage I. The table summarizes the amount of tennis rackets and tennis balls that can be produced per unit of labor in Stewarton and Colberton. If both countries have the same amount of labor, then it can be concluded that Stewarton has a comparative advantage in producing _____ and has an absolute advantage in producing:
A) balls; neither good.
B) balls; both goods.
C) rackets; neither goods.
D) rackets; both goods.
A) balls; neither good.
B) balls; both goods.
C) rackets; neither goods.
D) rackets; both goods.
Unlock Deck
Unlock for access to all 110 flashcards in this deck.
Unlock Deck
k this deck
19
Refer to the table Comparative and Absolute Advantage II. The table summarizes the amount of baseball bats and bobblehead dolls that can be produced per unit of labor in Stewarton and Colberton. The opportunity cost of producing bats in Stewarton is:
A) one-quarter doll.
B) one-half doll.
C) one doll.
D) four dolls.
A) one-quarter doll.
B) one-half doll.
C) one doll.
D) four dolls.
Unlock Deck
Unlock for access to all 110 flashcards in this deck.
Unlock Deck
k this deck
20
Refer to the table Comparative and Absolute Advantage II. The table summarizes the amount of baseball bats and bobblehead dolls that can be produced per unit of labor in Stewarton and Colberton. The opportunity cost of producing dolls in Stewarton is:
A) one-quarter bat.
B) one-half bat.
C) one bat.
D) four bats.
A) one-quarter bat.
B) one-half bat.
C) one bat.
D) four bats.
Unlock Deck
Unlock for access to all 110 flashcards in this deck.
Unlock Deck
k this deck
21
Refer to the table Comparative and Absolute Advantage II. The table summarizes the amount of baseball bats and bobblehead dolls that can be produced per unit of labor in Stewarton and Colberton. The opportunity cost of producing bats in Colberton is:
A) one-half doll.
B) one doll.
C) two dolls.
D) four dolls.
A) one-half doll.
B) one doll.
C) two dolls.
D) four dolls.
Unlock Deck
Unlock for access to all 110 flashcards in this deck.
Unlock Deck
k this deck
22
Refer to the table Comparative and Absolute Advantage II. The table summarizes the amount of baseball bats and bobblehead dolls that can be produced per unit of labor in Stewarton and Colberton. The opportunity cost of producing dolls in Colberton is:
A) one-half bat.
B) one bat.
C) two bats.
D) four bats.
A) one-half bat.
B) one bat.
C) two bats.
D) four bats.
Unlock Deck
Unlock for access to all 110 flashcards in this deck.
Unlock Deck
k this deck
23
Refer to the table Comparative and Absolute Advantage II. The table summarizes the amount of baseball bats and bobblehead dolls that can be produced per unit of labor in Stewarton and Colberton. If both countries have the same amount of labor, then it can be concluded that Stewarton has _____ advantage in producing:
A) a comparative; dolls.
B) an absolute; dolls.
C) a comparative; bats.
D) an absolute; bats.
A) a comparative; dolls.
B) an absolute; dolls.
C) a comparative; bats.
D) an absolute; bats.
Unlock Deck
Unlock for access to all 110 flashcards in this deck.
Unlock Deck
k this deck
24
Refer to the table Comparative and Absolute Advantage II. The table summarizes the amount of baseball bats and bobblehead dolls that can be produced per unit of labor in Stewarton and Colberton. If both countries have the same amount of labor, then it can be concluded that Stewarton has a comparative advantage in producing _____ and has an absolute advantage in:
A) dolls; bats.
B) dolls; neither good.
C) bats; dolls.
D) bats; neither good.
A) dolls; bats.
B) dolls; neither good.
C) bats; dolls.
D) bats; neither good.
Unlock Deck
Unlock for access to all 110 flashcards in this deck.
Unlock Deck
k this deck
25
Refer to the table Comparative and Absolute Advantage II. The table summarizes the amount of baseball bats and bobblehead dolls that can be produced per unit of labor in Stewarton and Colberton. If both countries have the same amount of labor, then it can be concluded that Colberton has a comparative advantage in producing _____ and has an absolute advantage in producing:
A) bats; neither good.
B) bats; both goods.
C) dolls; neither good.
D) dolls; both goods.
A) bats; neither good.
B) bats; both goods.
C) dolls; neither good.
D) dolls; both goods.
Unlock Deck
Unlock for access to all 110 flashcards in this deck.
Unlock Deck
k this deck
26
Refer to the figure PPF and Comparative Advantage. The figure shows the production possibility frontier for producing baseball bats and bobblehead dolls in Stewarton and Colberton. The opportunity cost of producing dolls in Stewarton is:
Figure: PPF and Comparative Advantage
A) two bats.
B) one bat.
C) one-half bat.
D) one-quarter bat.
Figure: PPF and Comparative Advantage
A) two bats.
B) one bat.
C) one-half bat.
D) one-quarter bat.
Unlock Deck
Unlock for access to all 110 flashcards in this deck.
Unlock Deck
k this deck
27
Refer to the figure PPF and Comparative Advantage. The figure shows the production possibility frontier for producing baseball bats and bobblehead dolls in Stewarton and Colberton. The opportunity cost of producing bats in Stewarton is:
Figure: PPF and Comparative Advantage
A) two dolls.
B) one doll.
C) one-half doll.
D) one-quarter doll.
Figure: PPF and Comparative Advantage
A) two dolls.
B) one doll.
C) one-half doll.
D) one-quarter doll.
Unlock Deck
Unlock for access to all 110 flashcards in this deck.
Unlock Deck
k this deck
28
Refer to the figure PPF and Comparative Advantage. The figure shows the production possibility frontier for producing baseball bats and bobblehead dolls in Stewarton and Colberton. The opportunity cost of producing dolls in Colberton is:
Figure: PPF and Comparative Advantage
A) one-half bat.
B) one bat.
C) two bats.
D) four bats.
Figure: PPF and Comparative Advantage
A) one-half bat.
B) one bat.
C) two bats.
D) four bats.
Unlock Deck
Unlock for access to all 110 flashcards in this deck.
Unlock Deck
k this deck
29
Refer to the figure PPF and Comparative Advantage. The figure shows the production possibility frontier for producing baseball bats and bobblehead dolls in Stewarton and Colberton. The opportunity cost of producing bats in Colberton is:
Figure: PPF and Comparative Advantage
A) one-half doll.
B) one doll.
C) two dolls.
D) four dolls.
Figure: PPF and Comparative Advantage
A) one-half doll.
B) one doll.
C) two dolls.
D) four dolls.
Unlock Deck
Unlock for access to all 110 flashcards in this deck.
Unlock Deck
k this deck
30
Refer to the figure PPF and Comparative Advantage. The figure shows the production possibility frontier for producing baseball bats and bobblehead dolls in Stewarton and Colberton. If both countries have identical resources, then Stewarton has a comparative advantage in producing_____ and has an absolute advantage in:
Figure: PPF and Comparative Advantage
A) bats; bats.
B) dolls; both goods.
C) dolls; dolls.
D) bats; both goods.
Figure: PPF and Comparative Advantage
A) bats; bats.
B) dolls; both goods.
C) dolls; dolls.
D) bats; both goods.
Unlock Deck
Unlock for access to all 110 flashcards in this deck.
Unlock Deck
k this deck
31
Refer to the figure PPF and Comparative Advantage. The figure shows the production possibility frontier for producing baseball bats and bobblehead dolls in Stewarton and Colberton. If both countries have identical resources, then Colberton has a comparative advantage in producing_____ and has an absolute advantage in:
Figure: PPF and Comparative Advantage
A) bats; bats.
B) dolls; neither good.
C) dolls; dolls.
D) bats; neither good.
Figure: PPF and Comparative Advantage
A) bats; bats.
B) dolls; neither good.
C) dolls; dolls.
D) bats; neither good.
Unlock Deck
Unlock for access to all 110 flashcards in this deck.
Unlock Deck
k this deck
32
Which of the following statements is true?
A) If a country can produce a good at a lower cost than others, then it has a comparative advantage in producing that good.
B) If a country can produce a good at a higher opportunity cost than others, then it has a comparative advantage in producing that good.
C) If a country has an absolute advantage in producing all the goods, it can still engage in mutually beneficial trade with other countries.
D) If a country does not have an absolute advantage in producing any good, then it cannot have a comparative advantage in producing any good.
Unlock Deck
Unlock for access to all 110 flashcards in this deck.
Unlock Deck
k this deck
33
Which of the following statements is NOT true?
A) If a country has a comparative advantage in producing a good, then it must have an absolute advantage in producing that good.
B) A country can engage in beneficial trade even if it has an absolute advantage in producing all goods.
C) If a country can produce a good at a lower opportunity cost than others, then it must have a comparative advantage in producing that good.
D) A country can have both an absolute and a comparative advantage in producing a good.
Unlock Deck
Unlock for access to all 110 flashcards in this deck.
Unlock Deck
k this deck
34
In the absence of trade, the consumption possibilities frontier _____ the production possibility frontier, and trading according to comparative advantage makes the consumption possibility frontier _____ the production possibility frontier.
A) exceeds; the same as
B) exceeds; exceed
C) is the same as; the same as
D) is the same as; exceed
A) exceeds; the same as
B) exceeds; exceed
C) is the same as; the same as
D) is the same as; exceed
Unlock Deck
Unlock for access to all 110 flashcards in this deck.
Unlock Deck
k this deck
35
Which of the following statements is true?
A) In the absence of trade, the consumption possibility frontier exceeds the production possibility frontier.
B) The slope of the consumption possibility frontier of country reflects the opportunity cost of producing the goods in that country.
C) The slope of a production possibility frontier reflects terms of trade between the goods traded.
D) If countries specialize and trade according to comparative advantage, then the consumption possibility frontier can exceed the production possibility frontier.
Unlock Deck
Unlock for access to all 110 flashcards in this deck.
Unlock Deck
k this deck
36
Portugal specializes in the production of wine and produces 10 million bottles. The United Kingdom specializes in the production of cheese and produces 100 million pounds. If the terms of trade is 10 pounds of cheese for a bottle of wine and the UK consumes 3 million bottles of wine, then Portugal consumes _____ million pounds of cheese and _____ million bottles of wine.
A) 70; 3
B) 70; 7
C) 30; 3
D) 30; 7
A) 70; 3
B) 70; 7
C) 30; 3
D) 30; 7
Unlock Deck
Unlock for access to all 110 flashcards in this deck.
Unlock Deck
k this deck
37
Portugal specializes in the production of wine, and the United Kingdom specializes in the production of cheese. If the terms of trade for cheese is one bottle of wine, then we know that the opportunity cost of producing cheese is _____ than one bottle of wine in Portugal, and the opportunity cost of producing cheese is _____ than one bottle of wine in the UK.
A) greater; greater
B) greater; less
C) less; greater
D) less; less
A) greater; greater
B) greater; less
C) less; greater
D) less; less
Unlock Deck
Unlock for access to all 110 flashcards in this deck.
Unlock Deck
k this deck
38
Portugal specializes in the production of wine and produces 10 million bottles. The United Kingdom specializes in the production of cheese and produces 100 million pounds. If the terms of trade is 10 pounds of cheese for a bottle of wine and Portugal consumes 40 million pounds of cheese, then England consumes _____ million pounds of cheese and _____ million bottles of wine.
A) 40; 4
B) 40; 6
C) 60; 4
D) 60; 6
A) 40; 4
B) 40; 6
C) 60; 4
D) 60; 6
Unlock Deck
Unlock for access to all 110 flashcards in this deck.
Unlock Deck
k this deck
39
Portugal specializes in the production of wine and produces 10 million bottles. The United Kingdom specializes in the production of cheese and produces 100 million pounds of cheese. If the terms of trade is 10 pounds of cheese for a bottle of wine and Portugal consumes 40 million pounds of cheese, then the UK consumes _____ million bottles of wine, and Portugal consumes _____ million bottles of wine.
A) 5; 5
B) 4; 6
C) 6; 4
D) 3; 7
A) 5; 5
B) 4; 6
C) 6; 4
D) 3; 7
Unlock Deck
Unlock for access to all 110 flashcards in this deck.
Unlock Deck
k this deck
40
Portugal specializes in the production of wine and produces 10 million bottles. The United Kingdom specializes in the production of cheese and produces 100 million pounds of cheese. If the terms of trade is 10 pounds of cheese for a bottle of wine and Portugal consumes 3 million bottles of wine, then the UK consumes _____ million pounds of cheese, and Portugal consumes _____ million pounds of cheese.
A) 30; 70
B) 30; 30
C) 70; 30
D) 60; 40
A) 30; 70
B) 30; 30
C) 70; 30
D) 60; 40
Unlock Deck
Unlock for access to all 110 flashcards in this deck.
Unlock Deck
k this deck
41
Portugal specializes in the production of wine and produces 10 million bottles. The United Kingdom specializes in the production of cheese and produces 100 million pounds. After trading with each other, Portugal consumes 4 million bottles of wine and 60 million pounds of cheese. Therefore, the terms of trade is _____ pounds of cheese per bottle of wine.
A) 10
B) 15
C) 20
D) 25
A) 10
B) 15
C) 20
D) 25
Unlock Deck
Unlock for access to all 110 flashcards in this deck.
Unlock Deck
k this deck
42
Portugal specializes in the production of wine and produces 10 million bottles. The United Kingdom specializes in the production of cheese and produces 100 million pounds. After trading with each other, Portugal consumes 6 million bottles of wine and 60 million pounds of cheese. Therefore, the terms of trade is _____ pounds of cheese per bottle of wine.
A) 10
B) 15
C) 20
D) 25
A) 10
B) 15
C) 20
D) 25
Unlock Deck
Unlock for access to all 110 flashcards in this deck.
Unlock Deck
k this deck
43
Refer to the figure Mutually Beneficial Trade I. The figure shows the production possibility frontier (PPF) and the consumption possibility frontier (CPF) for baseball bats and bobblehead dolls in Stewarton and Colberton. Based on the figure, the opportunity cost of producing one doll in Stewarton is:
Figure: Mutually Beneficial Trade I
A) one baseball bat.
B) two baseball bats.
C) one-half baseball bat.
D) one-quarter baseball bat.
Figure: Mutually Beneficial Trade I
A) one baseball bat.
B) two baseball bats.
C) one-half baseball bat.
D) one-quarter baseball bat.
Unlock Deck
Unlock for access to all 110 flashcards in this deck.
Unlock Deck
k this deck
44
Refer to the figure Mutually Beneficial Trade I. The figure shows the production possibility frontier (PPF) and consumption possibility frontier (CPF) for baseball bats and bobblehead dolls in Stewarton and Colberton. Based on the figure, the opportunity cost of producing bats in Stewarton is:
Figure: Mutually Beneficial Trade I
A) one doll.
B) two dolls.
C) one-half doll.
D) one-quarter doll.
Figure: Mutually Beneficial Trade I
A) one doll.
B) two dolls.
C) one-half doll.
D) one-quarter doll.
Unlock Deck
Unlock for access to all 110 flashcards in this deck.
Unlock Deck
k this deck
45
Refer to the figure Mutually Beneficial Trade I. The figure shows the production possibility frontier (PPF) and consumption possibility frontier (CPF) for baseball bats and bobblehead dolls in Stewarton and Colberton. Based on the figure, the opportunity cost of producing one doll in Colberton is:
Figure: Mutually Beneficial Trade I
A) one baseball bat.
B) two baseball bats.
C) one-half baseball bat.
D) one-quarter baseball bat.
Figure: Mutually Beneficial Trade I
A) one baseball bat.
B) two baseball bats.
C) one-half baseball bat.
D) one-quarter baseball bat.
Unlock Deck
Unlock for access to all 110 flashcards in this deck.
Unlock Deck
k this deck
46
Refer to the figure Mutually Beneficial Trade I. The figure shows the production possibility frontier (PPF) and consumption possibility frontier (CPF) for baseball bats and bobblehead dolls in Stewarton and Colberton. Based on the figure, the opportunity cost of producing one bat in Colberton is:
Figure: Mutually Beneficial Trade I
A) one doll.
B) two dolls.
C) one-half doll.
D) one-quarter doll.
Figure: Mutually Beneficial Trade I
A) one doll.
B) two dolls.
C) one-half doll.
D) one-quarter doll.
Unlock Deck
Unlock for access to all 110 flashcards in this deck.
Unlock Deck
k this deck
47
Refer to the figure Mutually Beneficial Trade I. The figure shows the production possibility frontier (PPF) and consumption possibility frontier (CPF) for baseball bats and bobblehead dolls in Stewarton and Colberton. In the absence of trade, if Stewarton is consuming 6 million dolls, then it can consume _____ million hats.
Figure: Mutually Beneficial Trade I
A) 6
B) 9
C) 12
D) 15
Figure: Mutually Beneficial Trade I
A) 6
B) 9
C) 12
D) 15
Unlock Deck
Unlock for access to all 110 flashcards in this deck.
Unlock Deck
k this deck
48
Refer to the figure Mutually Beneficial Trade I. The figure shows the production possibility frontier (PPF) and consumption possibility frontier (CPF) for baseball bats and bobblehead dolls in Stewarton and Colberton. In the absence of trade, if Colberton is consuming 4 million dolls, then it can consume _____ million bats.
Figure: Mutually Beneficial Trade I
A) 2
B) 4
C) 6
D) 9
Figure: Mutually Beneficial Trade I
A) 2
B) 4
C) 6
D) 9
Unlock Deck
Unlock for access to all 110 flashcards in this deck.
Unlock Deck
k this deck
49
Refer to the figure Mutually Beneficial Trade I. The figure shows the production possibility frontier (PPF) and consumption possibility frontier (CPF) for baseball bats and bobblehead dolls in Stewarton and Colberton. Based on the figure, we can conclude that the terms of trade is _____ for each bobblehead doll.
Figure: Mutually Beneficial Trade I
A) one-half baseball bat
B) one baseball bat
C) one and one-half baseball bats
D) two baseball bats
Figure: Mutually Beneficial Trade I
A) one-half baseball bat
B) one baseball bat
C) one and one-half baseball bats
D) two baseball bats
Unlock Deck
Unlock for access to all 110 flashcards in this deck.
Unlock Deck
k this deck
50
Refer to the figure Mutually Beneficial Trade I. The figure shows the production possibility frontier (PPF) and consumption possibility frontier (CPF) for baseball bats and bobblehead dolls in Stewarton and Colberton. If both countries have identical resources, then Colberton has a comparative advantage in _____ and has an absolute advantage in:
Figure: Mutually Beneficial Trade I
A) dolls; dolls.
B) dolls; neither good.
C) bats; bats.
D) bats; neither good.
Figure: Mutually Beneficial Trade I
A) dolls; dolls.
B) dolls; neither good.
C) bats; bats.
D) bats; neither good.
Unlock Deck
Unlock for access to all 110 flashcards in this deck.
Unlock Deck
k this deck
51
Refer to the figure Mutually Beneficial Trade I. The figure shows the production possibility frontier (PPF) and consumption possibility frontier (CPF) for baseball bats and bobblehead dolls in Stewarton and Colberton. If both countries have identical resources, then Stewarton has a comparative advantage in _____ and has an absolute advantage in:
Figure: Mutually Beneficial Trade I
A) dolls; dolls.
B) dolls; both goods.
C) bats; bats.
D) bats; both goods.
Figure: Mutually Beneficial Trade I
A) dolls; dolls.
B) dolls; both goods.
C) bats; bats.
D) bats; both goods.
Unlock Deck
Unlock for access to all 110 flashcards in this deck.
Unlock Deck
k this deck
52
Refer to the figure Free Trade and Imports. The figure shows the demand, U.S. supply, and world supply curves for baseball bats. In the absence of trade, the equilibrium price will be _____, and the equilibrium quantity will be _____ million bats.
Figure: Free Trade and Imports
A) $14; 10
B) $20; 10
C) $14; 15
D) $20; 15
Figure: Free Trade and Imports
A) $14; 10
B) $20; 10
C) $14; 15
D) $20; 15
Unlock Deck
Unlock for access to all 110 flashcards in this deck.
Unlock Deck
k this deck
53
Refer to the figure Free Trade and Imports. The figure shows the U.S. demand, U.S. supply, and world supply curves for baseball bats. With free trade, the consumers will purchase _____ million bats, of which _____ million will be supplied domestically.
Figure: Free Trade and Imports
A) 10; 7
B) 15; 10
C) 7; 7
D) 15; 7
Figure: Free Trade and Imports
A) 10; 7
B) 15; 10
C) 7; 7
D) 15; 7
Unlock Deck
Unlock for access to all 110 flashcards in this deck.
Unlock Deck
k this deck
54
Refer to the figure Free Trade and Imports. The figure shows the U.S. demand, U.S. supply, and world supply curves for baseball bats. With free trade, the consumers will purchase _____ million bats, of which _____ million will be imported from the rest of the world.
Figure: Free Trade and Imports
A) 10; 7
B) 15; 7
C) 10; 8
D) 15; 8
Figure: Free Trade and Imports
A) 10; 7
B) 15; 7
C) 10; 8
D) 15; 8
Unlock Deck
Unlock for access to all 110 flashcards in this deck.
Unlock Deck
k this deck
55
Refer to the figure Import Tariffs. The figure shows the U.S. demand, U.S. supply, and world supply curves for baseball bats. In the absence of trade, the equilibrium price of bats will be _____, and the equilibrium quantity will be _____ million bats.
Figure: Import Tariffs
A) $13; 20
B) $21; 24
C) $25; 20
D) $13; 32
Figure: Import Tariffs
A) $13; 20
B) $21; 24
C) $25; 20
D) $13; 32
Unlock Deck
Unlock for access to all 110 flashcards in this deck.
Unlock Deck
k this deck
56
Refer to the figure Import Tariffs. The figure shows the U.S. demand, U.S. supply, and world supply curve for baseball bats. With free trade and no tariffs, the consumers will purchase _____ million bats, of which _____ million will be supplied domestically.
Figure: Import Tariffs
A) 32; 8
B) 20; 16
C) 32; 24
D) 20; 12
Figure: Import Tariffs
A) 32; 8
B) 20; 16
C) 32; 24
D) 20; 12
Unlock Deck
Unlock for access to all 110 flashcards in this deck.
Unlock Deck
k this deck
57
Refer to the figure Import Tariffs. The figure shows the U.S. demand, U.S. supply, and world supply curves for baseball bats. With free trade and no tariffs, the consumers will purchase_____ million bats, of which _____ million will be imported from the rest of the world.
Figure: Import Tariffs
A) 32; 8
B) 32; 24
C) 20; 12
D) 20; 4
Figure: Import Tariffs
A) 32; 8
B) 32; 24
C) 20; 12
D) 20; 4
Unlock Deck
Unlock for access to all 110 flashcards in this deck.
Unlock Deck
k this deck
58
Refer to the figure Import Tariffs. The figure shows the U.S. demand, U.S. supply, and world supply curves for baseball bats. If the United States imposes a $8 tariff on imports, then the price paid by consumers will be _____, and consumers will purchase _____ million bats.
Figure: Import Tariffs
A) $21; 16
B) $25; 16
C) $21; 24
D) $25; 24
Figure: Import Tariffs
A) $21; 16
B) $25; 16
C) $21; 24
D) $25; 24
Unlock Deck
Unlock for access to all 110 flashcards in this deck.
Unlock Deck
k this deck
59
Refer to the figure Import Tariffs. The figure shows the U.S. demand, U.S. supply, and world supply curves for baseball bats. If the United States imposes a $8 tariff on imports, then the consumers will purchase _____ million bats, of which _____ million will be supplied domestically.
Figure: Import Tariffs
A) 20; 16
B) 20; 20
C) 24; 16
D) 24; 20
Figure: Import Tariffs
A) 20; 16
B) 20; 20
C) 24; 16
D) 24; 20
Unlock Deck
Unlock for access to all 110 flashcards in this deck.
Unlock Deck
k this deck
60
Refer to the figure Import Tariffs. The figure shows the U.S. demand, U.S. supply, and world supply curves for baseball bats. If the United States imposes a $8 tariff on imports, then the consumers will buy _____ million bats, of which _____ million will be imported from the rest of the world.
Figure: Import Tariffs
A) 24; 8
B) 32; 8
C) 32; 4
D) 24; 4
Figure: Import Tariffs
A) 24; 8
B) 32; 8
C) 32; 4
D) 24; 4
Unlock Deck
Unlock for access to all 110 flashcards in this deck.
Unlock Deck
k this deck
61
Refer to the figure Import Tariffs. The figure shows the demand, U.S. supply, and world supply curves for baseball bats. If the United States imposes a $8 tariff on imports, then the government's revenue from the tariff is _____ million.
Figure: Import Tariffs
A) $8
B) $16
C) $32
D) $64
Figure: Import Tariffs
A) $8
B) $16
C) $32
D) $64
Unlock Deck
Unlock for access to all 110 flashcards in this deck.
Unlock Deck
k this deck
62
Suppose that the United States imposes tariffs on cars manufactured in Europe. As a result, the demand for cars in the U.S. is 100 million cars per year, and the domestic supply is 95 million cars. Further, the government earns $500 million in revenue from the tariff. We can conclude that the import tariff per car is:
A) $50.
B) $100.
C) $150.
D) $200.
A) $50.
B) $100.
C) $150.
D) $200.
Unlock Deck
Unlock for access to all 110 flashcards in this deck.
Unlock Deck
k this deck
63
Imposing a tariff on the import of a good _____ the price paid by the consumers and _____ the quantity consumed compared to free trade.
A) increases; increases
B) increases; decreases
C) decreases; increases
D) decreases; decreases
A) increases; increases
B) increases; decreases
C) decreases; increases
D) decreases; decreases
Unlock Deck
Unlock for access to all 110 flashcards in this deck.
Unlock Deck
k this deck
64
Imposing a tariff on the import of a good _____ the quantity supplied domestically and _____ the quantity demanded compared to free trade.
A) increases; increases
B) increases; decreases
C) decreases; increases
D) decreases; decreases
A) increases; increases
B) increases; decreases
C) decreases; increases
D) decreases; decreases
Unlock Deck
Unlock for access to all 110 flashcards in this deck.
Unlock Deck
k this deck
65
Imposing a quota on the import of a good leads to _____ in the equilibrium quantity and _____ in the price of the good as compared to free trade.
A) an increase; an increase
B) a decrease; an increase
C) an increase; a decrease
D) a decrease; a decrease
A) an increase; an increase
B) a decrease; an increase
C) an increase; a decrease
D) a decrease; a decrease
Unlock Deck
Unlock for access to all 110 flashcards in this deck.
Unlock Deck
k this deck
66
Refer to the figure Import Quota. The figure shows the U.S. supply, world supply, and U.S. demand curve for cheese. In the absence of trade, the equilibrium quantity of cheese consumed will be ____ million pounds, and the equilibrium price will be _____ per pound.
Figure: Import Quota
A) 100; $6
B) 145; $7
C) 100; $10
D) 160; $6
Figure: Import Quota
A) 100; $6
B) 145; $7
C) 100; $10
D) 160; $6
Unlock Deck
Unlock for access to all 110 flashcards in this deck.
Unlock Deck
k this deck
67
Refer to the figure Import Quota. The figure shows the U.S. supply, world supply, and U.S. demand curve for cheese. With free trade, the total quantity of cheese purchased will be _____ million pounds, out of which _____ million pounds will be imported.
Figure: Import Quota
A) 145; 90
B) 100; 45
C) 160; 120
D) 100; 60
Figure: Import Quota
A) 145; 90
B) 100; 45
C) 160; 120
D) 100; 60
Unlock Deck
Unlock for access to all 110 flashcards in this deck.
Unlock Deck
k this deck
68
Refer to the figure Import Quota. The figure shows the U.S. supply, world supply, and U.S. demand curve for cheese. With free trade, the domestic supply of cheese will be _____ million pounds, and the total imports will be _____ million pounds.
Figure: Import Quota
A) 40; 60
B) 100; 60
C) 40; 120
D) 100; 30
Figure: Import Quota
A) 40; 60
B) 100; 60
C) 40; 120
D) 100; 30
Unlock Deck
Unlock for access to all 110 flashcards in this deck.
Unlock Deck
k this deck
69
Refer to the figure Import Quota. The figure shows the U.S. supply, world supply, and U.S. demand curve for cheese. If the United States imposes a quota and the resulting equilibrium price is $7, then the total domestic supply of cheese will be _____ million pounds, and the total imports will be _____ million pounds.
Figure: Import Quota
A) 100; 45
B) 55; 90
C) 145; 30
D) 40; 80
Figure: Import Quota
A) 100; 45
B) 55; 90
C) 145; 30
D) 40; 80
Unlock Deck
Unlock for access to all 110 flashcards in this deck.
Unlock Deck
k this deck
70
Refer to the figure Import Quota. The figure shows the U.S. supply, world supply, and U.S. demand curve for cheese. If the United States imposes a quota and the resulting equilibrium price is $7, then the total import quota is _____ million pounds.
Figure: Import Quota
A) 60
B) 90
C) 105
D) 120
Figure: Import Quota
A) 60
B) 90
C) 105
D) 120
Unlock Deck
Unlock for access to all 110 flashcards in this deck.
Unlock Deck
k this deck
71
Refer to the figure Import Quota. The figure shows the U.S. supply, world supply, and U.S. demand curve for cheese. If the United States imposes a quota and the resulting equilibrium price is $7, then the total quantity of cheese purchased is _____ million pounds, out of which _____ million pounds are imported.
Figure: Import Quota
A) 100; 90
B) 145; 90
C) 130; 75
D) 145; 105
Figure: Import Quota
A) 100; 90
B) 145; 90
C) 130; 75
D) 145; 105
Unlock Deck
Unlock for access to all 110 flashcards in this deck.
Unlock Deck
k this deck
72
Refer to the figure Import Quota. The figure shows the U.S. supply, world supply, and U.S. demand curve for cheese. If the United States imposes a quota of 90 million pounds on imports, then the resulting equilibrium price will be _____, and the total consumption of cheese will be _____ million pounds.
Figure: Import Quota
A) $6; 160
B) $6; 145
C) $7; 160
D) $7; 145
Figure: Import Quota
A) $6; 160
B) $6; 145
C) $7; 160
D) $7; 145
Unlock Deck
Unlock for access to all 110 flashcards in this deck.
Unlock Deck
k this deck
73
Refer to the figure Import Quota. The figure shows the U.S. supply, world supply, and U.S. demand curve for cheese. If the United States imposes a quota of 90 million pounds on imports, then _____ million pounds of cheese will be supplied domestically.
Figure: Import Quota
A) 40
B) 55
C) 100
D) 130
Figure: Import Quota
A) 40
B) 55
C) 100
D) 130
Unlock Deck
Unlock for access to all 110 flashcards in this deck.
Unlock Deck
k this deck
74
Refer to the figure Currency Appreciation and Depreciation. The figure shows the supply and demand of U.S. dollars in the euro-U.S. dollar foreign exchange market. A shift in the equilibrium from A to B implies that the U.S. dollar is _____ and the euro is:
Figure: Currency Appreciation and Depreciation
A) appreciating; appreciating.
B) appreciating; depreciating.
C) depreciating; appreciating.
D) depreciating; depreciating.
Figure: Currency Appreciation and Depreciation
A) appreciating; appreciating.
B) appreciating; depreciating.
C) depreciating; appreciating.
D) depreciating; depreciating.
Unlock Deck
Unlock for access to all 110 flashcards in this deck.
Unlock Deck
k this deck
75
Refer to the figure Currency Appreciation and Depreciation. The figure shows the supply and demand of U.S. dollars in the euro-U.S. dollar foreign exchange market. A shift in the equilibrium from D to A implies that the U.S. dollar is _____ and the euro is:
Figure: Currency Appreciation and Depreciation
A) appreciating; not changing in value.
B) appreciating; depreciating.
C) depreciating; not changing in value.
D) depreciating; appreciating.
Figure: Currency Appreciation and Depreciation
A) appreciating; not changing in value.
B) appreciating; depreciating.
C) depreciating; not changing in value.
D) depreciating; appreciating.
Unlock Deck
Unlock for access to all 110 flashcards in this deck.
Unlock Deck
k this deck
76
Refer to the figure Currency Appreciation and Depreciation. The figure shows the supply and demand of U.S. dollars in the euro-U.S. dollar foreign exchange market. A shift in the equilibrium from C to A implies that the U.S. dollar is _____ and the euro is:
Figure: Currency Appreciation and Depreciation
A) not changing in value; appreciating.
B) depreciating; appreciating.
C) not changing in value; depreciating.
D) appreciating; depreciating.
Figure: Currency Appreciation and Depreciation
A) not changing in value; appreciating.
B) depreciating; appreciating.
C) not changing in value; depreciating.
D) appreciating; depreciating.
Unlock Deck
Unlock for access to all 110 flashcards in this deck.
Unlock Deck
k this deck
77
Refer to the figure Currency Appreciation and Depreciation. The figure shows the supply and demand of U.S. dollars in the euro-U.S. dollar foreign exchange market. A shift in the equilibrium from C to B implies that the U.S. dollar is _____ and the euro is:
Figure: Currency Appreciation and Depreciation
A) appreciating; appreciating.
B) appreciating; depreciating.
C) depreciating; appreciating.
D) depreciating; depreciating.
Figure: Currency Appreciation and Depreciation
A) appreciating; appreciating.
B) appreciating; depreciating.
C) depreciating; appreciating.
D) depreciating; depreciating.
Unlock Deck
Unlock for access to all 110 flashcards in this deck.
Unlock Deck
k this deck
78
Refer to the figure Currency Appreciation and Depreciation. The figure shows the supply and demand of U.S. dollars in the euro-U.S. dollar foreign exchange market. A shift in the equilibrium from A to D implies that the U.S. dollar is _____ and the euro is:
Figure: Currency Appreciation and Depreciation
A) appreciating; not changing in value.
B) appreciating; depreciating.
C) depreciating; not changing in value.
D) depreciating; appreciating.
Figure: Currency Appreciation and Depreciation
A) appreciating; not changing in value.
B) appreciating; depreciating.
C) depreciating; not changing in value.
D) depreciating; appreciating.
Unlock Deck
Unlock for access to all 110 flashcards in this deck.
Unlock Deck
k this deck
79
Refer to the figure Currency Appreciation and Depreciation. The figure shows the supply and demand of U.S. dollars in the euro-U.S. dollar foreign exchange market. Which of the following shifts in the equilibrium represents an appreciation in the U.S. dollar?
Figure: Currency Appreciation and Depreciation
A) C to A
B) D to A
C) A to B
D) B to A
Figure: Currency Appreciation and Depreciation
A) C to A
B) D to A
C) A to B
D) B to A
Unlock Deck
Unlock for access to all 110 flashcards in this deck.
Unlock Deck
k this deck
80
Refer to the figure Currency Appreciation and Depreciation. The figure shows the supply and demand of U.S. dollars in the euro-U.S. dollar foreign exchange market. Which of the following shifts in the equilibrium represents a depreciation in the U.S. dollar?
Figure: Currency Appreciation and Depreciation
A) C to A
B) A to D
C) A to C
D) B to C
Figure: Currency Appreciation and Depreciation
A) C to A
B) A to D
C) A to C
D) B to C
Unlock Deck
Unlock for access to all 110 flashcards in this deck.
Unlock Deck
k this deck
Unlock Deck
Unlock for access to all 110 flashcards in this deck.


