Deck 3: Summarizing Center and Diversity: Basic Descriptive Statistics
Full screen (f)
Question
Question
Question
Question
Question
Question
Question
Question
Question
Question
Question
Question
Question
Question
Question
Question
Question
Question
Question
Question
Question
Question
Question
Question
Question
Question
Here are some statistics using GSS2008 data:
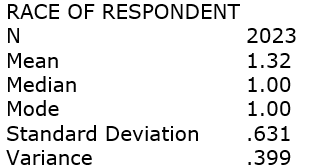 Explain what is wrong with this output.
Explain what is wrong with this output. Question
Question
Here are some statistics using GSS2008 data for a variable "number of times respondent goes to a bar per month", using only black respondents who are in their 20s:
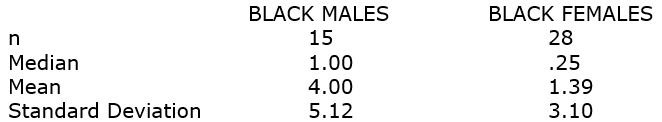 Contrast these two groups with regard to skewness and variation.
Contrast these two groups with regard to skewness and variation. Question
Here are some statistics using GSS2008 data for a variable "number of weeks the respondent worked last year", using only respondents who are in their 40s:
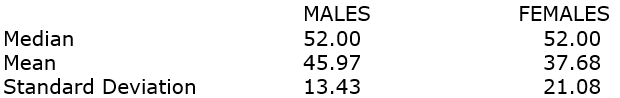 Contrast these two groups with regard to skewness and variation.
Contrast these two groups with regard to skewness and variation. Question
Question
Question
Here are GSS2008 data on the variable called BABIES (number of household members less than 6 years old) for respondents aged 20 to 29:
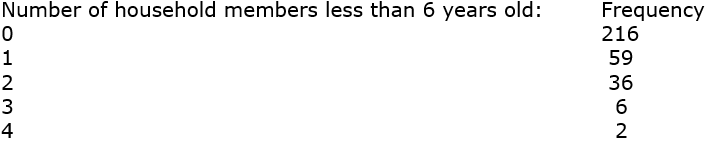 Describe the "uniqueness" of someone who has 4 household members less than 6 years old.
Describe the "uniqueness" of someone who has 4 household members less than 6 years old. Question
A new set of variables in the 2008 GSS involved whether an anti-American Muslim clergyman should be allowed to do certain things. Here are the frequencies for these three variables:
 By calculating the IQV for each of the three variables, describe the differing amounts of variation in these attitudes.
By calculating the IQV for each of the three variables, describe the differing amounts of variation in these attitudes. Question

Unlock Deck
Sign up to unlock the cards in this deck!
Unlock Deck
Unlock Deck
1/34
Play
Full screen (f)
Deck 3: Summarizing Center and Diversity: Basic Descriptive Statistics
1
If your variable is "Highest Educational Degree Respondent Has Achieved," which of the following measures can you find?
A) mode, median, mean
B) mode, mean
C) median, mean
D) mode, median
A) mode, median, mean
B) mode, mean
C) median, mean
D) mode, median
D
2
If your variable is "Type of College Respondent Attended," which of the following measures can you find?
A) mode
B) mode, median
C) mode, median, mean
D) you cannot find any of these measures
A) mode
B) mode, median
C) mode, median, mean
D) you cannot find any of these measures
A
3
If your variable is "Number of Years of Education Respondent Has Attained," which of the following measures can you find?
A) mode
B) mode, median
C) median, mean
D) mode, median, mean
A) mode
B) mode, median
C) median, mean
D) mode, median, mean
D
4
If you wanted to be able to find the mean, median, and mode for a measure of religiosity, which of the following variables would you want to use?
A) respondent's religious denomination
B) respondent's self-reported religiosity (high, medium, low)
C) number of times respondent attends religious services per month
D) respondent's prayer frequency (often, sometimes, never)
A) respondent's religious denomination
B) respondent's self-reported religiosity (high, medium, low)
C) number of times respondent attends religious services per month
D) respondent's prayer frequency (often, sometimes, never)
Unlock Deck
Unlock for access to all 34 flashcards in this deck.
Unlock Deck
k this deck
5
Using the variable "Hours of Television Watched Per Day," you want to compare the amount of variation among men and women. What is the most appropriate thing to do?
A) Find the standard deviation for each group.
B) Find the variance for each group.
C) Find the I.Q.V. for each group.
D) Find the interquartile range for each group.
A) Find the standard deviation for each group.
B) Find the variance for each group.
C) Find the I.Q.V. for each group.
D) Find the interquartile range for each group.
Unlock Deck
Unlock for access to all 34 flashcards in this deck.
Unlock Deck
k this deck
6
Your instructor tells you that the distribution of grades on the exam was highly left skewed. Which of the following can you infer from this?
A) Everyone scored around the same on the exam.
B) There were a few very high scores.
C) There were a few very low scores.
D) There was a lot of variation in scores.
A) Everyone scored around the same on the exam.
B) There were a few very high scores.
C) There were a few very low scores.
D) There was a lot of variation in scores.
Unlock Deck
Unlock for access to all 34 flashcards in this deck.
Unlock Deck
k this deck
7
You want to show someone who watches television 16 hours per day just how "unique" he is. What statistic is the best to use in order to do this?
A) The standard deviation
B) The variance
C) The mean
D) The range
A) The standard deviation
B) The variance
C) The mean
D) The range
Unlock Deck
Unlock for access to all 34 flashcards in this deck.
Unlock Deck
k this deck
8
Your instructor tells you that the mean on the exam was 85 and the standard deviation was 0. Which of the following can you infer from this?
A) Everyone scored an 85.
B) Most people scored around an 85.
C) Some people scored an 85.
D) No one scored an 85.
A) Everyone scored an 85.
B) Most people scored around an 85.
C) Some people scored an 85.
D) No one scored an 85.
Unlock Deck
Unlock for access to all 34 flashcards in this deck.
Unlock Deck
k this deck
9
At a college, the average number of hours students play video games is 3 hours per week with a standard deviation of 3. What is the z-score for Red-Eyed Randy, a student at this college who plays video games 30 hours per week?
A) 3
B) 6
C) 9
D) 30
A) 3
B) 6
C) 9
D) 30
Unlock Deck
Unlock for access to all 34 flashcards in this deck.
Unlock Deck
k this deck
10
At a business, the average number of hours worked per week is 40 with a standard deviation of 5. What is the z-score for Overachieving Olivia, who works 80 hours per week?
A) 2
B) 4
C) 6
D) 8
A) 2
B) 4
C) 6
D) 8
Unlock Deck
Unlock for access to all 34 flashcards in this deck.
Unlock Deck
k this deck
11
Using GSS2008 data, here are statistics of men's and women's incomes:
What is the most appropriate conclusion based on these results?
A) Among men's incomes there is 1.50 times the variation than among women's incomes.
B) Among men's incomes there is 1.38 times the variation than among women's incomes.
C) Among men's incomes there is 1.90 times the variation than among women's incomes.
D) There is 10.58 more variation among men's incomes than there is among women's incomes.
Unlock Deck
Unlock for access to all 34 flashcards in this deck.
Unlock Deck
k this deck
12
The mean of a dichotomy is:
A) the percentage of the respondents who were coded "0" on the dichotomy
B) the percentage of the respondents who were coded "1" on the dichotomy
C) the same as the median of the same dichotomy
D) meaningless
A) the percentage of the respondents who were coded "0" on the dichotomy
B) the percentage of the respondents who were coded "1" on the dichotomy
C) the same as the median of the same dichotomy
D) meaningless
Unlock Deck
Unlock for access to all 34 flashcards in this deck.
Unlock Deck
k this deck
13
The IQV takes on values between:
A) -1 and +1
B) 0 and +1
C) 0 and +10
D) 0 and +100
A) -1 and +1
B) 0 and +1
C) 0 and +10
D) 0 and +100
Unlock Deck
Unlock for access to all 34 flashcards in this deck.
Unlock Deck
k this deck
14
A GSS variable called MARHOMO: "Do you agree or disagree? Homosexual couples should have the right to marry one another." The IQV for this variable in 1988 was .65, and in 2008 it was .97. From these results, what is the most accurate conclusion?
A) Attitudes toward gay marriage are changing.
B) People are becoming more accepting of gay marriage.
C) There is growing consensus about gay marriage.
D) There is increasing variation in attitudes toward gay marriage.
A) Attitudes toward gay marriage are changing.
B) People are becoming more accepting of gay marriage.
C) There is growing consensus about gay marriage.
D) There is increasing variation in attitudes toward gay marriage.
Unlock Deck
Unlock for access to all 34 flashcards in this deck.
Unlock Deck
k this deck
15
A particular college club goes from having all male members to having half men, half women. What is the most appropriate statistical statement based on this information?
A) The IQV has gone from 0 to 1.
B) The IQV has gone from 0 to .5.
C) The IQV has gone from 1 to 0.
D) The IQV has gone from .5 to 0.
A) The IQV has gone from 0 to 1.
B) The IQV has gone from 0 to .5.
C) The IQV has gone from 1 to 0.
D) The IQV has gone from .5 to 0.
Unlock Deck
Unlock for access to all 34 flashcards in this deck.
Unlock Deck
k this deck
16
You want to compare variation over time in attitudes towards women working using the GSS question: "A preschool child is likely to suffer if his or her mother works: Strongly Agree, Agree, Disagree, or Strongly Disagree." What is the most appropriate statistic to use here?
A) The standard deviation.
B) The variance.
C) The IQV.
D) The median.
A) The standard deviation.
B) The variance.
C) The IQV.
D) The median.
Unlock Deck
Unlock for access to all 34 flashcards in this deck.
Unlock Deck
k this deck
17
According to the textbook, which issue has been the most controversial in terms of people's attitudes towards government funding?
A) the military
B) the environment
C) health
D) the space program
A) the military
B) the environment
C) health
D) the space program
Unlock Deck
Unlock for access to all 34 flashcards in this deck.
Unlock Deck
k this deck
18
In most major cities, the level of residential segregation has decreased somewhat. In such cities, the Index of Dissimilarity has:
A) decreased
B) increased
C) gone to 0
D) gone to 100
A) decreased
B) increased
C) gone to 0
D) gone to 100
Unlock Deck
Unlock for access to all 34 flashcards in this deck.
Unlock Deck
k this deck
19
The Gini coefficient is particularly useful as a measure of:
A) crime rate
B) happiness
C) income inequality
D) births to deaths ratio
A) crime rate
B) happiness
C) income inequality
D) births to deaths ratio
Unlock Deck
Unlock for access to all 34 flashcards in this deck.
Unlock Deck
k this deck
20
In recent years, the Gini coefficient for the U.S. has:
A) decreased
B) increased
C) stayed the same
D) doubled
A) decreased
B) increased
C) stayed the same
D) doubled
Unlock Deck
Unlock for access to all 34 flashcards in this deck.
Unlock Deck
k this deck
21
In Liu and Srivastava's article on the U.S. Senate, which of the following is NOT one of their units of analysis?
A) the individual senator
B) senator dyads
C) the U.S. Senate as a whole
D) they use all of these as units of analysis
A) the individual senator
B) senator dyads
C) the U.S. Senate as a whole
D) they use all of these as units of analysis
Unlock Deck
Unlock for access to all 34 flashcards in this deck.
Unlock Deck
k this deck
22
In Liu and Srivastava's article on the U.S. Senate, which of the following is NOT a characteristic of their senator dyads?
A) how differently each senator votes from the other
B) how far away one senator sits from the other in the chamber
C) how many years seniority one senator has over the other
D) all of these are characteristics of their dyads
A) how differently each senator votes from the other
B) how far away one senator sits from the other in the chamber
C) how many years seniority one senator has over the other
D) all of these are characteristics of their dyads
Unlock Deck
Unlock for access to all 34 flashcards in this deck.
Unlock Deck
k this deck
23
In their article on the changing prison population, Porter and her co-authors concentrate on which characteristic?
A) race
B) age
C) gender
D) years of education
A) race
B) age
C) gender
D) years of education
Unlock Deck
Unlock for access to all 34 flashcards in this deck.
Unlock Deck
k this deck
24
With regard to average age of prisoner, Porter found that the median age had _______ the mean age.
A) fallen further behind
B) nearly caught up to
C) completely caught up to
D) surpassed
A) fallen further behind
B) nearly caught up to
C) completely caught up to
D) surpassed
Unlock Deck
Unlock for access to all 34 flashcards in this deck.
Unlock Deck
k this deck
25
A group of nine employees have a mean income of 50 thousand dollars, and the median income is 50 thousand dollars as well. A tenth employee is introduced into the mix, and this employee has an income of 100 thousand dollars. If you have enough information to find the new mean, then do so. If you don't have enough information to find the new mean, explain why. If you have enough information to find the new median, then do so. If you don't have enough information to find the new median, explain why.
Unlock Deck
Unlock for access to all 34 flashcards in this deck.
Unlock Deck
k this deck
26
Here are some statistics using GSS2008 data:
Explain what is wrong with this output.
Explain what is wrong with this output. Unlock Deck
Unlock for access to all 34 flashcards in this deck.
Unlock Deck
k this deck
27
At a business, we find that, even though the mean salary for males and females is the same, the male employees' salary variance is 100, while the female employee's salary variance is 25. Describe what this tells us.
Unlock Deck
Unlock for access to all 34 flashcards in this deck.
Unlock Deck
k this deck
28
Here are some statistics using GSS2008 data for a variable "number of times respondent goes to a bar per month", using only black respondents who are in their 20s:
Contrast these two groups with regard to skewness and variation.
Contrast these two groups with regard to skewness and variation. Unlock Deck
Unlock for access to all 34 flashcards in this deck.
Unlock Deck
k this deck
29
Here are some statistics using GSS2008 data for a variable "number of weeks the respondent worked last year", using only respondents who are in their 40s:
Contrast these two groups with regard to skewness and variation.
Contrast these two groups with regard to skewness and variation. Unlock Deck
Unlock for access to all 34 flashcards in this deck.
Unlock Deck
k this deck
30
At a business, we find that the male employees' salary distribution is positively skewed, while the female employees' salary distribution is negatively skewed. Describe what this tells us.
Unlock Deck
Unlock for access to all 34 flashcards in this deck.
Unlock Deck
k this deck
31
A group of nine employees have a mean income of 50 thousand dollars, with a standard deviation of 10 thousand dollars. Four more employees are introduced into the mix, and these employees each have an income of 50 thousand dollars. Find the new standard deviation.
Unlock Deck
Unlock for access to all 34 flashcards in this deck.
Unlock Deck
k this deck
32
Here are GSS2008 data on the variable called BABIES (number of household members less than 6 years old) for respondents aged 20 to 29:
Describe the "uniqueness" of someone who has 4 household members less than 6 years old.
Describe the "uniqueness" of someone who has 4 household members less than 6 years old. Unlock Deck
Unlock for access to all 34 flashcards in this deck.
Unlock Deck
k this deck
33
A new set of variables in the 2008 GSS involved whether an anti-American Muslim clergyman should be allowed to do certain things. Here are the frequencies for these three variables:
By calculating the IQV for each of the three variables, describe the differing amounts of variation in these attitudes.
By calculating the IQV for each of the three variables, describe the differing amounts of variation in these attitudes. Unlock Deck
Unlock for access to all 34 flashcards in this deck.
Unlock Deck
k this deck
34
You have a choice of moving to one of two countries: in the first, the Gini coefficient is 0, in the second, the Gini coefficient is 1. Explain the potential downside of living in each country.
Unlock Deck
Unlock for access to all 34 flashcards in this deck.
Unlock Deck
k this deck
Unlock Deck
Unlock for access to all 34 flashcards in this deck.


