Deck 12: Confidence Intervals and Effect Size: Building a Better Mousetrap
Full screen (f)
Question
Question
Question
Question
Question
Question
Question
Question
Question
Question
Question
Question
Question
Question
Question
Question
Question
Question
Question
Question
Question
Question
Question
Question
Question
Question
Question
Question
Question
Question
Question
Question
Question
Question
Question
Question
Question
Question
Question
Question
Question
Question
Question
Question
Question
Question
Question
Below are the data of an course that prepares students for standardized testing. The data below show pretest (test on day 1) and a post test (test after taking the course) scores of students who enrolled. Use this data to answer the following questions.
 Calculate the 95% confidence interval for the mean difference
Calculate the 95% confidence interval for the mean difference Question
Below are the data of an course that prepares students for standardized testing. The data below show pretest (test on day 1) and a post test (test after taking the course) scores of students who enrolled. Use this data to answer the following questions.
 Calculate cohen's d
Calculate cohen's d Question
A research team collects data from two groups, in one group, they administered a learning task that provided feedback (i.e., telling the participant if they were right or wrong) and in the other, the participants were not provided with feedback. The research team is interested in the number of trials the participants spent learning as a function of their independent variable. Below are the number of trials each participant spent. Use it to answer the following questions.
 Calculate the 95% confidence interval of the mean difference
Calculate the 95% confidence interval of the mean difference Question
A research team collects data from two groups, in one group, they administered a learning task that provided feedback (i.e., telling the participant if they were right or wrong) and in the other, the participants were not provided with feedback. The research team is interested in the number of trials the participants spent learning as a function of their independent variable. Below are the number of trials each participant spent. Use it to answer the following questions.
 What is the Cohen's d?
What is the Cohen's d? Question
A researcher is examining three different types of treatment on individuals who suffer from major depression. Below are the data, use it to answer the following questions
 calculate the eta-squared
calculate the eta-squared Question
A researcher is examining three different types of treatment on individuals who suffer from major depression. Below are the data, use it to answer the following questions
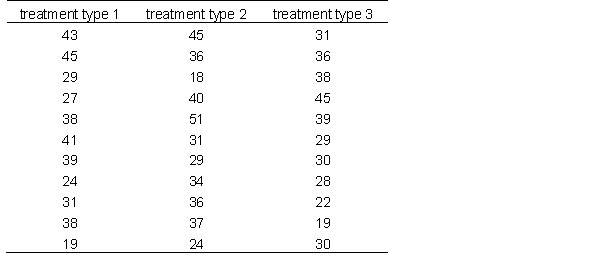 Characterize the size of this effect
Characterize the size of this effect Question
Use the source table below to answer the following questions
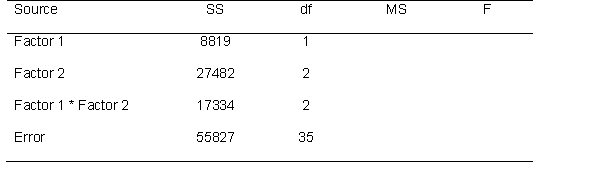 How many total eta-squared are there for this factorial ANOVA?
How many total eta-squared are there for this factorial ANOVA? Question
Use the source table below to answer the following questions
 Calculate each eta-squared
Calculate each eta-squared Question
Question

Unlock Deck
Sign up to unlock the cards in this deck!
Unlock Deck
Unlock Deck
1/56
Play
Full screen (f)
Deck 12: Confidence Intervals and Effect Size: Building a Better Mousetrap
1
A single number that is used to predict another value is a point estimate.
True
2
Confidence intervals that have higher % confidence are likely to encompass a wider range than one that has a lower % confidence.
True
3
Confidence Intervals are created for the sole purpose of estimating the true population mean.
False
4
Precision is best described as when the interval estimate captures the true estimated value.
Unlock Deck
Unlock for access to all 56 flashcards in this deck.
Unlock Deck
k this deck
5
The null and alternate hypotheses generally are about different distributions.
Unlock Deck
Unlock for access to all 56 flashcards in this deck.
Unlock Deck
k this deck
6
If an IV has a significant effect on a DV, then the effect size must be large
Unlock Deck
Unlock for access to all 56 flashcards in this deck.
Unlock Deck
k this deck
7
Cohen's d is an estimate of the true population mean.
Unlock Deck
Unlock for access to all 56 flashcards in this deck.
Unlock Deck
k this deck
8
Cohen's d can be used to estimate the size of a mean difference between two groups
Unlock Deck
Unlock for access to all 56 flashcards in this deck.
Unlock Deck
k this deck
9
when using a two-way ANOVA, there are exactly 3 measurable partial -eta-squared.
Unlock Deck
Unlock for access to all 56 flashcards in this deck.
Unlock Deck
k this deck
10
With respect to the value of Cohen's d, effects that are small are near 0, and effects that are considered large must be greater than 1.
Unlock Deck
Unlock for access to all 56 flashcards in this deck.
Unlock Deck
k this deck
11
A t-test found a significant effect in which one condition had a detrimental effect on the outcome, making it significantly worse. In this case, one would expect that Cohen's d would be negative.
Unlock Deck
Unlock for access to all 56 flashcards in this deck.
Unlock Deck
k this deck
12
Eta-squared cannot be greater than 1.00.
Unlock Deck
Unlock for access to all 56 flashcards in this deck.
Unlock Deck
k this deck
13
eta-squared cannot be less than 0
Unlock Deck
Unlock for access to all 56 flashcards in this deck.
Unlock Deck
k this deck
14
Partial eta-squared are only used for factorial ANOVAs, and not one-way ANOVAs.
Unlock Deck
Unlock for access to all 56 flashcards in this deck.
Unlock Deck
k this deck
15
Like an inferential test, confidence intervals can be calculated on mean differences to test for statistical significance..
Unlock Deck
Unlock for access to all 56 flashcards in this deck.
Unlock Deck
k this deck
16
When the 95% confidence interval of the mean of one group does not include 0, it means that the difference between two groups is statistically significant at the .05 level
Unlock Deck
Unlock for access to all 56 flashcards in this deck.
Unlock Deck
k this deck
17
Effect sizes and confidence intervals becoming less and less frequently used in published research. They are more common for oral presentations.
Unlock Deck
Unlock for access to all 56 flashcards in this deck.
Unlock Deck
k this deck
18
One reason why effect sizes are generally omitted is because it makes the statistics harder to understand and does not provide any additional information that significance testing doesn't already tell us.
Unlock Deck
Unlock for access to all 56 flashcards in this deck.
Unlock Deck
k this deck
19
The 99% confidence interval of a mean difference is from .04 to 1.49. This suggests that the mean difference is significant at the alpha = .05 level.
Unlock Deck
Unlock for access to all 56 flashcards in this deck.
Unlock Deck
k this deck
20
As confidence increases, precision generally decreases
Unlock Deck
Unlock for access to all 56 flashcards in this deck.
Unlock Deck
k this deck
21
When one is certain that an interval is a good one, one likely has high ______________.
A) confidence
B) validity
C) point estimate
D) none of the above
A) confidence
B) validity
C) point estimate
D) none of the above
Unlock Deck
Unlock for access to all 56 flashcards in this deck.
Unlock Deck
k this deck
22
How do point estimates compare to confidence intervals?
A) Correct point estimates would signal high precision, but point estimates tend to have lower confidence levels than do confidence intervals
B) Point estimates are more accurate than confidence intervals.
C) Point estimates are better for interval and ratio scales, where as confidence intervals are only useful for interval scales.
D) All of the above are correct ways to compare the two.
Unlock Deck
Unlock for access to all 56 flashcards in this deck.
Unlock Deck
k this deck
23
When calculating a confidence interval for a independent samples t-test instead of a one-sample t-test, which of the following best describes the difference in their calculations?
A) Instead of the population standard deviation, you use the sample standard deviation.
B) Instead of the population mean, you use the sample mean.
C) You use difference scores instead of the sample mean.
D) The critical values are different
A) Instead of the population standard deviation, you use the sample standard deviation.
B) Instead of the population mean, you use the sample mean.
C) You use difference scores instead of the sample mean.
D) The critical values are different
Unlock Deck
Unlock for access to all 56 flashcards in this deck.
Unlock Deck
k this deck
24
In the context of ANOVA, an eta-squared is used to portray which of the following?
A) The degree of statistical significance of mean differences
B) The necessary sample size to obtain a statistically significant result
C) The proportion of error variability in the population the study failed to account for.
D) The proportion of variability explained by one variable on another variable.
Unlock Deck
Unlock for access to all 56 flashcards in this deck.
Unlock Deck
k this deck
25
Use the data below for the following problem.
What is the eta-squared?
A) .16
B) .15
C) .17
D) .09
What is the eta-squared?
A) .16
B) .15
C) .17
D) .09
Unlock Deck
Unlock for access to all 56 flashcards in this deck.
Unlock Deck
k this deck
26
A doctor is examining differences between two treatments. He calculated a 95% confidence interval on the mean difference between the two groups. The interval ranged from -1.2 to 3.48. What does this suggest?
A) The mean difference is not significant at the .05 level
B) The mean difference has a small effect size
C) The mean difference is significant at the .05 level, but not at the .01 level.
D) The mean difference is not significant at the .05 level, but could still be significant at the .01 level.
A) The mean difference is not significant at the .05 level
B) The mean difference has a small effect size
C) The mean difference is significant at the .05 level, but not at the .01 level.
D) The mean difference is not significant at the .05 level, but could still be significant at the .01 level.
Unlock Deck
Unlock for access to all 56 flashcards in this deck.
Unlock Deck
k this deck
27
In general, when you calculate a 95% confidence interval instead of a 90% confidence interval, which of the following changes?
A) The width of the interval expands
B) The interval is more precise
C) The interval is more likely to capture the true value.
D) All of the above
A) The width of the interval expands
B) The interval is more precise
C) The interval is more likely to capture the true value.
D) All of the above
Unlock Deck
Unlock for access to all 56 flashcards in this deck.
Unlock Deck
k this deck
28
When calculating a Cohen's d in a dependent samples t-test what does it tell us?
A) The extent the two groups are correlated
B) The size of the difference in standard deviation units
C) The level of statistical significance
D) The probability the independent variable had a true effect on the dependent variable.
A) The extent the two groups are correlated
B) The size of the difference in standard deviation units
C) The level of statistical significance
D) The probability the independent variable had a true effect on the dependent variable.
Unlock Deck
Unlock for access to all 56 flashcards in this deck.
Unlock Deck
k this deck
29
What is the relationship between effect size and statistical significance?
A) Significant results have meaningful effect sizes. Effect sizes are meaningless without statistical significance.
B) Significance at alpha = .05 is always a smaller effect than significance at alpha = .01
C) There is no relationship between statistical significance and effect size whatsoever.
D) All else equal, larger effects are more likely to be significant.
Unlock Deck
Unlock for access to all 56 flashcards in this deck.
Unlock Deck
k this deck
30
Point estimates can be used to estimate which of the following values?
A) Population standard deviation
B) Population mean
C) The true effect size of a mean difference
D) All of the above
A) Population standard deviation
B) Population mean
C) The true effect size of a mean difference
D) All of the above
Unlock Deck
Unlock for access to all 56 flashcards in this deck.
Unlock Deck
k this deck
31
Which of the following constitutes a medium effect for a Cohen's d?
A) .3
B) .1
C) .9
D) .5
A) .3
B) .1
C) .9
D) .5
Unlock Deck
Unlock for access to all 56 flashcards in this deck.
Unlock Deck
k this deck
32
Which of the following most accurately describes A 95% confidence interval of a mean?
A) the sample has a 95% probability of capturing the true mean.
B) 95% of all samples will capture the true mean
C) 95% of the time, the true mean will be in the sample statistic
D) 95% of the sample means will be statistically significant.
A) the sample has a 95% probability of capturing the true mean.
B) 95% of all samples will capture the true mean
C) 95% of the time, the true mean will be in the sample statistic
D) 95% of the sample means will be statistically significant.
Unlock Deck
Unlock for access to all 56 flashcards in this deck.
Unlock Deck
k this deck
33
A researcher is interested whether an intervention successfully decreases prejudice in majority populations. When conducting an independent samples t-test, a researcher calculates the t-statistic with an alpha level of .05, and a 95% confidence interval of the mean difference. Which of the following is most likely true?
A) both procedures will lead to the same conclusion regarding statistical significance
B) both procedures will lead to a point estimate
C) both procedures may lead to difference results regarding whether the difference is statistically significant. This is because the traditional t-statistic is a point estimate and the confidence interval is an interval estimate.
D) The t-statistic and confidence interval will tell us fundamentally different information. The t-statistic compares mean differences, whereas the confidence interval will estimate the true effect size of the difference.
Unlock Deck
Unlock for access to all 56 flashcards in this deck.
Unlock Deck
k this deck
34
In a 3 x 4 ANOVA, how many partial eta-squared could one calculate?
A) 4
B) 3
C) 12
D) 2
A) 4
B) 3
C) 12
D) 2
Unlock Deck
Unlock for access to all 56 flashcards in this deck.
Unlock Deck
k this deck
35
How is this ANOVA best characterized and how many partial eta-squared are there for this factorial ANOVA?
A) 3 x 2 ANOVA with 3 partial eta-squared
B) 3 x 2 ANOVA with 2 partial eta-squared
C) 4 x 3 ANOVA with 3 partial eta-squared.
D) 2 x 2 ANOVA with 3 partial eta-squared
A) 3 x 2 ANOVA with 3 partial eta-squared
B) 3 x 2 ANOVA with 2 partial eta-squared
C) 4 x 3 ANOVA with 3 partial eta-squared.
D) 2 x 2 ANOVA with 3 partial eta-squared
Unlock Deck
Unlock for access to all 56 flashcards in this deck.
Unlock Deck
k this deck
36
What is the partial eta-squared for factor 1?
A) .58
B) .37
C) .38
D) .13
A) .58
B) .37
C) .38
D) .13
Unlock Deck
Unlock for access to all 56 flashcards in this deck.
Unlock Deck
k this deck
37
A researcher collects a sample of individuals' productivity by measuring the number of words they typed in an hour during a writing session with 20 individuals. The sample mean is 1738.2 words this week. The individuals from last week's 20 individuals only had a mean of 1553.7 words. The pooled variance is 11545.9.
Calculate the Cohen's d for this mean difference.
A) .02
B) 1.7
C) insufficient information
D) -.02
Calculate the Cohen's d for this mean difference.
A) .02
B) 1.7
C) insufficient information
D) -.02
Unlock Deck
Unlock for access to all 56 flashcards in this deck.
Unlock Deck
k this deck
38
The researcher calculates a 95% confidence interval for the mean difference. 0 is not captured in the interval. What would this suggest?
A) The mean difference is not significant
B) The mean difference is significant
C) The mean difference has little to no effect
D) The data is skewed because there are no negative values in the confidence interval of the mean difference.
A) The mean difference is not significant
B) The mean difference is significant
C) The mean difference has little to no effect
D) The data is skewed because there are no negative values in the confidence interval of the mean difference.
Unlock Deck
Unlock for access to all 56 flashcards in this deck.
Unlock Deck
k this deck
39
If you construct a 95% confidence interval around a sample mean and the 95% CI does not include the population mean, what would this suggest?
A) the observed mean is significant larger than the population mean
B) the observed mean is significantly smaller than the population mean
C) the observed mean is significantly different from the population mean
D) the observed mean is not significantly different from the population mean.
A) the observed mean is significant larger than the population mean
B) the observed mean is significantly smaller than the population mean
C) the observed mean is significantly different from the population mean
D) the observed mean is not significantly different from the population mean.
Unlock Deck
Unlock for access to all 56 flashcards in this deck.
Unlock Deck
k this deck
40
Cohen's d is the effect size often reported for an independent samples t-test. How does the calculation for Cohen's d compare to the calculation of a t-statistic?
A) Cohen's d uses pooled standard error and the t-statistic does not
B) Cohen's d is not directly influenced by the size of the sample, but the t-statistic is.
C) Cohen's d uses the pooled standard deviation whereas the t-statistic does not require a measure of variability.
D) Cohen's d is a measure of how likely the mean is to differ from a null population, whereas the t-statistic is a measure of how big the mean difference is in units of variability.
Unlock Deck
Unlock for access to all 56 flashcards in this deck.
Unlock Deck
k this deck
41
Suppose that the population mean for IQ is 100 with a standard deviation of 15. A researcher is testing a group 25 of talented youth. His sample has a mean of 112 with a standard deviation of 14.
What is the 95% confidence interval of the mean?
A) 106.2 - 117.8
B) 82.6 - 141.4
C) 84.56 - 139.44
D) 104.7 - 119.3
What is the 95% confidence interval of the mean?
A) 106.2 - 117.8
B) 82.6 - 141.4
C) 84.56 - 139.44
D) 104.7 - 119.3
Unlock Deck
Unlock for access to all 56 flashcards in this deck.
Unlock Deck
k this deck
42
Suppose that the population mean for IQ is 100 with a standard deviation of 15. A researcher is testing a group 25 of talented youth. His sample has a mean of 112 with a standard deviation of 14.
What does the CI tell us about the sample of young talented youth?
A) The youth have IQs comparable to that of the population
B) There is no evidence that the youth's IQ are higher than that of the general population
C) There is insufficient information to make any claims about the sample based on a 95% confidence interval.
D) The youth are indeed talented as their average IQ is significantly higher than that of the population at the alpha = .05 level
Unlock Deck
Unlock for access to all 56 flashcards in this deck.
Unlock Deck
k this deck
43
If a one-way ANOVA has an eta squared of .24 means that…
A) the mean difference is .24 standard deviations units large.
B) the independent variable accounts for 24% of the variance in the dependent variable
C) there is a 24% chance that the independent variable caused the dependent variable
D) the independent variable and dependent variable have more than 24% overlap
Unlock Deck
Unlock for access to all 56 flashcards in this deck.
Unlock Deck
k this deck
44
Which of the following reasons best explains the value of effect sizes?
A) Significant effects always have large effects
B) Significant effects don't always have large effects. In fact, they can have very small effects
C) Large effects tend to be significant
D) Effect sizes communicate something different than significance testing. They inform the researcher or scientist whether or not the findings can generalize to the population or not.
Unlock Deck
Unlock for access to all 56 flashcards in this deck.
Unlock Deck
k this deck
45
Which of the following partial eta-squared is the closest to the cut off of a large effect?
A) .28
B) .40
C) .80
D) .10
A) .28
B) .40
C) .80
D) .10
Unlock Deck
Unlock for access to all 56 flashcards in this deck.
Unlock Deck
k this deck
46
A 99% confidence interval is ____________ than a 95% confidence interval
A) less precise
B) wider
C) more likely to capture the truth
D) all of the above
A) less precise
B) wider
C) more likely to capture the truth
D) all of the above
Unlock Deck
Unlock for access to all 56 flashcards in this deck.
Unlock Deck
k this deck
47
Below are the data of an course that prepares students for standardized testing. The data below show pretest (test on day 1) and a post test (test after taking the course) scores of students who enrolled. Use this data to answer the following questions.
Calculate the 95% confidence interval for the mean difference
Calculate the 95% confidence interval for the mean difference Unlock Deck
Unlock for access to all 56 flashcards in this deck.
Unlock Deck
k this deck
48
Below are the data of an course that prepares students for standardized testing. The data below show pretest (test on day 1) and a post test (test after taking the course) scores of students who enrolled. Use this data to answer the following questions.
Calculate cohen's d
Calculate cohen's d Unlock Deck
Unlock for access to all 56 flashcards in this deck.
Unlock Deck
k this deck
49
A research team collects data from two groups, in one group, they administered a learning task that provided feedback (i.e., telling the participant if they were right or wrong) and in the other, the participants were not provided with feedback. The research team is interested in the number of trials the participants spent learning as a function of their independent variable. Below are the number of trials each participant spent. Use it to answer the following questions.
Calculate the 95% confidence interval of the mean difference
Calculate the 95% confidence interval of the mean difference Unlock Deck
Unlock for access to all 56 flashcards in this deck.
Unlock Deck
k this deck
50
A research team collects data from two groups, in one group, they administered a learning task that provided feedback (i.e., telling the participant if they were right or wrong) and in the other, the participants were not provided with feedback. The research team is interested in the number of trials the participants spent learning as a function of their independent variable. Below are the number of trials each participant spent. Use it to answer the following questions.
What is the Cohen's d?
What is the Cohen's d? Unlock Deck
Unlock for access to all 56 flashcards in this deck.
Unlock Deck
k this deck
51
A researcher is examining three different types of treatment on individuals who suffer from major depression. Below are the data, use it to answer the following questions
calculate the eta-squared
calculate the eta-squared Unlock Deck
Unlock for access to all 56 flashcards in this deck.
Unlock Deck
k this deck
52
A researcher is examining three different types of treatment on individuals who suffer from major depression. Below are the data, use it to answer the following questions
Characterize the size of this effect
Characterize the size of this effect Unlock Deck
Unlock for access to all 56 flashcards in this deck.
Unlock Deck
k this deck
53
Use the source table below to answer the following questions
How many total eta-squared are there for this factorial ANOVA?
How many total eta-squared are there for this factorial ANOVA? Unlock Deck
Unlock for access to all 56 flashcards in this deck.
Unlock Deck
k this deck
54
Use the source table below to answer the following questions
Calculate each eta-squared
Calculate each eta-squared Unlock Deck
Unlock for access to all 56 flashcards in this deck.
Unlock Deck
k this deck
55
The population average for number of children per household is 2.4 in a particular country with a standard deviation of 1.1. A research is conducting research in a neighborhood that has relatively low socioeconomic status. Her sample of 40 families averages at 3.3 children.
construct a 95% confidence interval around the sample mean.
construct a 95% confidence interval around the sample mean.
Unlock Deck
Unlock for access to all 56 flashcards in this deck.
Unlock Deck
k this deck
56
The population average for number of children per household is 2.4 in a particular country with a standard deviation of 1.1. A research is conducting research in a neighborhood that has relatively low socioeconomic status. Her sample of 40 families averages at 3.3 children.
what does the confidence interval tell you?
what does the confidence interval tell you?
Unlock Deck
Unlock for access to all 56 flashcards in this deck.
Unlock Deck
k this deck
Unlock Deck
Unlock for access to all 56 flashcards in this deck.


