Deck 4: Financial Performance and Risk Analysis for Depository Institutions
Full screen (f)
Question
Using the information below, explain specifically why Heritage Bank's OROA went down in 2006, and why its OROA was lower than the PG3 in 2006. Note each item is as a % of average total assets, for instance IR% is interest revenue to average total assets, IE% is interest expense to average total assets, NIM is the net interest margin, NIR% is non-interest revenue to average total assets, NIE% is non-interest expense to average total assets, PLL% is the provision of loan losses to average total assets, and OROA is operating income to average total assets.

Question
Question
Question
Burden Analysis: Analyze the trends and compare the Burden of Heritage Bank to the PG3. What weaknesses does this reveal for Heritage Bank?
Question
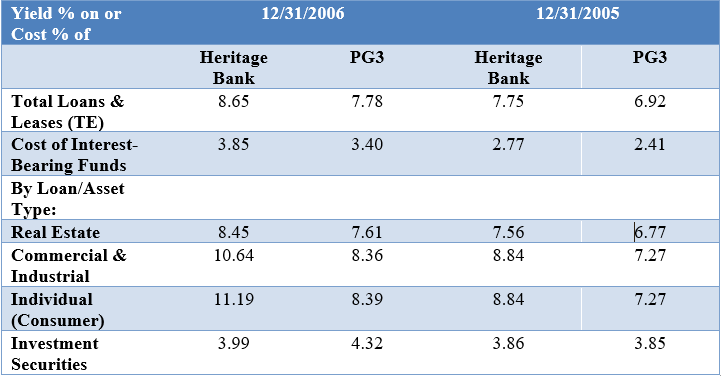
Net Interest Margin Analysis: Evaluate rends difference in rate and mix for Heritage's loans and loan rates compared to the PG3. Analyze Heritages differences in its IR% compared to the PG3 based on both rate and mix differences.
Question
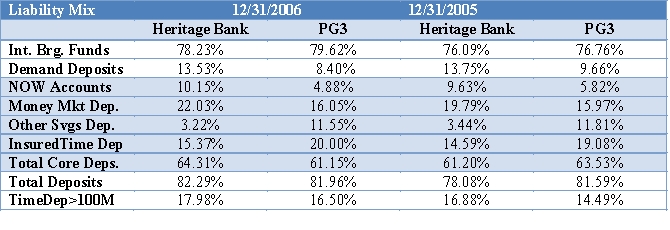
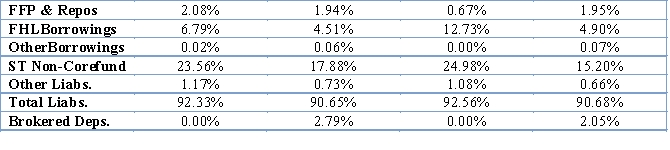
Analyze the Liability Mix and Rate Differences for Heritage Bank and the PG3 to explain differences and trends in IE%.
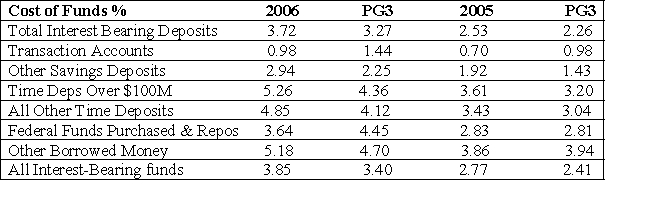
 Other Liabilities:
Other Liabilities: Question
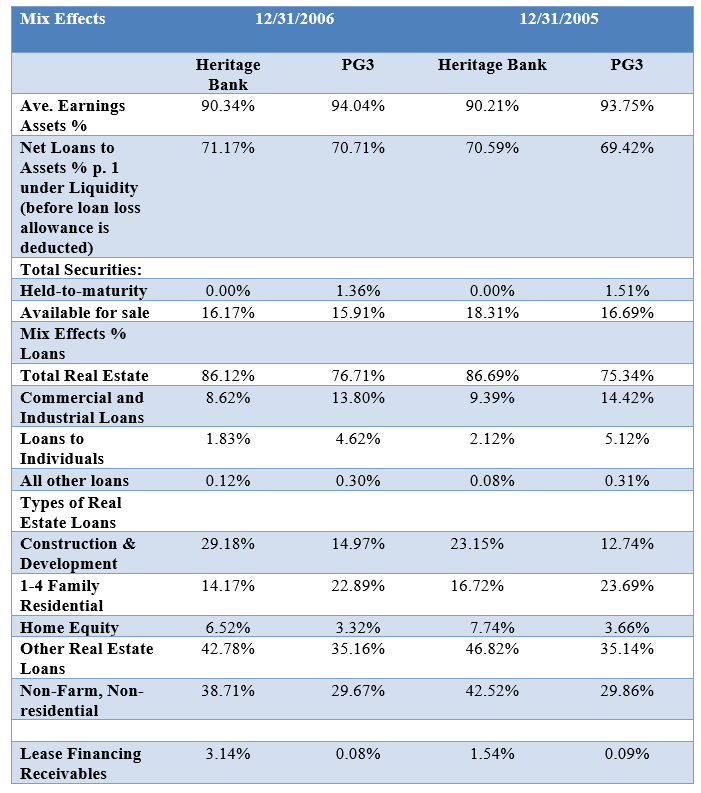
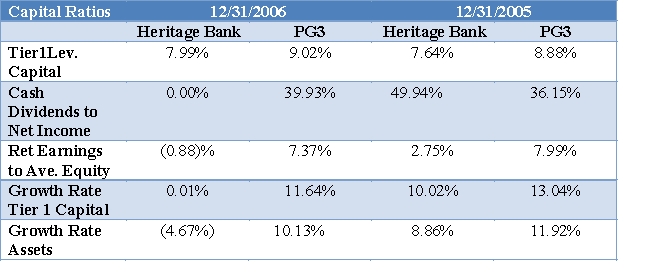
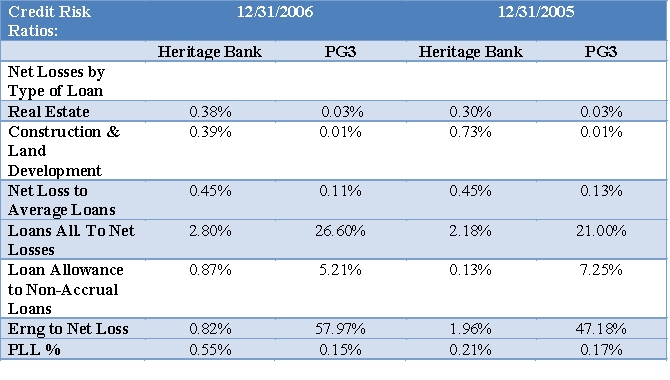
Evaluate Heritage's capital and credit using the ratios provided on the Tables below. Include in your analysis for credit risk the mix of Heritage Bank's loans shown below. Evaluate trends and compare these to the PG3. How does Heritage compare to the PG3 on respectively capital and credit risk? Cite specific ratios in your analysis.
 Asset Mix and Loan Mix for Heritage Bank % of average earning assets:
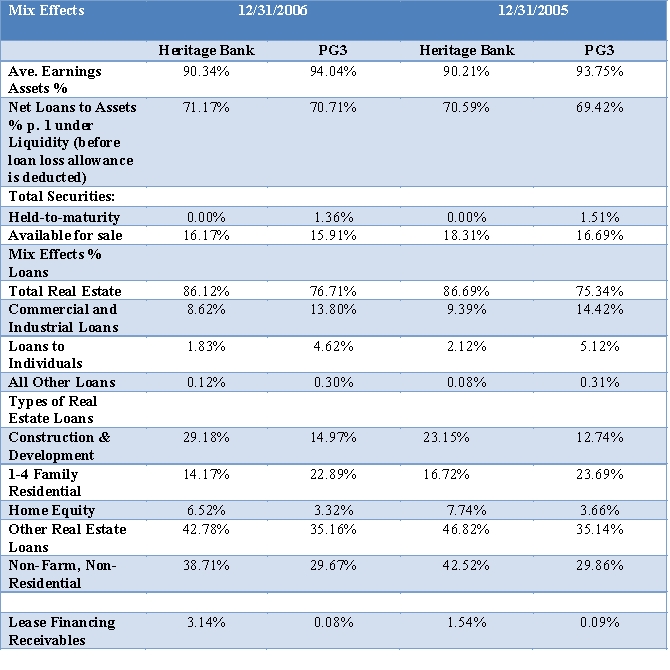
Asset Mix and Loan Mix for Heritage Bank % of average earning assets: Question
Analyze the Liquidity Risk of Heritage Bank from both an asset and liability and off balance sheet risk perspective (see asset mix for assets and loans above).


Question
Question
Question
Question
Question
Question
Question
Question
Question
Question
Question
Question
Question
Question
Question
Question
Question
Question
Question
Question
Question

Unlock Deck
Sign up to unlock the cards in this deck!
Unlock Deck
Unlock Deck
1/29
Play
Full screen (f)
Deck 4: Financial Performance and Risk Analysis for Depository Institutions
1
Using the information below, explain specifically why Heritage Bank's OROA went down in 2006, and why its OROA was lower than the PG3 in 2006. Note each item is as a % of average total assets, for instance IR% is interest revenue to average total assets, IE% is interest expense to average total assets, NIM is the net interest margin, NIR% is non-interest revenue to average total assets, NIE% is non-interest expense to average total assets, PLL% is the provision of loan losses to average total assets, and OROA is operating income to average total assets.
Heritage Bank (HB) OROA fell from 0.54% in 2005 to -0.25% in 2006. This was the result of a fall in HB's NIM%, a rise in its Burden%, and a large rise in its PLL%, and a small fall in its realized gain/losses on securities. The NIM fell by about 0.15%. The rise in the Burden% by 0.18% in 2006 with a large fall in the NIR% despite a small fall in the NIE%. The rise in the PLL% was 0.34% as a large contributor to the fall in the OROA in 2006.
Heritage Bank's OROA is lower than the PG3 both years. In 2006, HB's OROA is lower as the result of a much higher Burden % (lower NIR% and higher NIE%) and a higher PLL%, despite a slightly higher NIM% and slightly higher realized gain/loss on securities than its peers.
Heritage Bank's OROA is lower than the PG3 both years. In 2006, HB's OROA is lower as the result of a much higher Burden % (lower NIR% and higher NIE%) and a higher PLL%, despite a slightly higher NIM% and slightly higher realized gain/loss on securities than its peers.
2
Examine the trends in the NIM and IR% and IE% for Heritage Bank and explain why Heritage Bank's NIM fell in 2006. What type of funding gap does Heritage Bank likely have, with rates rising in 2006? How does Heritage's NIM and IR% and IE% and interest rate risk compare relative to the PG3?
The fall in the NIM% was by about 0.15%, with rates rising and a larger rise in the IE% by 0.86% than the IR% by 0.71%. This suggests a negative funding for HB, with a larger rise in the IE% than the IR% with the rise in rates. HB has a higher IR% and a higher IE% than the PG3, resulting in a slightly higher by 0.04% NIM%. Hence, Heritage Bank has a higher IR% as a strength, but a higher IE% as a weakness relative to the PG3. The PG3 had only a 0.02% drop in NIM with the rise in rates in 2006, suggesting a more hedged funding gap with the PG3 IR% rising by a similar amount to the rise in the IE%.
3
Do a Dupont Analysis where ROA = AU x NPM. Given the information above, calculate the asset utilization (AU), total revenues/total assets for Heritage Bank and the PG3 each year by adding the IR% and NIR%. Then calculate the NPMs for Heritage Bank and the PG3 each year (where NPM = OROA / (AU as a fraction). Analyze the trends for Heritage in NPM and AU to explain its lower OROA in 2006. Also compare Heritage's NPM and AU to the PG3, and discuss any weaknesses revealed in the comparison.
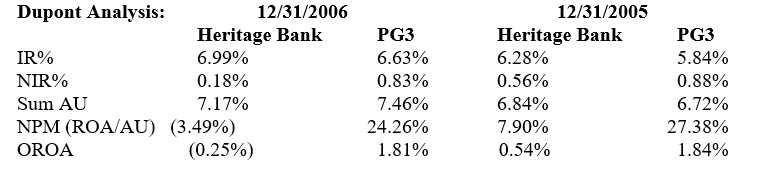
*** Note AU% = IR% + NIR% and NPM = ROA% / AU as a fraction
Analysis:
Heritage Bank had a rise in AU, because of the rise in IR% despite a fall in the NIR% in 2016, but a large fall in NPM, which was negative in 2006 resulting in the large negative OROA.
Heritage Bank's OROA was lower than the PG3 each year, with a much lower NPM, and in 2006 a lower AU. The lower AU in 2006 was the result of the much lower NIR%, despite HB's higher IR%. In contrast, the PG3 had only a slight 0.03% drop in OROA in 2006 as the result of a lower NPM, with a rise in AU.
In terms of weaknesses Heritage Bank has a lower NIR% resulting in lower AU, and a much higher NIE% and much higher PLL% and a higher IE% than the PG3. In terms of strengths, the only strength is a higher IR% and a small but higher security gain and loss % in 2006
4
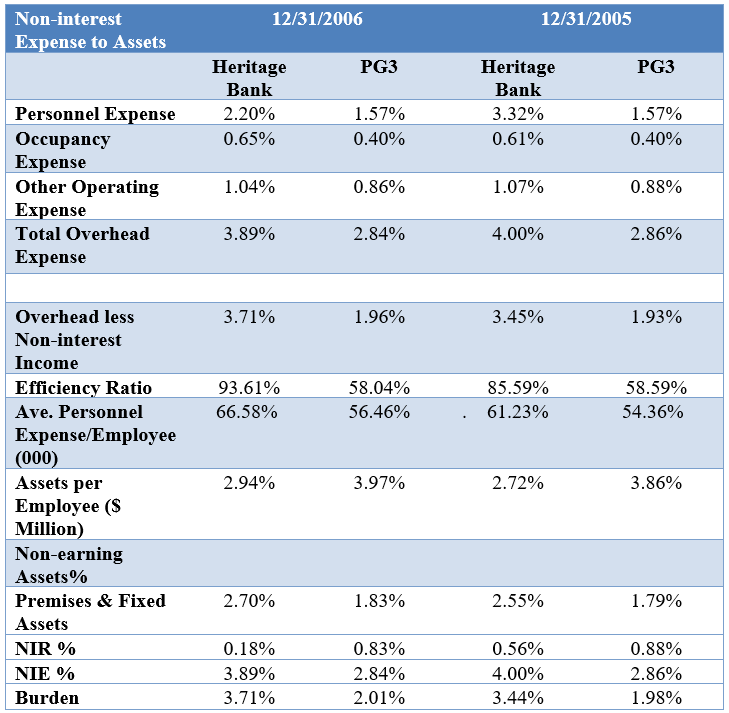
Burden Analysis: Analyze the trends and compare the Burden of Heritage Bank to the PG3. What weaknesses does this reveal for Heritage Bank?
Unlock Deck
Unlock for access to all 29 flashcards in this deck.
Unlock Deck
k this deck
5
Net Interest Margin Analysis: Evaluate rends difference in rate and mix for Heritage's loans and loan rates compared to the PG3. Analyze Heritages differences in its IR% compared to the PG3 based on both rate and mix differences.
Unlock Deck
Unlock for access to all 29 flashcards in this deck.
Unlock Deck
k this deck
6
Analyze the Liability Mix and Rate Differences for Heritage Bank and the PG3 to explain differences and trends in IE%.
Other Liabilities:
Other Liabilities: Unlock Deck
Unlock for access to all 29 flashcards in this deck.
Unlock Deck
k this deck
7
Evaluate Heritage's capital and credit using the ratios provided on the Tables below. Include in your analysis for credit risk the mix of Heritage Bank's loans shown below. Evaluate trends and compare these to the PG3. How does Heritage compare to the PG3 on respectively capital and credit risk? Cite specific ratios in your analysis.
Asset Mix and Loan Mix for Heritage Bank % of average earning assets:
Asset Mix and Loan Mix for Heritage Bank % of average earning assets: Unlock Deck
Unlock for access to all 29 flashcards in this deck.
Unlock Deck
k this deck
8
Analyze the Liquidity Risk of Heritage Bank from both an asset and liability and off balance sheet risk perspective (see asset mix for assets and loans above).
Unlock Deck
Unlock for access to all 29 flashcards in this deck.
Unlock Deck
k this deck
9
Conclusion: Summarize Heritage's weaknesses and strengths from your analysis with a summary of its risks and performance compared to the PG3 and trends in 2005 and 2006. Give your suggestions for improvement, and also access whether you would invest in Heritage Bank based on your analysis.
Unlock Deck
Unlock for access to all 29 flashcards in this deck.
Unlock Deck
k this deck
10
If a bank has an ROA of 1.2% and Tier 1 Leverage Capital Ratio of .20% (i.e., .20 as a fraction) as a proxy for equity to total assets, what is the bank's ROE?
A) ROE of 6%
B) ROE of 12%
C) ROE of 18%
D) ROE of 20%
A) ROE of 6%
B) ROE of 12%
C) ROE of 18%
D) ROE of 20%
Unlock Deck
Unlock for access to all 29 flashcards in this deck.
Unlock Deck
k this deck
11
The Board of Directors of the 1st National Bank of Sydney Elizabeth has approved the following target ratios:
(1) A Target ROE after taxes of 16%; and (2) A Target equity to assets ratio of 8.33% (i.e. and EM of 12). The bank has total assets of $850 million, a Burden of $11.5 million, a Provision for Loan Losses of $1 million, and a marginal tax rate of 35%.
What target ROA after taxes and target NIM before taxes does the bank need to reach its target ROE?
A) ROA of 1.92%; NIM of 2.80%
B) ROA of 5.00%; NIM of 8.00%
C) ROA of 1.33%; NIM of 3.52%
D) ROA of 10.0%; NIM of 15%
Unlock Deck
Unlock for access to all 29 flashcards in this deck.
Unlock Deck
k this deck
12
Excess reserves held by banks with the Federal Reserve that are traded at market rates between financial institutions and held as short-term assets by the lending bank and as short-term liabilities by the borrowing bank are called:
A) Pledged Deposits
B) Negotiable Certificates of Deposit (CDs)
C) Fed Funds Sold and Fed Funds Purchased
D) Trading Securities
A) Pledged Deposits
B) Negotiable Certificates of Deposit (CDs)
C) Fed Funds Sold and Fed Funds Purchased
D) Trading Securities
Unlock Deck
Unlock for access to all 29 flashcards in this deck.
Unlock Deck
k this deck
13
A full Dupont Analysis including ROA and ROE recognizes the effects of which of the following in determining a firm's ROE:
A) Cost efficiency as indicated by the NPM
B) Revenue Generation as indicated by Asset Utilization
C) Financial Leverage as indicated by the Equity Multiplier
D) All of the above
A) Cost efficiency as indicated by the NPM
B) Revenue Generation as indicated by Asset Utilization
C) Financial Leverage as indicated by the Equity Multiplier
D) All of the above
Unlock Deck
Unlock for access to all 29 flashcards in this deck.
Unlock Deck
k this deck
14
The Beautiful Bank of Bonita, California, has the following accounting items for each year:
Solve for ROE, ROA, NPM, AU, and EM and analyze based on a Dupont Analysis why the ROE went down for the current year. Which are the correct reasons for the lower ROE based on your analysis?
A) A lower NPM, lower AU, and lower EM
B) A lower AU and a lower EM
C) A lower NPM and a lower AU
D) A lower NPM and a lower EM
Unlock Deck
Unlock for access to all 29 flashcards in this deck.
Unlock Deck
k this deck
15
Given the following information, which statement(s) is correct about the Olympic Bank's liquidity risk compared to its peer banks:
A) Olympic Bank has more liquidity risk on the asset side than its peers.
B) Olympic Bank has more liquidity risk on the liability side than its peers.
C) Olympic Bank has more liquidity risk on the off-balance side than its peers.
D) All of the above.
A) Olympic Bank has more liquidity risk on the asset side than its peers.
B) Olympic Bank has more liquidity risk on the liability side than its peers.
C) Olympic Bank has more liquidity risk on the off-balance side than its peers.
D) All of the above.
Unlock Deck
Unlock for access to all 29 flashcards in this deck.
Unlock Deck
k this deck
16
A bank that makes primarily consumer loans will likely have more consumer (core deposits) than a bank that makes primarily business loans.
Unlock Deck
Unlock for access to all 29 flashcards in this deck.
Unlock Deck
k this deck
17
Commercial banks compared to savings institutions and credit unions tend to have a larger percentage of commercial loans and to be more diversified in terms of the types of loans held. Commercial banks also tend to have higher non-interest revenues than credit unions and savings institutions.
Unlock Deck
Unlock for access to all 29 flashcards in this deck.
Unlock Deck
k this deck
18
The Blue Moon Bank has the following trends. Which statement is the most correct based on the information provided?
A) The OROA went down with a lower NIM%, despite a lower Burden%, and the PLL% staying the same.
B) The OROA went down, because of a higher Burden % with a rise in the NIE% and fall in the NIE%, despite a rise in NIM% and the PLL% staying the same.
C) The OROA went up because of a higher NIM%, lower Burden%, and the PLL% staying the same.
D) The OROA went down because of a higher PLL%, despite a higher NIM% and lower Burden %.
Unlock Deck
Unlock for access to all 29 flashcards in this deck.
Unlock Deck
k this deck
19
If a bank switches the mix of its assets to a larger percentage of short-term securities and a smaller percentage of loans, which of the following answer(s) are correct?
A) The bank will have lower liquidity risk on the asset side.
B) The bank will likely have lower asset utilization.
C) The bank will likely have lower interest revenues.
D) All of the above are correct.
A) The bank will have lower liquidity risk on the asset side.
B) The bank will likely have lower asset utilization.
C) The bank will likely have lower interest revenues.
D) All of the above are correct.
Unlock Deck
Unlock for access to all 29 flashcards in this deck.
Unlock Deck
k this deck
20
The Frost Bank has lost a large percentage of its retail (core) insured deposits and has had to rely more on uninsured certificates of deposits and other short-term borrowings. Which of the following statements is false?
A) The bank will have higher liquidity on the liability side.
B) The bank will have lower liquidity risk on the liability side.
C) The bank will likely have a higher interest expense.
D) None of the above.
A) The bank will have higher liquidity on the liability side.
B) The bank will have lower liquidity risk on the liability side.
C) The bank will likely have a higher interest expense.
D) None of the above.
Unlock Deck
Unlock for access to all 29 flashcards in this deck.
Unlock Deck
k this deck
21
A margin analysis of NIM examines reasons for changes in interest revenues to assets (IR%) and changes in interest expenses to assets (IE%). The changes are a function of which of the following:
A) Volume changes that occur with growth in assets and the % of earning assets to total assets.
B) Rate changes with a rise or fall in rates on individual balance sheet items.
C) Balance sheet composition (mix) changes.
D) All of the above.
A) Volume changes that occur with growth in assets and the % of earning assets to total assets.
B) Rate changes with a rise or fall in rates on individual balance sheet items.
C) Balance sheet composition (mix) changes.
D) All of the above.
Unlock Deck
Unlock for access to all 29 flashcards in this deck.
Unlock Deck
k this deck
22
Very large banks often have on average a lower ROA and lower NIM, but have a higher EM than smaller banks. Very large banks also tend to have a higher NIR%, but lower % of core deposit financing than smaller banks.
Unlock Deck
Unlock for access to all 29 flashcards in this deck.
Unlock Deck
k this deck
23
Since Credit Unions (CUs) are non-profit and non-taxed organizations, they can often offer lower average fees and favorable (low loan rates and higher deposit rates), with goals of satisfying CU members (depositors as implicit owners of CUs). Federally chartered CUs are insured by the National Credit Union Share Insurance Fund (NCUSIF). Credit Unions are required to have a common bond requirement, and make predominantly consumer and home mortgage loans.
Unlock Deck
Unlock for access to all 29 flashcards in this deck.
Unlock Deck
k this deck
24
Savings institutions (savings banks and savings and loans) are predominantly home mortgage and real estate loan lenders. Hence, at times they have greater interest rate risk than other depository institutions, since home mortgages can be fixed rate with longer maturities, and are generally primarily financed by shorter-term deposits, resulting in a negative funding gap.
Unlock Deck
Unlock for access to all 29 flashcards in this deck.
Unlock Deck
k this deck
25
An analysis of a bank's Burden should include a close look at trends in different types of expenses and the bank's overall efficiency ratio. A bank with a higher overall efficiency ratio is more efficient than another bank in its operations.
Unlock Deck
Unlock for access to all 29 flashcards in this deck.
Unlock Deck
k this deck
26
If a bank has a positive funding gap, with a larger amount of rate sensitive assets than rate sensitive liabilities for a given time period, such as year, the bank has the risk of a fall in its NIM, if rates go up.
Unlock Deck
Unlock for access to all 29 flashcards in this deck.
Unlock Deck
k this deck
27
In analyzing a bank's credit risk, it's important not only to look at a bank's net loss percentage and non-current loan percentage, earnings coverage ratio, and loan allowance to net loan losses ratios, but also important to look at the bank's loan mix, including examining the % of more risky types of loans a bank has such as other real estate loans and construction and development loans.
Unlock Deck
Unlock for access to all 29 flashcards in this deck.
Unlock Deck
k this deck
28
If a bank has a higher growth in assets than the growth in equity, the bank's equity to assets ratio will likely be higher than the previous year.
Unlock Deck
Unlock for access to all 29 flashcards in this deck.
Unlock Deck
k this deck
29
A bank with a high percentage of brokered deposits has less liquidity risk than a bank with a low percentage of brokered deposits.
Unlock Deck
Unlock for access to all 29 flashcards in this deck.
Unlock Deck
k this deck
Unlock Deck
Unlock for access to all 29 flashcards in this deck.


