Deck 18: Correlation and Regression
Full screen (f)
Question
What (approximate) correlation is shown in the following scatterplot:
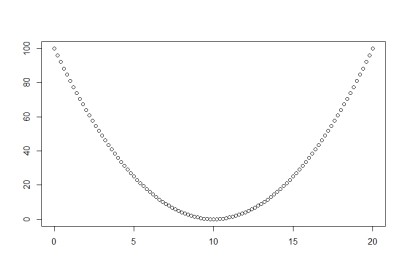
A) 0.50
B) 1.00
C) Impossible to say without the data.
D) 0.00
A) 0.50
B) 1.00
C) Impossible to say without the data.
D) 0.00
Question
Question
Question
Question
Question
Question
Question
Question
Question
Question
Question
Question
Question
Question
Question
Question
Question
Ladislaus Bortkiewicz famously looked at the number of Prussian soldiers who had been kicked to death by horses over about 200 years. He found a distribution that looked like this:
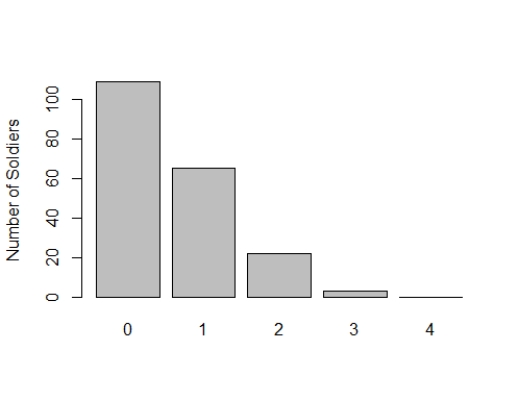 In most years (109) no Prussian soldiers were killed by horses. In 65 years, only one soldier died this way, until in one particularly bad year, 4 Prussian soldiers were killed by horses. If you wanted to predict this variable, what would you use?
A) Spearman correlation.
B) Non-linear regression.
C) Poisson regression.
D) Logistic regression.
In most years (109) no Prussian soldiers were killed by horses. In 65 years, only one soldier died this way, until in one particularly bad year, 4 Prussian soldiers were killed by horses. If you wanted to predict this variable, what would you use?A) Spearman correlation.
B) Non-linear regression.
C) Poisson regression.
D) Logistic regression.
Question
Question

Unlock Deck
Sign up to unlock the cards in this deck!
Unlock Deck
Unlock Deck
1/20
Play
Full screen (f)
Deck 18: Correlation and Regression
1
What (approximate) correlation is shown in the following scatterplot:
A) 0.50
B) 1.00
C) Impossible to say without the data.
D) 0.00
A) 0.50
B) 1.00
C) Impossible to say without the data.
D) 0.00
D
2
A researcher wants to examine the relationship between students' height, and the size of a box that they can jump over. Unfortunately, some of the students can't jump over the smallest box. This is an example of:
A) A floor effect.
B) A ceiling effect.
C) Outliers.
D) Measurement error.
A) A floor effect.
B) A ceiling effect.
C) Outliers.
D) Measurement error.
A
3
If we find a negative relationship between owning a cat and being a victim of a burglar (such that people who have cats are less likely to have their possessions stolen), what can we conclude:
A) Thieves like cats.
B) If you have a cat, your home is less likely to be robbed.
C) If you get a cat, your home is less likely to be robbed.
D) Cats don't like thieves.
A) Thieves like cats.
B) If you have a cat, your home is less likely to be robbed.
C) If you get a cat, your home is less likely to be robbed.
D) Cats don't like thieves.
B
(We don't know what it is about homes with cats, but getting a cat will not necessarily mean your home has the characteristics that deter thieves).
(We don't know what it is about homes with cats, but getting a cat will not necessarily mean your home has the characteristics that deter thieves).
4
A researcher finds that orchestra conductors tend to die at an older age than other members of the orchestra. What can they conclude?
A) Conducting orchestras is good for your health (swinging arms is good exercise).
B) Healthy people become conductors.
C) People who enjoy leading a healthy lifestyle like conducting orchestras.
D) None of these.
A) Conducting orchestras is good for your health (swinging arms is good exercise).
B) Healthy people become conductors.
C) People who enjoy leading a healthy lifestyle like conducting orchestras.
D) None of these.
Unlock Deck
Unlock for access to all 20 flashcards in this deck.
Unlock Deck
k this deck
5
We should be concerned about possible outliers because:
A) Outliers mean that we have a non-linear relationship.
B) Outliers mean that our data is skewed.
C) Outliers might represent an error in our measurement.
D) Outliers mean that someone has not told the truth when they responded to our questions.
A) Outliers mean that we have a non-linear relationship.
B) Outliers mean that our data is skewed.
C) Outliers might represent an error in our measurement.
D) Outliers mean that someone has not told the truth when they responded to our questions.
Unlock Deck
Unlock for access to all 20 flashcards in this deck.
Unlock Deck
k this deck
6
Using Cohen's criteria, we would describe a correlation of 0.1 as:
A) Not statistically significant.
B) Small.
C) Interesting.
D) Medium.
A) Not statistically significant.
B) Small.
C) Interesting.
D) Medium.
Unlock Deck
Unlock for access to all 20 flashcards in this deck.
Unlock Deck
k this deck
7
Using Cohen's criteria we would describe a correlation of r = 0.48 as:
A) Significant.
B) Large.
C) Medium.
D) Causal.
A) Significant.
B) Large.
C) Medium.
D) Causal.
Unlock Deck
Unlock for access to all 20 flashcards in this deck.
Unlock Deck
k this deck
8
Which of the following sets of values could occur with a real dataset:
A) r = 0.7; 95% CIs = 0.4, 1.1; p = 0.001
B) r = 0.0; 95% CIs = -0.2, 0.2; p = 0.03
C) r = 0.1, 95% CIs = -0.1, 0.3; p = 0.20
D) r = 0.1, 95% CIs = 0.0, 0.2; p = 0.01
A) r = 0.7; 95% CIs = 0.4, 1.1; p = 0.001
B) r = 0.0; 95% CIs = -0.2, 0.2; p = 0.03
C) r = 0.1, 95% CIs = -0.1, 0.3; p = 0.20
D) r = 0.1, 95% CIs = 0.0, 0.2; p = 0.01
Unlock Deck
Unlock for access to all 20 flashcards in this deck.
Unlock Deck
k this deck
9
Which of the following is true:
A) If I have two variables, and they are both normally distributed, I will have bivariate normality.
B) If I have two variables and they are both normally distributed, I may have bivariate normality, or I may not.
C) If I have two variables and they are both normally distributed, I will not have bivariate normality.
D) If I have two variables, and they are not normally distributed, I still could have bivariate normality.
Unlock Deck
Unlock for access to all 20 flashcards in this deck.
Unlock Deck
k this deck
10
You should use a Spearman correlation, rather than a Pearson correlation, if:
A) Your data are measured on an interval scale.
B) Your data have no outliers.
C) Your data do not have a normal distribution.
D) You are not interested in statistical significance.
A) Your data are measured on an interval scale.
B) Your data have no outliers.
C) Your data do not have a normal distribution.
D) You are not interested in statistical significance.
Unlock Deck
Unlock for access to all 20 flashcards in this deck.
Unlock Deck
k this deck
11
Regression analysis, rather than correlation might be used when:
A) We don't know if there is a third variable that is the cause of both our variables.
B) We want to establish causation.
C) We don't care about causation.
D) We want to make predictions.
A) We don't know if there is a third variable that is the cause of both our variables.
B) We want to establish causation.
C) We don't care about causation.
D) We want to make predictions.
Unlock Deck
Unlock for access to all 20 flashcards in this deck.
Unlock Deck
k this deck
12
Which of the following is true:
A) It is usually worth testing the intercept in a regression equation for statistical significance.
B) We should never test the intercept in a regression equation for statistical significance.
C) The intercept in a regression equation is never interesting.
D) The intercept in a regression is often an arbitrary value.
Unlock Deck
Unlock for access to all 20 flashcards in this deck.
Unlock Deck
k this deck
13
Two researchers look at the relationship between the number of visits to the doctor with flu, and the temperature in different cities. They use the same data, but one researcher uses the Fahrenheit scale of temperature, and one uses the Celsius (centigrade scale). What would you expect:
A) Same correlation, same slope, different intercept.
B) Same correlation, different slope, different intercept.
C) Different correlation, different slope, different intercept.
D) Same correlation, same slope, same intercept.
A) Same correlation, same slope, different intercept.
B) Same correlation, different slope, different intercept.
C) Different correlation, different slope, different intercept.
D) Same correlation, same slope, same intercept.
Unlock Deck
Unlock for access to all 20 flashcards in this deck.
Unlock Deck
k this deck
14
A standardized regression line (in a bivariate regression) is:
A) Rarely useful.
B) Always worth looking at, even if you don't report it.
C) Another name for the correlation.
D) Easy to calculate if you know the slope and intercept.
A) Rarely useful.
B) Always worth looking at, even if you don't report it.
C) Another name for the correlation.
D) Easy to calculate if you know the slope and intercept.
Unlock Deck
Unlock for access to all 20 flashcards in this deck.
Unlock Deck
k this deck
15
A researcher looks at the relationship between the scores for reading and age (in years) , for children in primary (elementary) school. The reading has 20 questions, so a score between 0 and 20 is possible. They find that the intercept = -5 and the slope = 2. What should they conclude?
A) Older children get higher scores on the test.
B) The predicted score of a 3 year old child would be 6.
C) You can't score -5 on the test, so they have made a mistake.
D) If they gave a 12 year old the test, they would expect a score of 24.
A) Older children get higher scores on the test.
B) The predicted score of a 3 year old child would be 6.
C) You can't score -5 on the test, so they have made a mistake.
D) If they gave a 12 year old the test, they would expect a score of 24.
Unlock Deck
Unlock for access to all 20 flashcards in this deck.
Unlock Deck
k this deck
16
The standard error of a correlation coefficient is:
A) A mistake that is commonly made by students.
B) A mistake that is rarely made by professors.
C) Not really a thing that is talked about.
D) Usually small.
A) A mistake that is commonly made by students.
B) A mistake that is rarely made by professors.
C) Not really a thing that is talked about.
D) Usually small.
Unlock Deck
Unlock for access to all 20 flashcards in this deck.
Unlock Deck
k this deck
17
A researcher assesses the smoking and drinking habits of a group of retired ex-coal miners, and also assesses their grip strength. The researcher finds that the miners who smoke and drink more have higher strength. What can they conclude:
A) Smoking and drinking make you stronger.
B) People who exercise more smoke and drink more.
C) This can't be true.
D) There is probably a third variable that we have not accounted for.
A) Smoking and drinking make you stronger.
B) People who exercise more smoke and drink more.
C) This can't be true.
D) There is probably a third variable that we have not accounted for.
Unlock Deck
Unlock for access to all 20 flashcards in this deck.
Unlock Deck
k this deck
18
Ladislaus Bortkiewicz famously looked at the number of Prussian soldiers who had been kicked to death by horses over about 200 years. He found a distribution that looked like this:
In most years (109) no Prussian soldiers were killed by horses. In 65 years, only one soldier died this way, until in one particularly bad year, 4 Prussian soldiers were killed by horses. If you wanted to predict this variable, what would you use?
A) Spearman correlation.
B) Non-linear regression.
C) Poisson regression.
D) Logistic regression.
In most years (109) no Prussian soldiers were killed by horses. In 65 years, only one soldier died this way, until in one particularly bad year, 4 Prussian soldiers were killed by horses. If you wanted to predict this variable, what would you use?A) Spearman correlation.
B) Non-linear regression.
C) Poisson regression.
D) Logistic regression.
Unlock Deck
Unlock for access to all 20 flashcards in this deck.
Unlock Deck
k this deck
19
I asked students to measure their heights in inches, and then their heights in centimeters. I recorded the two measures and calculated the correlation between them. What do you think I would be most likely to find?
A) r = 0.5 (a large correlation).
B) r = 1.0 (a perfect correlation).
C) r = 0.95
D) r = 0.3
A) r = 0.5 (a large correlation).
B) r = 1.0 (a perfect correlation).
C) r = 0.95
D) r = 0.3
Unlock Deck
Unlock for access to all 20 flashcards in this deck.
Unlock Deck
k this deck
20
Then I used the same data to do a regression. I predicted height in centimeters, using height in inches as the predictor. What would I be most likely to find:
A) Intercept = 0, slope = 1.
B) Intercept = 1, slope = 2.5
C) Intercept = 2.5, slope = 0.4
D) Intercept = 0, slope = 2.5
A) Intercept = 0, slope = 1.
B) Intercept = 1, slope = 2.5
C) Intercept = 2.5, slope = 0.4
D) Intercept = 0, slope = 2.5
Unlock Deck
Unlock for access to all 20 flashcards in this deck.
Unlock Deck
k this deck
Unlock Deck
Unlock for access to all 20 flashcards in this deck.


