Deck 7: Theoretical Distributions Including the Normal Distribution
Full screen (f)
Question
Question
Question
Question
Question
Question
Question
Question
Question
Question
Question
Question
Question
Question
Question
Question
Question
Question
Question
Question
Question
Question
Question
Question
Question
Question
Question
Question
Question
Question
Question
Question
Question
Question
Question
Question
Question
Question
Question
Question
Question
Question
Question
Question
Question
Question
Question
Question
Question
Data Set 7-6, a theoretical distribution: 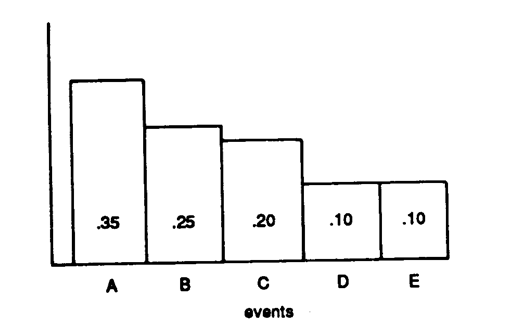
-Look at Data Set 7-6. The probability of occurrence of Event B or Event E is
A) 1.00
B) .25
C) .35
D) .45.
-Look at Data Set 7-6. The probability of occurrence of Event B or Event E is
A) 1.00
B) .25
C) .35
D) .45.
Question
Data Set 7-6, a theoretical distribution:
-Look at Data Set 7-6. This distribution is
A) empirical and skewed
B) empirical and rectangular
C) theoretical and skewed
D) theoretical and rectangular.
-Look at Data Set 7-6. This distribution is
A) empirical and skewed
B) empirical and rectangular
C) theoretical and skewed
D) theoretical and rectangular.
Question
Data Set 7-6, a theoretical distribution:
-Look at Data Set 7-6. The probability of occurrence of Events B or C is
A) 1.00
B) 0.45
C) 0.05
D) 0.80
-Look at Data Set 7-6. The probability of occurrence of Events B or C is
A) 1.00
B) 0.45
C) 0.05
D) 0.80
Question
Question
Question
Question
Question
Question
Question
Question
Question
Question
Question
Question
Question
Question
Question
Question
Question
Question
Question
Question
Question
Question
Question
Question
Question
Question
Question
Question
Question

Unlock Deck
Sign up to unlock the cards in this deck!
Unlock Deck
Unlock Deck
1/138
Play
Full screen (f)
Deck 7: Theoretical Distributions Including the Normal Distribution
1
If an urn contains 2 red balls, 2 blue balls, and 1 green ball, the probability of drawing a red ball is .50.
False
2
Empirical distributions are based on mathematics and logic.
False
3
The inflection points on the normal curve are at z = -1 and z = +1.
True
4
A point on the normal curve with .35 of the curve beyond it has .15 between it and the mean.
Unlock Deck
Unlock for access to all 138 flashcards in this deck.
Unlock Deck
k this deck
5
A distribution of playing cards is normally distributed.
Unlock Deck
Unlock for access to all 138 flashcards in this deck.
Unlock Deck
k this deck
6
Extreme scores on the normal curve are those far from the mean.
Unlock Deck
Unlock for access to all 138 flashcards in this deck.
Unlock Deck
k this deck
7
The numerator of the z score in Chapter 7 is a standard deviation.
Unlock Deck
Unlock for access to all 138 flashcards in this deck.
Unlock Deck
k this deck
8
A z score of -1.05 is possible.
Unlock Deck
Unlock for access to all 138 flashcards in this deck.
Unlock Deck
k this deck
9
The total area of each theoretical distribution described in Chapter 7 was 1.00.
Unlock Deck
Unlock for access to all 138 flashcards in this deck.
Unlock Deck
k this deck
10
Equal distances on the X axis are associated with equal proportions of the normal curve.
Unlock Deck
Unlock for access to all 138 flashcards in this deck.
Unlock Deck
k this deck
11
If an urn contains 2 red balls, 2 blue balls, and 1 green ball, the probability of drawing a blue ball is .20.
Unlock Deck
Unlock for access to all 138 flashcards in this deck.
Unlock Deck
k this deck
12
Theoretical distributions are based on mathematics and logic.
Unlock Deck
Unlock for access to all 138 flashcards in this deck.
Unlock Deck
k this deck
13
The inflection points on the normal curve are at one standard deviation above the mean and one standard deviation below the mean.
Unlock Deck
Unlock for access to all 138 flashcards in this deck.
Unlock Deck
k this deck
14
A point on the normal curve with .15 of the curve below it has .35 between it and the mean.
Unlock Deck
Unlock for access to all 138 flashcards in this deck.
Unlock Deck
k this deck
15
A rectangular distribution is an example of a normal distribution.
Unlock Deck
Unlock for access to all 138 flashcards in this deck.
Unlock Deck
k this deck
16
Extreme scores on the normal curve are those near the mean.
Unlock Deck
Unlock for access to all 138 flashcards in this deck.
Unlock Deck
k this deck
17
The denominator of the z score in Chapter 7 is a standard deviation.
Unlock Deck
Unlock for access to all 138 flashcards in this deck.
Unlock Deck
k this deck
18
The total area of theoretical distributions described in Chapter 7 was 1.00.
Unlock Deck
Unlock for access to all 138 flashcards in this deck.
Unlock Deck
k this deck
19
A z score of -1.05 is not possible.
Unlock Deck
Unlock for access to all 138 flashcards in this deck.
Unlock Deck
k this deck
20
The size of the area of the theoretical distributions described in Chapter 7 depends on the size of the population.
Unlock Deck
Unlock for access to all 138 flashcards in this deck.
Unlock Deck
k this deck
21
If an urn contains 2 red balls, 2 blue balls, and 1 green ball, the probability of drawing a green ball is .10.
Unlock Deck
Unlock for access to all 138 flashcards in this deck.
Unlock Deck
k this deck
22
Empirical distributions are not based on mathematics or logic.
Unlock Deck
Unlock for access to all 138 flashcards in this deck.
Unlock Deck
k this deck
23
The inflection points on the normal curve are at the mean and the median.
Unlock Deck
Unlock for access to all 138 flashcards in this deck.
Unlock Deck
k this deck
24
A point on the normal curve with .40 of the curve beyond it has .10 between it and the mean.
Unlock Deck
Unlock for access to all 138 flashcards in this deck.
Unlock Deck
k this deck
25
The normal distribution is symmetrical about the median.
Unlock Deck
Unlock for access to all 138 flashcards in this deck.
Unlock Deck
k this deck
26
Extreme scores on the normal curve are those between the mean and the median.
Unlock Deck
Unlock for access to all 138 flashcards in this deck.
Unlock Deck
k this deck
27
The numerator of the z score in Chapter 7 is the difference between a distribution's mean and its median.
Unlock Deck
Unlock for access to all 138 flashcards in this deck.
Unlock Deck
k this deck
28
The area of a portion of a theoretical distribution is always equal to the probability of the events covered by that area.
Unlock Deck
Unlock for access to all 138 flashcards in this deck.
Unlock Deck
k this deck
29
Your textbook used positive and negative z scores as measures along the X axis.
Unlock Deck
Unlock for access to all 138 flashcards in this deck.
Unlock Deck
k this deck
30
The size of the theoretical distributions described in Chapter 7 does not depend on the size of the population.
Unlock Deck
Unlock for access to all 138 flashcards in this deck.
Unlock Deck
k this deck
31
Data Set 7-1: Suppose an urn (a kind of jar that seems to be the best natural habitat for marbles) contained 3 red, 6 black, 5 blue, 2 yellow and 4 green marbles.
-Refer to Data Set 7-1. The probability of drawing a blue marble is
A) .20
B) .25
C) 5
D) none of the other alternatives are correct.
-Refer to Data Set 7-1. The probability of drawing a blue marble is
A) .20
B) .25
C) 5
D) none of the other alternatives are correct.
Unlock Deck
Unlock for access to all 138 flashcards in this deck.
Unlock Deck
k this deck
32
Data Set 7-1: Suppose an urn (a kind of jar that seems to be the best natural habitat for marbles) contained 3 red, 6 black, 5 blue, 2 yellow and 4 green marbles.
-Refer to Data Set 7-1. The probability of drawing a black or a green marble is
A) .06
B) .40
C) .60
D) none of the other alternatives are correct
-Refer to Data Set 7-1. The probability of drawing a black or a green marble is
A) .06
B) .40
C) .60
D) none of the other alternatives are correct
Unlock Deck
Unlock for access to all 138 flashcards in this deck.
Unlock Deck
k this deck
33
Data Set 7-1: Suppose an urn (a kind of jar that seems to be the best natural habitat for marbles) contained 3 red, 6 black, 5 blue, 2 yellow and 4 green marbles.
-Refer to Data Set 7-1. The probability of drawing a marble that is red, yellow, black or green is
A) .25
B) .50
C) .75
D) 1.00.
-Refer to Data Set 7-1. The probability of drawing a marble that is red, yellow, black or green is
A) .25
B) .50
C) .75
D) 1.00.
Unlock Deck
Unlock for access to all 138 flashcards in this deck.
Unlock Deck
k this deck
34
Data Set 7-2: In the Fall of 1902 there were 184 seniors, 179 juniors, 267 sophomores, and 353 freshmen enrolled at a small college.
-In Data Set 7-2 the probability of picking a student at random and getting a freshman is
A) .353
B) .359
C) .250
D) none of the other alternatives are correct.
-In Data Set 7-2 the probability of picking a student at random and getting a freshman is
A) .353
B) .359
C) .250
D) none of the other alternatives are correct.
Unlock Deck
Unlock for access to all 138 flashcards in this deck.
Unlock Deck
k this deck
35
Data Set 7-2: In the Fall of 1902 there were 184 seniors, 179 juniors, 267 sophomores, and 353 freshmen enrolled at a small college.
-In Data Set 7-2 the probability of picking a student at random and getting either a junior or a senior is
A) .363
B) .184
C) .369
D) none of the other alternatives are correct.
-In Data Set 7-2 the probability of picking a student at random and getting either a junior or a senior is
A) .363
B) .184
C) .369
D) none of the other alternatives are correct.
Unlock Deck
Unlock for access to all 138 flashcards in this deck.
Unlock Deck
k this deck
36
Data Set 7-2: In the Fall of 1902 there were 184 seniors, 179 juniors, 267 sophomores, and 353 freshmen enrolled at a small college.
-Data Set 7-2 is
A) a theoretical distribution
B) a normal distribution
C) an empirical distribution
D) none of the other alternatives are correct.
-Data Set 7-2 is
A) a theoretical distribution
B) a normal distribution
C) an empirical distribution
D) none of the other alternatives are correct.
Unlock Deck
Unlock for access to all 138 flashcards in this deck.
Unlock Deck
k this deck
37
Data Set 7-3: A population of scores was normally distributed with a mean of 32 and a standard deviation of 3.
-Look at Data Set 7-3. The proportion that scored between 30 and 27 is
A) .2989
B) .2039
C) .7011
-Look at Data Set 7-3. The proportion that scored between 30 and 27 is
A) .2989
B) .2039
C) .7011
Unlock Deck
Unlock for access to all 138 flashcards in this deck.
Unlock Deck
k this deck
38
Data Set 7-3: A population of scores was normally distributed with a mean of 32 and a standard deviation of 3.
-For Data Set 7-3, the scores that separate the middle 60 percent from the extremes are
A) 28.16, 35.84
B) 29.48, 34.52
C) 30.35, 33.56
D) none of the other alternatives are correct.
-For Data Set 7-3, the scores that separate the middle 60 percent from the extremes are
A) 28.16, 35.84
B) 29.48, 34.52
C) 30.35, 33.56
D) none of the other alternatives are correct.
Unlock Deck
Unlock for access to all 138 flashcards in this deck.
Unlock Deck
k this deck
39
Data Set 7-3: A population of scores was normally distributed with a mean of 32 and a standard deviation of 3.
-Look at Data Set 7-3. The proportion of the distribution with scores of 30 or more is
A) .7486
B) .6700
C) .2486
D) none of the other alternatives are correct.
-Look at Data Set 7-3. The proportion of the distribution with scores of 30 or more is
A) .7486
B) .6700
C) .2486
D) none of the other alternatives are correct.
Unlock Deck
Unlock for access to all 138 flashcards in this deck.
Unlock Deck
k this deck
40
Data Set 7-4: A set of scores with a mean of 16 and a standard deviation of 3.
-Look at Data Set 7-4. What score separates the top 30 percent of the population from the lower 70 percent?
A) 17.80
B) 18.52
C) 17.00
D) none of the other alternatives are correct.
-Look at Data Set 7-4. What score separates the top 30 percent of the population from the lower 70 percent?
A) 17.80
B) 18.52
C) 17.00
D) none of the other alternatives are correct.
Unlock Deck
Unlock for access to all 138 flashcards in this deck.
Unlock Deck
k this deck
41
Data Set 7-4: A set of scores with a mean of 16 and a standard deviation of 3.
-Look at Data Set 7-4. What scores are so extreme they are made by only five percent of the population?
A) 11.00, 20.00
B) 11.18, 20.82
C) 10.12 21.88
D) none of the other alternatives are correct.
-Look at Data Set 7-4. What scores are so extreme they are made by only five percent of the population?
A) 11.00, 20.00
B) 11.18, 20.82
C) 10.12 21.88
D) none of the other alternatives are correct.
Unlock Deck
Unlock for access to all 138 flashcards in this deck.
Unlock Deck
k this deck
42
Data Set 7-4: A set of scores with a mean of 16 and a standard deviation of 3.
-Look at Data Set 7-4. What proportion of the population has scores between 12 and 17, including both 12 and 17?
A) .2789
B) .4962
C) .5375
D) none of the other alternatives are correct.
-Look at Data Set 7-4. What proportion of the population has scores between 12 and 17, including both 12 and 17?
A) .2789
B) .4962
C) .5375
D) none of the other alternatives are correct.
Unlock Deck
Unlock for access to all 138 flashcards in this deck.
Unlock Deck
k this deck
43
Data Set 7-4: A set of scores with a mean of 16 and a standard deviation of 3.
-Look at Data Set 7-4. Suppose 200 persons received scores during a period of a week. How many would have scores of 15 or larger?
A) 15
B) 100
C) 45
D) none of the other alternatives are correct.
-Look at Data Set 7-4. Suppose 200 persons received scores during a period of a week. How many would have scores of 15 or larger?
A) 15
B) 100
C) 45
D) none of the other alternatives are correct.
Unlock Deck
Unlock for access to all 138 flashcards in this deck.
Unlock Deck
k this deck
44
Data Set 7-5: Suppose you knew that a population had a mean of 150 and a standard deviation of 50.
-Look at Data Set 7-5. To use Table C in the back of your text, you must assume that
A) the population was a theoretical one
B) the population was normally distributed
C) the highest score possible is 300
D) all of the other alternatives are correct.
-Look at Data Set 7-5. To use Table C in the back of your text, you must assume that
A) the population was a theoretical one
B) the population was normally distributed
C) the highest score possible is 300
D) all of the other alternatives are correct.
Unlock Deck
Unlock for access to all 138 flashcards in this deck.
Unlock Deck
k this deck
45
Data Set 7-5: Suppose you knew that a population had a mean of 150 and a standard deviation of 50.
-Use Table C to answer questions about Data Set 7-5. The proportion of the population with scores less than 225 is
A) .9332
B) .4332
C) .05668
-Use Table C to answer questions about Data Set 7-5. The proportion of the population with scores less than 225 is
A) .9332
B) .4332
C) .05668
Unlock Deck
Unlock for access to all 138 flashcards in this deck.
Unlock Deck
k this deck
46
Data Set 7-5: Suppose you knew that a population had a mean of 150 and a standard deviation of 50.
-Use Table C and Data Set 7-5. The proportion of the population with scores less than 0 is
A) .0000
B) .9987
C) .4987
D) .0013
-Use Table C and Data Set 7-5. The proportion of the population with scores less than 0 is
A) .0000
B) .9987
C) .4987
D) .0013
Unlock Deck
Unlock for access to all 138 flashcards in this deck.
Unlock Deck
k this deck
47
Data Set 7-5: Suppose you knew that a population had a mean of 150 and a standard deviation of 50.
-If Data Set 7-5 were based on 500 scores, the number with scores between 175 and 200 would be
A) 266
B) 225
C) 75
D) 106
-If Data Set 7-5 were based on 500 scores, the number with scores between 175 and 200 would be
A) 266
B) 225
C) 75
D) 106
Unlock Deck
Unlock for access to all 138 flashcards in this deck.
Unlock Deck
k this deck
48
Data Set 7-5: Suppose you knew that a population had a mean of 150 and a standard deviation of 50.
-The proportion of the population of scores in Data Set 7-5 that is between 100 and 175 would be
A) .3413
B) .1915
C) .1498
D) .4706
-The proportion of the population of scores in Data Set 7-5 that is between 100 and 175 would be
A) .3413
B) .1915
C) .1498
D) .4706
Unlock Deck
Unlock for access to all 138 flashcards in this deck.
Unlock Deck
k this deck
49
Data Set 7-6, a theoretical distribution:
-Look at Data Set 7-6. The probability of occurrence of Event B or Event E is
A) 1.00
B) .25
C) .35
D) .45.
-Look at Data Set 7-6. The probability of occurrence of Event B or Event E is
A) 1.00
B) .25
C) .35
D) .45.
Unlock Deck
Unlock for access to all 138 flashcards in this deck.
Unlock Deck
k this deck
50
Data Set 7-6, a theoretical distribution:
-Look at Data Set 7-6. This distribution is
A) empirical and skewed
B) empirical and rectangular
C) theoretical and skewed
D) theoretical and rectangular.
-Look at Data Set 7-6. This distribution is
A) empirical and skewed
B) empirical and rectangular
C) theoretical and skewed
D) theoretical and rectangular.
Unlock Deck
Unlock for access to all 138 flashcards in this deck.
Unlock Deck
k this deck
51
Data Set 7-6, a theoretical distribution:
-Look at Data Set 7-6. The probability of occurrence of Events B or C is
A) 1.00
B) 0.45
C) 0.05
D) 0.80
-Look at Data Set 7-6. The probability of occurrence of Events B or C is
A) 1.00
B) 0.45
C) 0.05
D) 0.80
Unlock Deck
Unlock for access to all 138 flashcards in this deck.
Unlock Deck
k this deck
52
The difference between an empirical distribution and a theoretical distribution is that a theoretical distribution
A) is based on many more observations
B) is theory and cannot be used
C) is based on mathematics and logic
D) is based solely on observation.
A) is based on many more observations
B) is theory and cannot be used
C) is based on mathematics and logic
D) is based solely on observation.
Unlock Deck
Unlock for access to all 138 flashcards in this deck.
Unlock Deck
k this deck
53
A characteristic that always distinguishes an empirical from a theoretical curve is
A) the smoothness of the curve or line that connects the points
B) how the points on the curve were obtained
C) whether the curve actually crosses the X axis or not
D) all of the other alternatives are correct.
A) the smoothness of the curve or line that connects the points
B) how the points on the curve were obtained
C) whether the curve actually crosses the X axis or not
D) all of the other alternatives are correct.
Unlock Deck
Unlock for access to all 138 flashcards in this deck.
Unlock Deck
k this deck
54
An empirical distribution is based on
A) observations
B) logic
C) both observation and logic
D) neither observation nor logic.
A) observations
B) logic
C) both observation and logic
D) neither observation nor logic.
Unlock Deck
Unlock for access to all 138 flashcards in this deck.
Unlock Deck
k this deck
55
An empirical distribution is based on
A) observation
B) logic
C) mathematical formulas
D) all of the other alternatives are correct.
A) observation
B) logic
C) mathematical formulas
D) all of the other alternatives are correct.
Unlock Deck
Unlock for access to all 138 flashcards in this deck.
Unlock Deck
k this deck
56
Which of the following is a theoretical distribution?
A) a bar graph of the distribution of votes for the five candidates in the last governor's election
B) a bar graph of the number of people in three racial categories in Sam Houston Elementary School in Austin, Texas
C) a frequency polygon of the ages of all students in SHES four years from now
D) a frequency polygon of the number of speaking engagements during the month of October by the winning candidate in last November's election.
Unlock Deck
Unlock for access to all 138 flashcards in this deck.
Unlock Deck
k this deck
57
Which of the following is a theoretical distribution?
A) a count of the number of cups of coffee consumed during each hour of the day
B) a count of the number of cups of coffee consumed during each day of the week
C) a count of the number of cups of coffee consumed during each month of the year
D) none of the other alternatives are correct.
A) a count of the number of cups of coffee consumed during each hour of the day
B) a count of the number of cups of coffee consumed during each day of the week
C) a count of the number of cups of coffee consumed during each month of the year
D) none of the other alternatives are correct.
Unlock Deck
Unlock for access to all 138 flashcards in this deck.
Unlock Deck
k this deck
58
Which of the following is a theoretical distribution?
A) your statistics professor stayed in the residence hall one Friday night and flipped a coin 10,000 times. The number of heads and tails was recorded.
B) The price of every house sold in the last five years in Hampden County was obtained from courthouse records.
C) The number of persons who arrived late was recorded every time a statistics course met during the semester.
D) None of the other alternatives are correct.
Unlock Deck
Unlock for access to all 138 flashcards in this deck.
Unlock Deck
k this deck
59
Which of the following is an empirical distribution?
A) the given names and their frequencies of all high school graduates in the United States for the year 2010
B) the scores obtained from an infinite number of throws of one die
C) the normal distribution contained in Table C in your text
D) all of the other alternatives are correct.
A) the given names and their frequencies of all high school graduates in the United States for the year 2010
B) the scores obtained from an infinite number of throws of one die
C) the normal distribution contained in Table C in your text
D) all of the other alternatives are correct.
Unlock Deck
Unlock for access to all 138 flashcards in this deck.
Unlock Deck
k this deck
60
Suppose that should k occur, it will be called a success. If j should occur, it will be called a failure. The ratio of k/(k + j) is
A) the empirical probability of k
B) the empirical probability of j
C) the theoretical probability of k
D) the theoretical probability of j.
A) the empirical probability of k
B) the empirical probability of j
C) the theoretical probability of k
D) the theoretical probability of j.
Unlock Deck
Unlock for access to all 138 flashcards in this deck.
Unlock Deck
k this deck
61
Suppose that should k occur, it will be called a success. If j should occur, it will be called a failure. The ratio of k/(k + j) is
A) the theoretical probability of k
B) the empirical probability of k
C) both of the descriptive alternatives
D) neither of the descriptive alternatives.
A) the theoretical probability of k
B) the empirical probability of k
C) both of the descriptive alternatives
D) neither of the descriptive alternatives.
Unlock Deck
Unlock for access to all 138 flashcards in this deck.
Unlock Deck
k this deck
62
Suppose that should k occur, it will be called a success. If j should occur, it will be called a failure. The ratio of k/(k + j) is
A) the empirical probability of k
B) the empirical probability of j
C) both of the descriptive alternatives
D) neither of the descriptive alternatives.
A) the empirical probability of k
B) the empirical probability of j
C) both of the descriptive alternatives
D) neither of the descriptive alternatives.
Unlock Deck
Unlock for access to all 138 flashcards in this deck.
Unlock Deck
k this deck
63
Suppose that if k should occur, it will be called a success. If j should occur, it will be called a failure. The ratio is
A) the empirical probability of k
B) the empirical probability of j
C) the theoretical probability of k
D) none of the other alternatives are correct.
A) the empirical probability of k
B) the empirical probability of j
C) the theoretical probability of k
D) none of the other alternatives are correct.
Unlock Deck
Unlock for access to all 138 flashcards in this deck.
Unlock Deck
k this deck
64
Suppose that if k should occur, it will be called a success. If j should occur, it will be called a failure. The ratio k/(k+j) is
A) the empirical probability of k
B) the empirical probability of j
C) the theoretical probability of k
D) the theoretical probability of j.
A) the empirical probability of k
B) the empirical probability of j
C) the theoretical probability of k
D) the theoretical probability of j.
Unlock Deck
Unlock for access to all 138 flashcards in this deck.
Unlock Deck
k this deck
65
You would know the probability of an event or events if you knew
A) the number of successes that occurred
B) the total number of events
C) the proportion of the curve that corresponded to the event(s)
D) none of the other alternatives are correct.
A) the number of successes that occurred
B) the total number of events
C) the proportion of the curve that corresponded to the event(s)
D) none of the other alternatives are correct.
Unlock Deck
Unlock for access to all 138 flashcards in this deck.
Unlock Deck
k this deck
66
Suppose you had 5 coins which you tossed in the air 100 times and recorded the number of heads on each toss. The distribution you generated would be a one.
A) rectangular
B) binomial
C) normal.
A) rectangular
B) binomial
C) normal.
Unlock Deck
Unlock for access to all 138 flashcards in this deck.
Unlock Deck
k this deck
67
Five coins are tossed 100 times. The distribution generated is
A) theoretical
B) empirical.
A) theoretical
B) empirical.
Unlock Deck
Unlock for access to all 138 flashcards in this deck.
Unlock Deck
k this deck
68
A distribution that is not a normal distribution is
A) abnormal
B) not useful
C) the result of faulty observations
D) none of the other alternatives are correct.
A) abnormal
B) not useful
C) the result of faulty observations
D) none of the other alternatives are correct.
Unlock Deck
Unlock for access to all 138 flashcards in this deck.
Unlock Deck
k this deck
69
Which of the following is a normal distribution?
A) number choices between one and ten
B) playing cards drawn from a deck
C) both of the descriptive alternatives
D) neither of the descriptive alternatives.
A) number choices between one and ten
B) playing cards drawn from a deck
C) both of the descriptive alternatives
D) neither of the descriptive alternatives.
Unlock Deck
Unlock for access to all 138 flashcards in this deck.
Unlock Deck
k this deck
70
When a theoretical distribution is used to assess probability, the area under the curve is considered to be
A) 0.00
B) 1.00
C) 2.00
D) any of the other alternatives are possible.
A) 0.00
B) 1.00
C) 2.00
D) any of the other alternatives are possible.
Unlock Deck
Unlock for access to all 138 flashcards in this deck.
Unlock Deck
k this deck
71
The total area under a theoretical distribution is
A) 1.00
B) dependent upon the number of events
C) dependent upon the mean
D) dependent upon the mean, standard deviation, and number of events.
A) 1.00
B) dependent upon the number of events
C) dependent upon the mean
D) dependent upon the mean, standard deviation, and number of events.
Unlock Deck
Unlock for access to all 138 flashcards in this deck.
Unlock Deck
k this deck
72
The area under part of a theoretical curve is also
A) the mean of the curve
B) the standard deviation of the curve
C) the probability of events covered by that area of the curve.
A) the mean of the curve
B) the standard deviation of the curve
C) the probability of events covered by that area of the curve.
Unlock Deck
Unlock for access to all 138 flashcards in this deck.
Unlock Deck
k this deck
73
Rectangular, binomial and normal curves have the following in common:
A) The most frequent score is in the middle of the distribution
B) Table C gives the probabilities for all three curves
C) The area under the curve is 1.00
D) All of the other alternatives are correct.
A) The most frequent score is in the middle of the distribution
B) Table C gives the probabilities for all three curves
C) The area under the curve is 1.00
D) All of the other alternatives are correct.
Unlock Deck
Unlock for access to all 138 flashcards in this deck.
Unlock Deck
k this deck
74
For distributions that are not normal distributions
A) Table C cannot be used
B) probabilities cannot be calculated
C) empirical observations cannot fit a theoretical distribution
D) all of the other alternatives are correct.
A) Table C cannot be used
B) probabilities cannot be calculated
C) empirical observations cannot fit a theoretical distribution
D) all of the other alternatives are correct.
Unlock Deck
Unlock for access to all 138 flashcards in this deck.
Unlock Deck
k this deck
75
To use the theoretical normal curve, which of the following things must be known about the population?
A) mean
B) standard deviation
C) the form of the distribution
D) all of the other alternatives are correct.
A) mean
B) standard deviation
C) the form of the distribution
D) all of the other alternatives are correct.
Unlock Deck
Unlock for access to all 138 flashcards in this deck.
Unlock Deck
k this deck
76
The mean and standard deviation of standard intelligence tests is
A) 0, 1.00
B) 100, 1.00
C) 100, 15
D) 1.00, 0.00.
A) 0, 1.00
B) 100, 1.00
C) 100, 15
D) 1.00, 0.00.
Unlock Deck
Unlock for access to all 138 flashcards in this deck.
Unlock Deck
k this deck
77
According to your text the following data are distributed normally.
A) truck driver wages
B) pine tree diameters
C) both truck driver wages and pine tree diameters
D) neither truck driver wages nor pine tree diameters.
A) truck driver wages
B) pine tree diameters
C) both truck driver wages and pine tree diameters
D) neither truck driver wages nor pine tree diameters.
Unlock Deck
Unlock for access to all 138 flashcards in this deck.
Unlock Deck
k this deck
78
Please do not use your table in answering this question. .3849 of the normal curve falls between and 1.2 . The proportion between and .6 is
A) .7698
B) .19245
C) .69245
D) not determinable from the information given.
A) .7698
B) .19245
C) .69245
D) not determinable from the information given.
Unlock Deck
Unlock for access to all 138 flashcards in this deck.
Unlock Deck
k this deck
79
.4332 of the normal curve lies between and 1.5 . The proportion between and .75 is
A) .8664
B) .2166
C) .0668
D) not determinable without a table of the normal curve.
A) .8664
B) .2166
C) .0668
D) not determinable without a table of the normal curve.
Unlock Deck
Unlock for access to all 138 flashcards in this deck.
Unlock Deck
k this deck
80
.2580 of the normal curve lies between and .70 . The proportion between and .35 is
A) .1240
B) .1290
C) .5160
D) not determinable unless the normal curve table is consulted.
A) .1240
B) .1290
C) .5160
D) not determinable unless the normal curve table is consulted.
Unlock Deck
Unlock for access to all 138 flashcards in this deck.
Unlock Deck
k this deck
Unlock Deck
Unlock for access to all 138 flashcards in this deck.


