Deck 11: Nonexperimental Research: Correlational Designs
Full screen (f)
Question
Question
Question
Question
Question
Question
Question
Question
Question
Question
Question
Question
Question
Question
Question
Question
Question
Question
Question
Question
Question
Question
Question
Question
Question
Question
Question
Question
Question
Question
Question
Question
Question
Question
Question
Question
Question
Question
Question
Question
Question
Question
Question
Question
Question
Question
Question
Question
Question
Question
Question
Question
Question
Question
Question
Question
Question
Question
A team of researchers administered a personality inventory that measures 15 personality traits to a group of entering students in a doctoral program in education. They also determined students' gradepoint average (GPA) at the end of the first year of the program. They then used multiple regression to determine which combination of personality traits best predicts GPA in this situation. The following is their table of results.
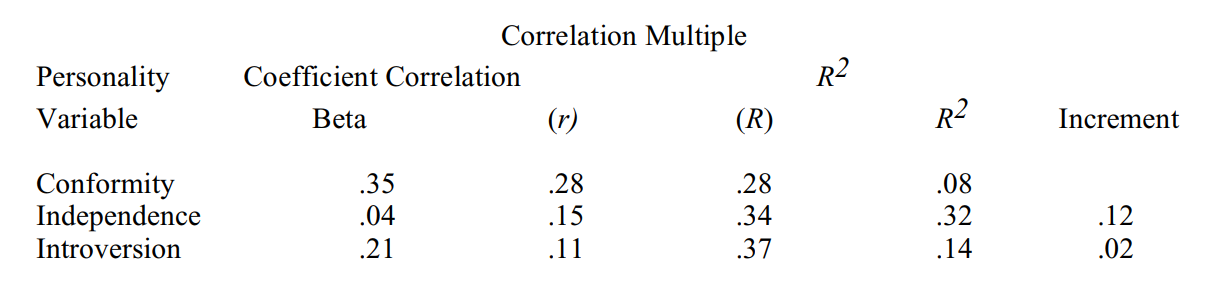
a. What information is provided by the beta weights in the first data column?
b. What information is provided by the fact that the beta weight for conformity is .35, whereas for introversion it is .21?
c. What does the correlation coefficient of .15 for independence in the second data column mean?
d. What does the multiple correlation coefficient of .37 in the third data column mean?
e. What does the R2 value of .08 in the fourth data column mean?
f. What does the R2 increment of .02 in the fifth data column mean?

Unlock Deck
Sign up to unlock the cards in this deck!
Unlock Deck
Unlock Deck
1/58
Play
Full screen (f)
Deck 11: Nonexperimental Research: Correlational Designs
1
An advantage of the correlational method is that
A) it can be used to analyze the relationships among many variables within a single study.
B) it indicates both the direction and the degree of the relationship between variables.
C) it can be used to predict academic achievement and other outcomes.
D) all of the above.
A) it can be used to analyze the relationships among many variables within a single study.
B) it indicates both the direction and the degree of the relationship between variables.
C) it can be used to predict academic achievement and other outcomes.
D) all of the above.
all of the above.
2
A major advantage of correlational research designs over causal-comparative research designs is that
A) they can examine the entire range of variation in the variables being studied.
B) correlational statistics are easier to compute than are the statistics commonly used in causal-comparative research.
C) they can accommodate a wider range of measurement scales.
D) they are easier for practitioners to comprehend.
they can examine the entire range of variation in the variables being studied.
3
One disadvantage of correlational research is that
A) only two variables can be accommodated within a single correlational study.
B) the results of a correlational study do not permit strong conclusions about cause-and-effect relationships.
C) the variables in a correlational study cannot be measured reliably.
D) it is difficult to find published measures that satisfy the assumptions of a correlational research design.
the results of a correlational study do not permit strong conclusions about cause-and-effect relationships.
4
A scattergram provides a visual representation of
A) the causal relationship between two measured variables.
B) the standard error of measurement for two measured variables.
C) a positive or negative relationship between two measured variables.
D) the results of a path analysis.
A) the causal relationship between two measured variables.
B) the standard error of measurement for two measured variables.
C) a positive or negative relationship between two measured variables.
D) the results of a path analysis.
Unlock Deck
Unlock for access to all 58 flashcards in this deck.
Unlock Deck
k this deck
5
If every point in a scattergram plotting variable X and variable Y falls on the line of best fit, we can conclude that
A) variable X predicts measured variable Y perfectly.
B) variable X explains none of the variance in variable Y.
C) the relationship between variables X and Y is positive.
D) Variable X causes variable Y , or vice versa.
A) variable X predicts measured variable Y perfectly.
B) variable X explains none of the variance in variable Y.
C) the relationship between variables X and Y is positive.
D) Variable X causes variable Y , or vice versa.
Unlock Deck
Unlock for access to all 58 flashcards in this deck.
Unlock Deck
k this deck
6
A scattergram can detect
A) a positive correlation between two variables.
B) a negative correlation between two variables.
C) the absence of correlation between two variables.
D) all of the above.
A) a positive correlation between two variables.
B) a negative correlation between two variables.
C) the absence of correlation between two variables.
D) all of the above.
Unlock Deck
Unlock for access to all 58 flashcards in this deck.
Unlock Deck
k this deck
7
If every increase in score on a test of literary knowledge is accompanied by an increase in score on an intelligence test, one can conclude that
A) there is a perfect negative relationship between literary knowledge and intelligence.
B) there is no relationship between literary knowledge and intelligence.
C) the correlation between the literary knowledge test and the intelligence test is 1.00.
D) intelligence causes literary knowledge.
A) there is a perfect negative relationship between literary knowledge and intelligence.
B) there is no relationship between literary knowledge and intelligence.
C) the correlation between the literary knowledge test and the intelligence test is 1.00.
D) intelligence causes literary knowledge.
Unlock Deck
Unlock for access to all 58 flashcards in this deck.
Unlock Deck
k this deck
8
A researcher who obtains a correlation of -.72 between test anxiety and college gradepoint average would be justified in concluding that
A) scores on the two variables do not covary substantially.
B) students who experience a great deal of test anxiety are likely to earn lower grades than students who experience minimal test anxiety.
C) low test anxiety inhibits college achievement.
D) high test anxiety is associated with higher grades.
Unlock Deck
Unlock for access to all 58 flashcards in this deck.
Unlock Deck
k this deck
9
The purpose of a relationship study typically is to
A) determine whether the correlation between two measured variables is caused by overlapping items.
B) identify possible causes and effects among observed phenomena.
C) check how well two observers agree in their ratings of the same construct.
D) check how well a sample's scores on an individual item of a test correlate with their scores on all the other test items.
Unlock Deck
Unlock for access to all 58 flashcards in this deck.
Unlock Deck
k this deck
10
A limitation of the shotgun approach to identify variables that correlate with a criterion variable is that
A) it cannot detect whether the observed relationships are positive or negative.
B) it cannot detect the magnitude of the observed relationships.
C) only a few variables can be accommodated in the research design.
D) some of the many measured variables are likely to correlate with the criterion by chance.
Unlock Deck
Unlock for access to all 58 flashcards in this deck.
Unlock Deck
k this deck
11
In research investigating relationships between variables, it is best if
A) the research sample is homogeneous with respect to major demographic variables.
B) the number of variables is approximately the same as the number of individuals in the sample.
C) the researcher uses the individual as the unit of statistical analysis.
D) the researcher uses the group as the unit of statistical analysis.
Unlock Deck
Unlock for access to all 58 flashcards in this deck.
Unlock Deck
k this deck
12
In a prediction study, the basic form of data analysis consists of
A) analysis of covariance.
B) comparing the variances of different predictor variables.
C) correlating each moderator variable with the criterion variable.
D) correlating each predictor variable with the criterion variable.
A) analysis of covariance.
B) comparing the variances of different predictor variables.
C) correlating each moderator variable with the criterion variable.
D) correlating each predictor variable with the criterion variable.
Unlock Deck
Unlock for access to all 58 flashcards in this deck.
Unlock Deck
k this deck
13
Both multiple regression and moderator analysis can be used to
A) determine underlying factors in a set of variables.
B) check for item overlap as a cause of an observed correlation between two measured variables.
C) maximize the correlation between predictor variables and a criterion.
D) control for shrinkage in predictive validity coefficients.
A) determine underlying factors in a set of variables.
B) check for item overlap as a cause of an observed correlation between two measured variables.
C) maximize the correlation between predictor variables and a criterion.
D) control for shrinkage in predictive validity coefficients.
Unlock Deck
Unlock for access to all 58 flashcards in this deck.
Unlock Deck
k this deck
14
Prediction research can be done for the purpose of
A) studying the validity of a new aptitude test.
B) determining which individuals are most likely to benefit from a residential treatment program.
C) testing a theory about the determinants of administrative effectiveness.
D) all of the above.
A) studying the validity of a new aptitude test.
B) determining which individuals are most likely to benefit from a residential treatment program.
C) testing a theory about the determinants of administrative effectiveness.
D) all of the above.
Unlock Deck
Unlock for access to all 58 flashcards in this deck.
Unlock Deck
k this deck
15
The effectiveness of a measure in identifying which individuals will be successful with respect to a given criterion depends upon its predictive validity, the selection ratio, and the
A) amount of variance accounted for by the correlation coefficient.
B) proportion of individuals who would be successful if no selection procedure was used.
C) size of the sample.
D) direction of the validity coefficient.
A) amount of variance accounted for by the correlation coefficient.
B) proportion of individuals who would be successful if no selection procedure was used.
C) size of the sample.
D) direction of the validity coefficient.
Unlock Deck
Unlock for access to all 58 flashcards in this deck.
Unlock Deck
k this deck
16
Cross-validation of findings from a prediction study is particularly important for
A) determining the stability of the base rate across replication samples.
B) improving the selection ratio.
C) identifying nonlinear relationships among predictor variables.
D) checking for shrinkage when the original study is replicated.
A) determining the stability of the base rate across replication samples.
B) improving the selection ratio.
C) identifying nonlinear relationships among predictor variables.
D) checking for shrinkage when the original study is replicated.
Unlock Deck
Unlock for access to all 58 flashcards in this deck.
Unlock Deck
k this deck
17
An important factor in deciding which correlational technique to use is
A) the type of measurement scale used to collect the data.
B) the sample size.
C) the type of cause-effect relationship being studied.
D) whether the relationship is hypothesized to be positive or negative.
A) the type of measurement scale used to collect the data.
B) the sample size.
C) the type of cause-effect relationship being studied.
D) whether the relationship is hypothesized to be positive or negative.
Unlock Deck
Unlock for access to all 58 flashcards in this deck.
Unlock Deck
k this deck
18
An important reason for making a scattergram is that it
A) provides a test of the statistical significance of the obtained correlation coefficient.
B) provides a measure of the confidence limits for the obtained correlation coefficient.
C) is helpful for detecting nonlinear relationships.
D) estimates the amount of shrinkage in a correlation coefficient when cross-validated.
Unlock Deck
Unlock for access to all 58 flashcards in this deck.
Unlock Deck
k this deck
19
If the relationship between two variables is markedly nonlinear, the researcher should determine the degree of relationship by computing a
A) point-serial correlation.
B) correlation ratio.
C) contingency coefficient.
D) biserial coefficient.
A) point-serial correlation.
B) correlation ratio.
C) contingency coefficient.
D) biserial coefficient.
Unlock Deck
Unlock for access to all 58 flashcards in this deck.
Unlock Deck
k this deck
20
The most widely used bivariate correlation coefficient is the
A) rank-difference coefficient, rho.
B) contingency coefficient, C.
C) product-moment coefficient, r.
D) correlation coefficient, eta.
A) rank-difference coefficient, rho.
B) contingency coefficient, C.
C) product-moment coefficient, r.
D) correlation coefficient, eta.
Unlock Deck
Unlock for access to all 58 flashcards in this deck.
Unlock Deck
k this deck
21
The correction for attenuation estimates what the magnitude of the correlation between two measured variables would be if
A) a cross-validation study were done.
B) the measures were perfectly reliable.
C) the raw scores were converted to standard scores.
D) the influence of moderator variables were partialled out.
A) a cross-validation study were done.
B) the measures were perfectly reliable.
C) the raw scores were converted to standard scores.
D) the influence of moderator variables were partialled out.
Unlock Deck
Unlock for access to all 58 flashcards in this deck.
Unlock Deck
k this deck
22
To correct for restriction in range, the researcher must know the
A) true correlation between the measured variables in the population.
B) size of the population.
C) reliability of each measured variable.
D) variability of population scores.
A) true correlation between the measured variables in the population.
B) size of the population.
C) reliability of each measured variable.
D) variability of population scores.
Unlock Deck
Unlock for access to all 58 flashcards in this deck.
Unlock Deck
k this deck
23
To hold intelligence constant when correlating scores on a Spanish achievement test and a measure of auditory acuity, a researcher should use
A) partial correlation.
B) correction for attenuation.
C) the correlation ratio.
D) factor analysis.
A) partial correlation.
B) correction for attenuation.
C) the correlation ratio.
D) factor analysis.
Unlock Deck
Unlock for access to all 58 flashcards in this deck.
Unlock Deck
k this deck
24
Multiple regression involves
A) generating a correlation matrix.
B) determining the correlation between a criterion variable and a combination of predictor variables.
C) testing for cause-and-effect relationships along a path of variables.
D) identifying measured variables that correlate with each other, but not with other variables in a data set.
Unlock Deck
Unlock for access to all 58 flashcards in this deck.
Unlock Deck
k this deck
25
A researcher administers 10 measures of stress and anxiety to a sample of evaluators working for state departments of education. What statistical technique can the researcher use to determine whether the information in these 10 measures can be reduced to a smaller number of variables?
A) Factor analysis
B) Multiple regression analysis
C) Path analysis
D) Discriminant analysis
A) Factor analysis
B) Multiple regression analysis
C) Path analysis
D) Discriminant analysis
Unlock Deck
Unlock for access to all 58 flashcards in this deck.
Unlock Deck
k this deck
26
The multiple correlation coefficient between five predictor variables and grades is .50. This finding means that
A) the best single predictor explains 25 percent of the variance in grades.
B) the average correlation between each predictor variable and grades is .10.
C) the combined set of predictor variables explains 25 percent of the variance in grades.
D) the combined set of predictor variables explains 50 percent of the variance in grades.
Unlock Deck
Unlock for access to all 58 flashcards in this deck.
Unlock Deck
k this deck
27
If a researcher wishes to determine how well a combination of predictor variables correlates with a composite of several criterion variables, the appropriate statistical technique to use is
A) path analysis.
B) discriminant analysis.
C) structural equation modeling.
D) canonical correlation.
A) path analysis.
B) discriminant analysis.
C) structural equation modeling.
D) canonical correlation.
Unlock Deck
Unlock for access to all 58 flashcards in this deck.
Unlock Deck
k this deck
28
Hierarchical linear modeling is a statistical technique that can be used for understanding
A) why linear and nonlinear relationships between two variables occur at the school level.
B) how the relationship between two or more variables is affected by different levels of school organization.
C) how the addition of a new predictor variable affects the magnitude of a multiple correlation coefficient.
D) the relationship between variables within different units specified in an organization chart.
Unlock Deck
Unlock for access to all 58 flashcards in this deck.
Unlock Deck
k this deck
29
Path analysis is an appropriate statistical technique when
A) the criterion variable is a dichotomy.
B) the criterion is a composite of variables.
C) the researcher wishes to test a theory about the causal relationships among a set of variables.
D) the researcher wishes to identify clusters of related variables.
A) the criterion variable is a dichotomy.
B) the criterion is a composite of variables.
C) the researcher wishes to test a theory about the causal relationships among a set of variables.
D) the researcher wishes to identify clusters of related variables.
Unlock Deck
Unlock for access to all 58 flashcards in this deck.
Unlock Deck
k this deck
30
An advantage of structural equation modeling over path analysis is that it
A) is much simpler to compute.
B) requires fewer measured variables.
C) yields more valid and reliable measures of the variables to be analyzed.
D) can be used when some or all of the variables are measured as dichotomies or ranks.
A) is much simpler to compute.
B) requires fewer measured variables.
C) yields more valid and reliable measures of the variables to be analyzed.
D) can be used when some or all of the variables are measured as dichotomies or ranks.
Unlock Deck
Unlock for access to all 58 flashcards in this deck.
Unlock Deck
k this deck
31
Suppose a researcher generates a correlation matrix for four variables. How many correlation coefficients would be in the matrix?
A) 9
B) 6
C) 4
D) 10
A) 9
B) 6
C) 4
D) 10
Unlock Deck
Unlock for access to all 58 flashcards in this deck.
Unlock Deck
k this deck
32
A correlation matrix is used to
A) show the extent to which each variable in a set of variables correlates with all the other variables in the set.
B) determine which predictor variables to enter into a multiple regression equation.
C) identify variables that have a restricted range.
D) all of the above.
A) show the extent to which each variable in a set of variables correlates with all the other variables in the set.
B) determine which predictor variables to enter into a multiple regression equation.
C) identify variables that have a restricted range.
D) all of the above.
Unlock Deck
Unlock for access to all 58 flashcards in this deck.
Unlock Deck
k this deck
33
In factor analysis, a factor is
A) the variable that best correlates with all the other variables entered into the factor analysis.
B) the set of variables, among all those measured, that best correlates with the criterion variable.
C) a mathematical expression of the common variance in all the variables entered into the factor analysis.
D) a mathematical expression of the common element in a subset of variables that were entered into the factor analysis and that are correlated with each other.
Unlock Deck
Unlock for access to all 58 flashcards in this deck.
Unlock Deck
k this deck
34
Multiple regression, path analysis, hierarchical linear modeling, and structural equation modeling are similar in that all of them
A) incorporate multiple criterion variables into their equations.
B) involve the analysis of relationships among three or more variables.
C) do not rely on theory to determine which variables should be measured.
D) all of the above.
A) incorporate multiple criterion variables into their equations.
B) involve the analysis of relationships among three or more variables.
C) do not rely on theory to determine which variables should be measured.
D) all of the above.
Unlock Deck
Unlock for access to all 58 flashcards in this deck.
Unlock Deck
k this deck
35
To provide the most powerful test of the causal relationship specified by a theory, a researcher should use
A) multiple regression.
B) differential analysis.
C) structural equation modeling.
D) path analysis.
A) multiple regression.
B) differential analysis.
C) structural equation modeling.
D) path analysis.
Unlock Deck
Unlock for access to all 58 flashcards in this deck.
Unlock Deck
k this deck
36
Suppose that a researcher finds that aptitude test scores predict school grades better for females than for males. This finding indicates that
A) aptitude is a moderator variable.
B) gender is a predictor variable.
C) gender is a moderator variable.
D) a correction for attenuation is needed.
A) aptitude is a moderator variable.
B) gender is a predictor variable.
C) gender is a moderator variable.
D) a correction for attenuation is needed.
Unlock Deck
Unlock for access to all 58 flashcards in this deck.
Unlock Deck
k this deck
37
The size of a research sample
A) determines the type of correlation coefficient that should be calculated.
B) affects the magnitude of an obtained correlation coefficient.
C) has no effect on the statistical significance of a correlation coefficient.
D) affects the statistical significance of a correlation coefficient.
A) determines the type of correlation coefficient that should be calculated.
B) affects the magnitude of an obtained correlation coefficient.
C) has no effect on the statistical significance of a correlation coefficient.
D) affects the statistical significance of a correlation coefficient.
Unlock Deck
Unlock for access to all 58 flashcards in this deck.
Unlock Deck
k this deck
38
A correlation coefficient of .20 between two variables
A) is too small to have practical significance for education.
B) is sufficiently large that it might have practical significance for education.
C) is sufficiently large to have practical significance for education if the measured variables can be linked to a proven theory.
D) is sufficiently large to have implications for theory development, but not foreducational practice.
Unlock Deck
Unlock for access to all 58 flashcards in this deck.
Unlock Deck
k this deck
39
State one advantage and one limitation of correlational research.
Unlock Deck
Unlock for access to all 58 flashcards in this deck.
Unlock Deck
k this deck
40
Describe two types of information that can be obtained from examination of a scattergram of a group's scores on two variables.
Unlock Deck
Unlock for access to all 58 flashcards in this deck.
Unlock Deck
k this deck
41
The correlation between variable X and variable Y is .40. What does this correlation coefficient tell us about: (a) the explained variance in the relationship between X and Y, (b) the direction of the relationship, and(c) whether the relationship is causal?
Unlock Deck
Unlock for access to all 58 flashcards in this deck.
Unlock Deck
k this deck
42
Suppose that you are interested in the nature of ability in graphic art. You identify several variables that you hypothesize to have a causal relationship to artistic ability, such as depth perception, hand-eye coordination, creative imagination, and so on.
a. What type of correlational study would you do with these variables to explore the causes of ability in graphic art?
b. How would this study be conducted?
a. What type of correlational study would you do with these variables to explore the causes of ability in graphic art?
b. How would this study be conducted?
Unlock Deck
Unlock for access to all 58 flashcards in this deck.
Unlock Deck
k this deck
43
A researcher has two sets of scores for a sample of graduating seniors: their scores on a vocabulary test administered just before graduation, and their cumulative gradepoint average (GPA). The researcher finds a high positive correlation between the two sets of scores, and therefore recommends that the vocabulary test be administered to high school freshmen to identify those who are likely to experience academic difficulty during high school. What is the major flaw in this recommendation?
Unlock Deck
Unlock for access to all 58 flashcards in this deck.
Unlock Deck
k this deck
44
Briefly describe two uses of prediction research.
Unlock Deck
Unlock for access to all 58 flashcards in this deck.
Unlock Deck
k this deck
45
A researcher conducts a study of gifted children to determine which of 50 predictor variables are related to academic achievement in a summer enrichment program. They find that three of the measured variables are good predictors. Why is it important to replicate this study before using these predictor variables in selecting students for the program?
Unlock Deck
Unlock for access to all 58 flashcards in this deck.
Unlock Deck
k this deck
46
a. Under what condition would a researcher be likely to compute a correlation ratio?
b. Why is this type of correlation coefficient superior to other types under this condition?
b. Why is this type of correlation coefficient superior to other types under this condition?
Unlock Deck
Unlock for access to all 58 flashcards in this deck.
Unlock Deck
k this deck
47
You are interested in the relationship between anxiety and the willingness to take risks among cadets in training to become police officers. You select a random sample of 200 police officers in a large city and administer a standard anxiety scale with a reliability of .82 and a risk-taking test with a reliability of .68. The correlation you obtain is .42.
a. What technique would you use to estimate what the correlation between anxiety and risk-taking would be if you had perfectly reliable measures?
b. You believe that the sample in your study is much less variable in anxiety than the national population of police officers, having very few cases with low anxiety scores. What technique would you use to estimate what the correlation between anxiety and risk-taking would be if your sample had been as variable as the national population?
Unlock Deck
Unlock for access to all 58 flashcards in this deck.
Unlock Deck
k this deck
48
A researcher is investigating the factors that underlie success or failure in high school mathematics. She measures 30 predictor variables and five criterion variables relating to mathematics learning (e.g., gradepoint average in mathematics coursework, attitudes toward mathematics, and number of mathematics courses taken). What correlation technique should be used to determine (a) which combination of predictor variables best predicts mathematics gradepoint average, (b) which combination of predictor variables best predicts whether a student takes or does not take a course on calculus (which is a dichotomous variable), (c) whether the data support a theoretical model linking some of the predictor variables to one of the criterion variables, and (d) whether there are commonalities in the 30 predictor variables such that they can be reduced to a smaller number of underlying variables?
Unlock Deck
Unlock for access to all 58 flashcards in this deck.
Unlock Deck
k this deck
49
What is the purpose of a correlation matrix?
Unlock Deck
Unlock for access to all 58 flashcards in this deck.
Unlock Deck
k this deck
50
State one similarity between path analysis and structural equation modeling.
Unlock Deck
Unlock for access to all 58 flashcards in this deck.
Unlock Deck
k this deck
51
A researcher obtains a correlation coefficient of .29 between scores on a diagnostic test and a test of first-grade reading achievement for a large sample of ethnically diverse children.
a. Why might the researcher do a follow-up correlational analysis in which this correlation coefficient is computed separately for the major ethnic groups in the sample?
b. What is the technical term for the variable of ethnicity in the follow-up analysis?
a. Why might the researcher do a follow-up correlational analysis in which this correlation coefficient is computed separately for the major ethnic groups in the sample?
b. What is the technical term for the variable of ethnicity in the follow-up analysis?
Unlock Deck
Unlock for access to all 58 flashcards in this deck.
Unlock Deck
k this deck
52
What are two factors that determine whether an obtained correlation coefficient will be statistically significant?
Unlock Deck
Unlock for access to all 58 flashcards in this deck.
Unlock Deck
k this deck
53
A team of researchers decide to investigate possible determinants of interest in science among elementary school children. First they develop and validate a measure of this variable. Then they locates tests that measure as many variables as possible in as short a time as possible to correlate with this interest test. Their reasoning is that they will increase the likelihood of discovering significant relationships if they maximize the number of variables in the correlational design. What is wrong with the researchers' reasoning, and how could they improve their research design?
Unlock Deck
Unlock for access to all 58 flashcards in this deck.
Unlock Deck
k this deck
54
Researchers intercorrelate a number of measures that they have collected on a sample of college seniors. They find a correlation of .65 between (1) the amount of time a student has been employed during his or her college years and(2) a paper-and-pencil measure of the student's personal maturity. On the basis of this finding, would they be justified in concluding that
a. the college should institute a work-study program in order to increase the maturity level of its students? Explain your answer.
b. the longer students have worked during college, the higher will be their score on the personal maturity measure? Explain your answer.
c. more mature students are better able to obtain jobs while in college than their less mature peers? Explain your answer.
Unlock Deck
Unlock for access to all 58 flashcards in this deck.
Unlock Deck
k this deck
55
A researcher administered a battery of 20 different tests to a group of entering medical students. She also collected their gradepoint average (GPA) at the end of their first year of medical school. What statistical technique should be used to maximize the usefulness of the 20 tests as predictors of GPA, and why?
Unlock Deck
Unlock for access to all 58 flashcards in this deck.
Unlock Deck
k this deck
56
A researcher has collected a large amount of data on a sample of college students: scores on the Stanford-Binet Intelligence Scale, scores on the Wechsler Adult Intelligence Scale, scores on the Scholastic Aptitude Test (SAT), high school class rank, scores on a test anxiety scale, and whether the students successfully completed the first year of college (pass-fail and gradepoint average). Answer the following questions about the appropriate correlational analyses to be conducted on these data:
a. What correlational technique should be used to determine whether scores on the Stanford-Binet are related to scores on the Wechsler scale? Why this technique?
b. The researcher finds that test anxiety correlates significantly with the criterion variable of gradepoint average in the first year of college. The SAT also correlates significantly with test anxiety and the criterion. What statistical technique should be used to determine the correlation between test anxiety and college gradepoint average after the influence of SAT on both variables has been removed?
c. What correlational technique should be used to determine whether all of the tests used in this study, when intercorrelated, measure a common factor?
d. What correlational technique should be used to determine whether the relationship between scores on the test anxiety scale and high school class rank is nonlinear?
Unlock Deck
Unlock for access to all 58 flashcards in this deck.
Unlock Deck
k this deck
57
Researcher A correlates scores on a predictor variable and a criterion variable and obtains a correlation coefficient that is statistically significant but of no practical significance. Researcher B correlates scores on a different predictor variable and the same criterion variable and obtains a correlation coefficient that is not statistically significant but of practical significance.
a. How can researcher B's correlation coefficient be significant in a practical sense but not in a statistical sense?
b. How can researcher A's correlation coefficient be significant in a statistical sense but not in a practical sense?
a. How can researcher B's correlation coefficient be significant in a practical sense but not in a statistical sense?
b. How can researcher A's correlation coefficient be significant in a statistical sense but not in a practical sense?
Unlock Deck
Unlock for access to all 58 flashcards in this deck.
Unlock Deck
k this deck
58
A team of researchers administered a personality inventory that measures 15 personality traits to a group of entering students in a doctoral program in education. They also determined students' gradepoint average (GPA) at the end of the first year of the program. They then used multiple regression to determine which combination of personality traits best predicts GPA in this situation. The following is their table of results.
a. What information is provided by the beta weights in the first data column?
b. What information is provided by the fact that the beta weight for conformity is .35, whereas for introversion it is .21?
c. What does the correlation coefficient of .15 for independence in the second data column mean?
d. What does the multiple correlation coefficient of .37 in the third data column mean?
e. What does the R2 value of .08 in the fourth data column mean?
f. What does the R2 increment of .02 in the fifth data column mean?
Unlock Deck
Unlock for access to all 58 flashcards in this deck.
Unlock Deck
k this deck
Unlock Deck
Unlock for access to all 58 flashcards in this deck.


