Deck 4: Demand Supply and Market Equilibrium
Full screen (f)
Question
Question
Question
Question
Exhibit
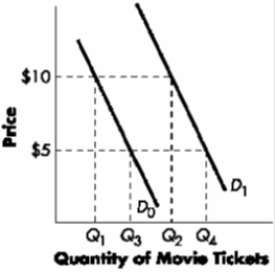
-Refer to Exhibit. The University Theater faces market demand curve D0 and has begun charging $10, up from $5, for tickets for Friday and Saturday night shows. As a result, students have:
A)increased their demand for tickets to Q4.
B)increased their quantity of tickets demanded to Q4.
C)decreased their demand for tickets to Q1.
D)decreased their quantity of tickets demanded to Q1.
Question
Question
Question
Exhibit
?
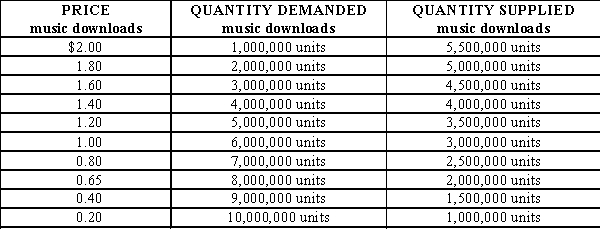
-Refer to Exhibit. What is the equilibrium price in the example?
A)$0.80
B)$1.00
C)$1.20
D)$1.40
?
-Refer to Exhibit. What is the equilibrium price in the example?
A)$0.80
B)$1.00
C)$1.20
D)$1.40
Question
Exhibit
?
-Refer to Exhibit. At $0.40 there is a ____ of ____ downloads.
A)surplus; 10,500,000
B)surplus; 7,500,000
C)shortage; 7,500,000
D)shortage; 10,500,000
?
-Refer to Exhibit. At $0.40 there is a ____ of ____ downloads.
A)surplus; 10,500,000
B)surplus; 7,500,000
C)shortage; 7,500,000
D)shortage; 10,500,000
Question
Exhibit
?
-Refer to Exhibit. At $1.80 there is a ____ of ____ downloads.
A)shortage; 3,000,000
B)shortage; 7,000,000
C)surplus; 7,000,000
D)surplus; 3,000,000
?
-Refer to Exhibit. At $1.80 there is a ____ of ____ downloads.
A)shortage; 3,000,000
B)shortage; 7,000,000
C)surplus; 7,000,000
D)surplus; 3,000,000
Question
Question
Question
Question
Question
Question
?Exhibit
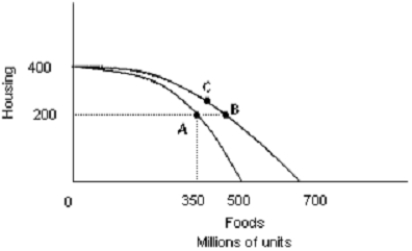
-Refer to Exhibit. Assuming that the production possibilities curve extends out farther as indicated above due to technological change, which of the following observations is correct?
A)There is a technological advance in food production but not in housing production.
B)There is a technological advance in housing production but not in food production.
C)There is a technological advance in both housing and food production.
D)none of the above

Unlock Deck
Sign up to unlock the cards in this deck!
Unlock Deck
Unlock Deck
1/15
Play
Full screen (f)
Deck 4: Demand Supply and Market Equilibrium
1
A downward-sloping demand curve shows:
A)the direct relationship between price and quantity supplied; as price increases, the quantity supplied increases.
B)the inverse relationship between price and quantity supplied; as price increases, the quantity supplied decreases.
C)the direct relationship between price and quantity demanded; as price increases, the quantity demanded increases.
D)the inverse relationship between price and quantity demanded; as price increases, the quantity demanded decreases.
the inverse relationship between price and quantity demanded; as price increases, the quantity demanded decreases.
2
Exhibit 4-1
-Refer to Exhibit. Shown are the demand schedules for gourmet ice cream of two individuals and the rest of the market. At a price of $8, the quantity demanded in the market would be:
A)12
B)22
C)31
D)39
-Refer to Exhibit. Shown are the demand schedules for gourmet ice cream of two individuals and the rest of the market. At a price of $8, the quantity demanded in the market would be:
A)12
B)22
C)31
D)39
12
3
The difference between a change in quantity demanded and a change in demand is that a change in:
A)quantity demanded is caused by a change in a good's own current price, while a change in demand is caused by a change in some other variable, such as income, tastes, or expectations.
B)demand is caused by a change in a good's own current price, while a change in quantity demanded is caused by a change in some other variable, such as income, tastes, or expectations.
C)quantity demanded is a change in the amount people actually buy, while a change in demand is a change in the amount they want to buy.
D)A change in demand and a change in quantity demanded are the same thing.
quantity demanded is caused by a change in a good's own current price, while a change in demand is caused by a change in some other variable, such as income, tastes, or expectations.
4
Exhibit
-Refer to Exhibit. The University Theater faces market demand curve D0 and has begun charging $10, up from $5, for tickets for Friday and Saturday night shows. As a result, students have:
A)increased their demand for tickets to Q4.
B)increased their quantity of tickets demanded to Q4.
C)decreased their demand for tickets to Q1.
D)decreased their quantity of tickets demanded to Q1.
Unlock Deck
Unlock for access to all 15 flashcards in this deck.
Unlock Deck
k this deck
5
Skippy loves peanut butter. Skippy reads on the internet that 75 percent of the peanut crop in the South has been wiped out by drought, and that this will cause the price of peanuts to more than double by the end of the year. As a result,
A)Skippy's demand for peanut butter will increase, but not until the end of the year.
B)Skippy's demand for peanut butter increases today.
C)Skippy's demand for peanut butter decreases as he considers buying almond butter.
D)Skippy's demand for peanut butter shifts left today.
A)Skippy's demand for peanut butter will increase, but not until the end of the year.
B)Skippy's demand for peanut butter increases today.
C)Skippy's demand for peanut butter decreases as he considers buying almond butter.
D)Skippy's demand for peanut butter shifts left today.
Unlock Deck
Unlock for access to all 15 flashcards in this deck.
Unlock Deck
k this deck
6
Refer to the table below. If these three firms represented the entire market, how many mid-sized autos would be supplied at a price of $30,000??
A)43,000
B)54,000
C)126,000
D)158,000
A)43,000
B)54,000
C)126,000
D)158,000
Unlock Deck
Unlock for access to all 15 flashcards in this deck.
Unlock Deck
k this deck
7
Exhibit
?
-Refer to Exhibit. What is the equilibrium price in the example?
A)$0.80
B)$1.00
C)$1.20
D)$1.40
?
-Refer to Exhibit. What is the equilibrium price in the example?
A)$0.80
B)$1.00
C)$1.20
D)$1.40
Unlock Deck
Unlock for access to all 15 flashcards in this deck.
Unlock Deck
k this deck
8
Exhibit
?
-Refer to Exhibit. At $0.40 there is a ____ of ____ downloads.
A)surplus; 10,500,000
B)surplus; 7,500,000
C)shortage; 7,500,000
D)shortage; 10,500,000
?
-Refer to Exhibit. At $0.40 there is a ____ of ____ downloads.
A)surplus; 10,500,000
B)surplus; 7,500,000
C)shortage; 7,500,000
D)shortage; 10,500,000
Unlock Deck
Unlock for access to all 15 flashcards in this deck.
Unlock Deck
k this deck
9
Exhibit
?
-Refer to Exhibit. At $1.80 there is a ____ of ____ downloads.
A)shortage; 3,000,000
B)shortage; 7,000,000
C)surplus; 7,000,000
D)surplus; 3,000,000
?
-Refer to Exhibit. At $1.80 there is a ____ of ____ downloads.
A)shortage; 3,000,000
B)shortage; 7,000,000
C)surplus; 7,000,000
D)surplus; 3,000,000
Unlock Deck
Unlock for access to all 15 flashcards in this deck.
Unlock Deck
k this deck
10
Exhibit
The diagram below represents the market for butter.
-Refer to Exhibit. The equilibrium price of butter is:
A)$5
B)$3
C)$2
D)none of the above
The diagram below represents the market for butter.
-Refer to Exhibit. The equilibrium price of butter is:
A)$5
B)$3
C)$2
D)none of the above
Unlock Deck
Unlock for access to all 15 flashcards in this deck.
Unlock Deck
k this deck
11
Exhibit
The diagram below represents the market for butter.
-Refer to Exhibit. If the current price of butter equals $5, you would expect to find:
A)the market in equilibrium at 2,000 pounds per year.
B)the market in equilibrium at 8,000 pounds per year.
C)that the market is not in equilibrium, and that the quantity supplied is greater than the quantity demanded.
D)that the market is not in equilibrium, and that the quantity demanded is greater than the quantity supplied.
Unlock Deck
Unlock for access to all 15 flashcards in this deck.
Unlock Deck
k this deck
12
Exhibit
The diagram below represents the market for butter.
-Refer to Exhibit. If the current price of butter equals $2, you would expect to find:
A)the market in equilibrium at 3,000 pounds per year.
B)the market in equilibrium at 8,000 pounds per year.
C)that the market is not in equilibrium, and that the quantity supplied is greater than the quantity demanded.
D)that the market is not in equilibrium, and that the quantity demanded is greater than the quantity supplied.
Unlock Deck
Unlock for access to all 15 flashcards in this deck.
Unlock Deck
k this deck
13
Exhibit
The diagram below represents the market for butter.
-Refer to Exhibit. At a market price of $4, there exists a:
A)shortage equal to 4,000 pounds of butter.
B)surplus equal to 4,000 pounds of butter.
C)shortage equal to 7,000 pounds of butter.
D)surplus equal to 7,000 pounds of butter.
The diagram below represents the market for butter.
-Refer to Exhibit. At a market price of $4, there exists a:
A)shortage equal to 4,000 pounds of butter.
B)surplus equal to 4,000 pounds of butter.
C)shortage equal to 7,000 pounds of butter.
D)surplus equal to 7,000 pounds of butter.
Unlock Deck
Unlock for access to all 15 flashcards in this deck.
Unlock Deck
k this deck
14
Exhibit
The diagram below represents the market for butter.
-Refer to Exhibit. At a market price of $1, there exists a:
A)shortage equal to 5,000 pounds of butter.
B)surplus equal to 5,000 pounds of butter.
C)shortage equal to 11,000 pounds of butter.
D)surplus equal to 11,000 pounds of butter.
The diagram below represents the market for butter.
-Refer to Exhibit. At a market price of $1, there exists a:
A)shortage equal to 5,000 pounds of butter.
B)surplus equal to 5,000 pounds of butter.
C)shortage equal to 11,000 pounds of butter.
D)surplus equal to 11,000 pounds of butter.
Unlock Deck
Unlock for access to all 15 flashcards in this deck.
Unlock Deck
k this deck
15
?Exhibit
-Refer to Exhibit. Assuming that the production possibilities curve extends out farther as indicated above due to technological change, which of the following observations is correct?
A)There is a technological advance in food production but not in housing production.
B)There is a technological advance in housing production but not in food production.
C)There is a technological advance in both housing and food production.
D)none of the above
Unlock Deck
Unlock for access to all 15 flashcards in this deck.
Unlock Deck
k this deck
Unlock Deck
Unlock for access to all 15 flashcards in this deck.


