Deck 4: Sellers and Incentives,aggregate Incomes
Full screen (f)
Question
A car repair shop hires workers and pays them the federal minimum wage of $7.25. The following table shows the marginal returns to each worker in terms of number of cars repaired.
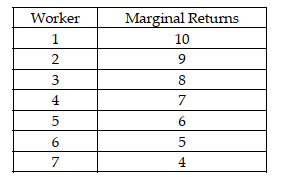
-Refer to the scenario above. In addition, suppose the fixed cost of operating this shop is $1,000 per day. If 3 workers are hired at the federal minimum wage of $7.25, what is the total cost of this shop?
A) $21.75
B) $1,021.75
C) $1,042.75
D) $3,000
-Refer to the scenario above. In addition, suppose the fixed cost of operating this shop is $1,000 per day. If 3 workers are hired at the federal minimum wage of $7.25, what is the total cost of this shop?
A) $21.75
B) $1,021.75
C) $1,042.75
D) $3,000
Question
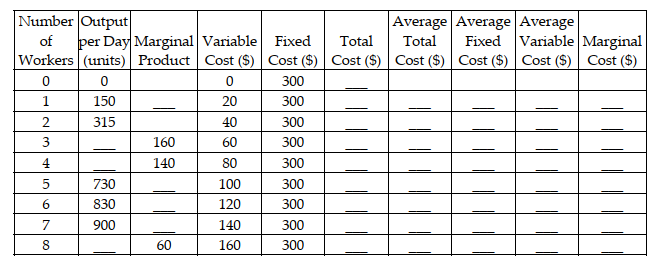
The following table shows the output and cost figures for a bakery. Calculate the missing values in the table.
Question
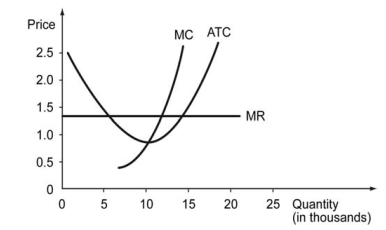
The figure below shows cost curves of a firm in a competitive market. The firm always makes the choice to maximize its profit.
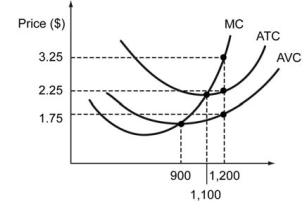
-Refer to the figure above. If the market price of the product is $3.25, what is the firm's revenue?
A) $3,900
B) $3,575
C) $2,700
D) $2,100
-Refer to the figure above. If the market price of the product is $3.25, what is the firm's revenue?
A) $3,900
B) $3,575
C) $2,700
D) $2,100
Question
The figure below shows the cost curves of a firm in a competitive market. The firm always makes the choice to maximize its profit.
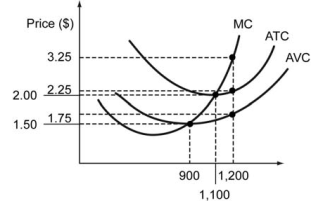
-Refer to the figure above. If the market price of the product is $3.25, the firm's profit maximizing output is ________ and the firm's maximum profit is ________.
A) 1,200 units; $1,200
B) 1,200 units; $1,800
C) 1,100 units; $875
D) 1,100 units; $600
-Refer to the figure above. If the market price of the product is $3.25, the firm's profit maximizing output is ________ and the firm's maximum profit is ________.
A) 1,200 units; $1,200
B) 1,200 units; $1,800
C) 1,100 units; $875
D) 1,100 units; $600
Question
The figure below shows the marginal cost (circles) and the average variable cost (crosses) of a firm in a competitive market. The firm always makes the choice to maximize its profit.
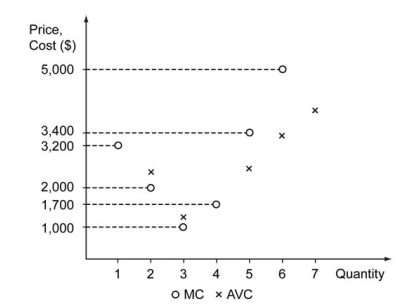
-Refer to the figure above. If the market price of the product is $5,000, what is the firm's producer surplus?
A) $30,000
B) $18,400
C) $13,700
D) $4,900
-Refer to the figure above. If the market price of the product is $5,000, what is the firm's producer surplus?
A) $30,000
B) $18,400
C) $13,700
D) $4,900
Question
The figure below shows the marginal cost (circles) and the average variable cost (crosses) of a firm in a competitive market. The firm always makes the choice to maximize its profit.
-Refer to the figure above. If the market price of the product is $3,400, what is the firm's producer surplus?
A) $5,700
B) $3,250
C) $1,700
D) $880
-Refer to the figure above. If the market price of the product is $3,400, what is the firm's producer surplus?
A) $5,700
B) $3,250
C) $1,700
D) $880
Question
The figure below shows the marginal cost (circles) and the average variable cost (crosses) of a firm in a competitive market. The firm always makes the choice to maximize its profit.
-Refer to the figure above. If the market price of the product fell from $5,000 to $3,400, what is the loss of the firm's producer surplus?
A) $11,250
B) $8,000
C) $1,600
D) $800
-Refer to the figure above. If the market price of the product fell from $5,000 to $3,400, what is the loss of the firm's producer surplus?
A) $11,250
B) $8,000
C) $1,600
D) $800
Question
Define producer surplus. Calculate the producer surplus from the following figure.
Question
Question
The following figure shows the cost curves on a firm that operates in a competitive market. Assume that all the firms in this market have identical cost structure.
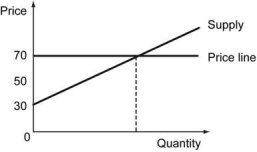
-Refer to the graph above. Which of the following graphs correctly represents this competitive market's demand and supply in the short run?
A)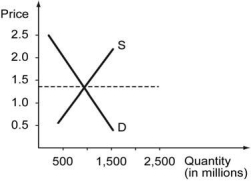
B)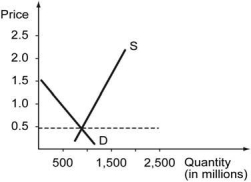
C)
D)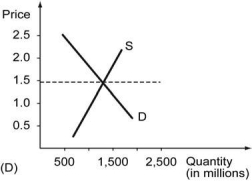
-Refer to the graph above. Which of the following graphs correctly represents this competitive market's demand and supply in the short run?
A)
B)
C)
D)
Question
The following figure shows the cost curves on a firm that operates in a competitive market. Assume that all the firms in this market have identical cost structure.
-Refer to the graph above. Which of the following graphs, correctly represents this competitive marke's demand and supply in the long run?
A)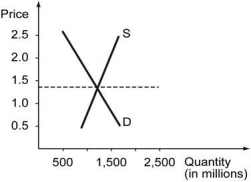
B)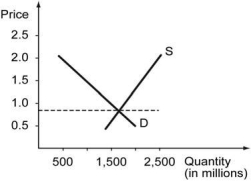
C)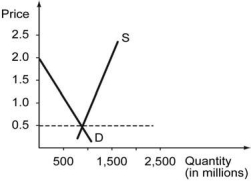
D)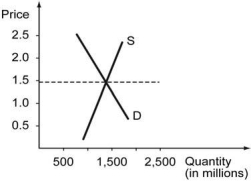
-Refer to the graph above. Which of the following graphs, correctly represents this competitive marke's demand and supply in the long run?
A)
B)
C)
D)
Question
Suppose the market for AR-15 style rifles in the United States was in an initial long-run equilibrium. In the fall of 2012, the demand for these rifles increased substantially due to concerns that President Obama would either ban or restrict the sale of these semi-automatic rifles. As a result, the market price of these rifles increased, and gun manufacturers earned positive economic profits (shown in the figure below). 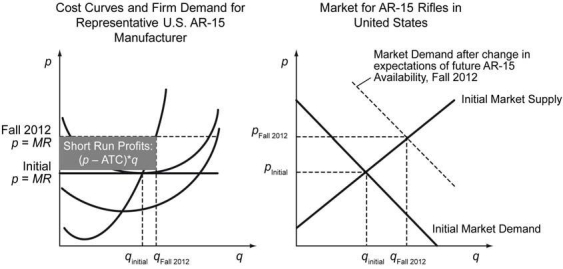 The presence of economic profits in the short-run will lead to the ________.
A) entry of new firms and cause the market supply curve to shift out until the final market price equals the minimum of the average total cost for the representative firm
B) entry of new firms and cause the market demand curve to shift in until the final market price equals the minimum of the average total cost for the representative firm
C) exit of existing firms from the industry and cause the market supply curve to shift in, raising profits for existing firms
D) exit of existing firms from the industry and cause the market demand curve to shift in until the final market price equals the minimum of the average total cost for the representative firm
The presence of economic profits in the short-run will lead to the ________.A) entry of new firms and cause the market supply curve to shift out until the final market price equals the minimum of the average total cost for the representative firm
B) entry of new firms and cause the market demand curve to shift in until the final market price equals the minimum of the average total cost for the representative firm
C) exit of existing firms from the industry and cause the market supply curve to shift in, raising profits for existing firms
D) exit of existing firms from the industry and cause the market demand curve to shift in until the final market price equals the minimum of the average total cost for the representative firm
Question
Question
Question
Question
The following table shows economic data for two countries.
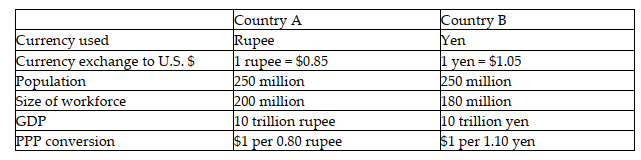
-Refer to the table above. Income per worker in Country B is equal to ________.
A) $42,000
B) $58,333
C) $55,555
D) $50,505
-Refer to the table above. Income per worker in Country B is equal to ________.
A) $42,000
B) $58,333
C) $55,555
D) $50,505
Question
Question
Question
Question
Question
Question
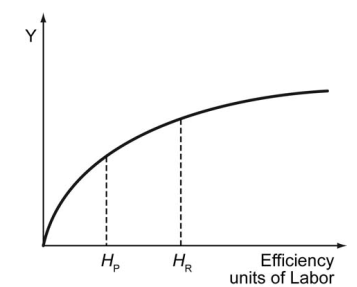
Red Country and Purple Country have identical aggregate production functions. The amount of physical capital stock available to each country is equal. Labor supply in Red Country is HR, while the labor supply in Purple Country is HP.
-Refer to the scenario above. Population growth is relatively slower in Purple Country than in Red Country, but increased teacher salaries have helped increase high school and college graduation rates. Over time, how will output and total efficiency units of labor likely change in Purple Country?
A) Output will increase faster and total efficiency units will increase slower than in Red Country.
B) Output may or may not increase faster and total efficiency units will increase faster than in Red Country.
C) Output will increase slower and total efficiency units may or may not increase faster than in Red Country.
D) Output may or may not increase faster and total efficiency units may or may not increase faster than in Red Country.
Question
Question
Question
Question
Question
Question
Question

Unlock Deck
Sign up to unlock the cards in this deck!
Unlock Deck
Unlock Deck
1/29
Play
Full screen (f)
Deck 4: Sellers and Incentives,aggregate Incomes
1
A car repair shop hires workers and pays them the federal minimum wage of $7.25. The following table shows the marginal returns to each worker in terms of number of cars repaired.
-Refer to the scenario above. In addition, suppose the fixed cost of operating this shop is $1,000 per day. If 3 workers are hired at the federal minimum wage of $7.25, what is the total cost of this shop?
A) $21.75
B) $1,021.75
C) $1,042.75
D) $3,000
-Refer to the scenario above. In addition, suppose the fixed cost of operating this shop is $1,000 per day. If 3 workers are hired at the federal minimum wage of $7.25, what is the total cost of this shop?
A) $21.75
B) $1,021.75
C) $1,042.75
D) $3,000
$1,021.75
2
The following table shows the output and cost figures for a bakery. Calculate the missing values in the table.
The values are shown in the following table.

3
The figure below shows cost curves of a firm in a competitive market. The firm always makes the choice to maximize its profit.
-Refer to the figure above. If the market price of the product is $3.25, what is the firm's revenue?
A) $3,900
B) $3,575
C) $2,700
D) $2,100
-Refer to the figure above. If the market price of the product is $3.25, what is the firm's revenue?
A) $3,900
B) $3,575
C) $2,700
D) $2,100
$3,900
4
The figure below shows the cost curves of a firm in a competitive market. The firm always makes the choice to maximize its profit.
-Refer to the figure above. If the market price of the product is $3.25, the firm's profit maximizing output is ________ and the firm's maximum profit is ________.
A) 1,200 units; $1,200
B) 1,200 units; $1,800
C) 1,100 units; $875
D) 1,100 units; $600
-Refer to the figure above. If the market price of the product is $3.25, the firm's profit maximizing output is ________ and the firm's maximum profit is ________.
A) 1,200 units; $1,200
B) 1,200 units; $1,800
C) 1,100 units; $875
D) 1,100 units; $600
Unlock Deck
Unlock for access to all 29 flashcards in this deck.
Unlock Deck
k this deck
5
The figure below shows the marginal cost (circles) and the average variable cost (crosses) of a firm in a competitive market. The firm always makes the choice to maximize its profit.
-Refer to the figure above. If the market price of the product is $5,000, what is the firm's producer surplus?
A) $30,000
B) $18,400
C) $13,700
D) $4,900
-Refer to the figure above. If the market price of the product is $5,000, what is the firm's producer surplus?
A) $30,000
B) $18,400
C) $13,700
D) $4,900
Unlock Deck
Unlock for access to all 29 flashcards in this deck.
Unlock Deck
k this deck
6
The figure below shows the marginal cost (circles) and the average variable cost (crosses) of a firm in a competitive market. The firm always makes the choice to maximize its profit.
-Refer to the figure above. If the market price of the product is $3,400, what is the firm's producer surplus?
A) $5,700
B) $3,250
C) $1,700
D) $880
-Refer to the figure above. If the market price of the product is $3,400, what is the firm's producer surplus?
A) $5,700
B) $3,250
C) $1,700
D) $880
Unlock Deck
Unlock for access to all 29 flashcards in this deck.
Unlock Deck
k this deck
7
The figure below shows the marginal cost (circles) and the average variable cost (crosses) of a firm in a competitive market. The firm always makes the choice to maximize its profit.
-Refer to the figure above. If the market price of the product fell from $5,000 to $3,400, what is the loss of the firm's producer surplus?
A) $11,250
B) $8,000
C) $1,600
D) $800
-Refer to the figure above. If the market price of the product fell from $5,000 to $3,400, what is the loss of the firm's producer surplus?
A) $11,250
B) $8,000
C) $1,600
D) $800
Unlock Deck
Unlock for access to all 29 flashcards in this deck.
Unlock Deck
k this deck
8
Define producer surplus. Calculate the producer surplus from the following figure.
Unlock Deck
Unlock for access to all 29 flashcards in this deck.
Unlock Deck
k this deck
9
In The Wealth of Nations, Adam Smith argued that "the division of labor [specialization] was limited by the extent of the market."(Bracketed remark added.) Which of the following best explains Smith's argument?
A) Specialization and the firm's moving down its average total cost curve requires that the demand facing the firm is sufficiently large.
B) Specialization and the firm's moving down its average total cost curve requires the firm to have increasing marginal costs.
C) Specialization and the firm moving down its average total cost curve requires the government to grant firm's legal monopolies.
D) Specialization and the firm moving down its average total cost curve will lead to the firm realizing economic losses.
Unlock Deck
Unlock for access to all 29 flashcards in this deck.
Unlock Deck
k this deck
10
The following figure shows the cost curves on a firm that operates in a competitive market. Assume that all the firms in this market have identical cost structure.
-Refer to the graph above. Which of the following graphs correctly represents this competitive market's demand and supply in the short run?
A)
B)
C)
D)
-Refer to the graph above. Which of the following graphs correctly represents this competitive market's demand and supply in the short run?
A)
B)
C)
D)
Unlock Deck
Unlock for access to all 29 flashcards in this deck.
Unlock Deck
k this deck
11
The following figure shows the cost curves on a firm that operates in a competitive market. Assume that all the firms in this market have identical cost structure.
-Refer to the graph above. Which of the following graphs, correctly represents this competitive marke's demand and supply in the long run?
A)
B)
C)
D)
-Refer to the graph above. Which of the following graphs, correctly represents this competitive marke's demand and supply in the long run?
A)
B)
C)
D)
Unlock Deck
Unlock for access to all 29 flashcards in this deck.
Unlock Deck
k this deck
12
Suppose the market for AR-15 style rifles in the United States was in an initial long-run equilibrium. In the fall of 2012, the demand for these rifles increased substantially due to concerns that President Obama would either ban or restrict the sale of these semi-automatic rifles. As a result, the market price of these rifles increased, and gun manufacturers earned positive economic profits (shown in the figure below). The presence of economic profits in the short-run will lead to the ________.
A) entry of new firms and cause the market supply curve to shift out until the final market price equals the minimum of the average total cost for the representative firm
B) entry of new firms and cause the market demand curve to shift in until the final market price equals the minimum of the average total cost for the representative firm
C) exit of existing firms from the industry and cause the market supply curve to shift in, raising profits for existing firms
D) exit of existing firms from the industry and cause the market demand curve to shift in until the final market price equals the minimum of the average total cost for the representative firm
The presence of economic profits in the short-run will lead to the ________.A) entry of new firms and cause the market supply curve to shift out until the final market price equals the minimum of the average total cost for the representative firm
B) entry of new firms and cause the market demand curve to shift in until the final market price equals the minimum of the average total cost for the representative firm
C) exit of existing firms from the industry and cause the market supply curve to shift in, raising profits for existing firms
D) exit of existing firms from the industry and cause the market demand curve to shift in until the final market price equals the minimum of the average total cost for the representative firm
Unlock Deck
Unlock for access to all 29 flashcards in this deck.
Unlock Deck
k this deck
13
The income per capita in a country with a population of 50,000 is $4,500. Its GDP is ________.
A) $54,500
B) $900,000
C) $120,000,000
D) $225,000,000
A) $54,500
B) $900,000
C) $120,000,000
D) $225,000,000
Unlock Deck
Unlock for access to all 29 flashcards in this deck.
Unlock Deck
k this deck
14
If the aggregate income of an island country is $8 million and income per capita is $5,000, the total population of the island is ________.
A) 1,600
B) 20,000
C) 40,000
D) 106,000
A) 1,600
B) 20,000
C) 40,000
D) 106,000
Unlock Deck
Unlock for access to all 29 flashcards in this deck.
Unlock Deck
k this deck
15
If the income per capita in United Kingdom is £23,800 and the dollar per pound exchange rate is 1.68 in 2014, then income per capita in the United Kingdom in U.S. dollars in the same year is ________.
A) $12,812
B) $22,829
C) $30,400
D) $39,984
A) $12,812
B) $22,829
C) $30,400
D) $39,984
Unlock Deck
Unlock for access to all 29 flashcards in this deck.
Unlock Deck
k this deck
16
The following table shows economic data for two countries.
-Refer to the table above. Income per worker in Country B is equal to ________.
A) $42,000
B) $58,333
C) $55,555
D) $50,505
-Refer to the table above. Income per worker in Country B is equal to ________.
A) $42,000
B) $58,333
C) $55,555
D) $50,505
Unlock Deck
Unlock for access to all 29 flashcards in this deck.
Unlock Deck
k this deck
17
The price of a standard basket of goods in Country A is 10 pesos. The price of the same basket of goods in country B is 25 francs and $5 in the United States. Country A has an income per capita of 60,000 pesos, and country B has an income per capita of 100,000 francs. Assume full employment in both countries.
-Refer to the scenario above. The difference between the GDP per capita in Country A and country B is________.
A) $20,000
B) $40,000
C) $10,000
D) $60,000
-Refer to the scenario above. The difference between the GDP per capita in Country A and country B is________.
A) $20,000
B) $40,000
C) $10,000
D) $60,000
Unlock Deck
Unlock for access to all 29 flashcards in this deck.
Unlock Deck
k this deck
18
The price of a standard basket of goods in Country A is 10 pesos. The price of the same basket of goods in country B is 25 francs and $5 in the United States. Country A has an income per capita of 60,000 pesos, and country B has an income per capita of 100,000 francs. Assume full employment in both countries.
-Refer to the scenario above. Suppose Country A passes a law that requires all workers to complete repeated safety workshops. One year after the law was passed, workers are on average 5 percent less productive. Workers in Country B continue to produce at the same rate as the year before. During the same year, the population in Country A and in Country B increases by 2 percent. Consequently, 1 year after Country A passed the new law, ________.
A) workers in Country B on average are more productive than workers in Country A
B) GDP in Country A increases, but GDP in Country B may or may not increase
C) GDP per capita in Country A decreases, and GDP per capita in Country B increases
D) GDP per capita in Country A decreases, while GDP in Country A may or may not increase
Unlock Deck
Unlock for access to all 29 flashcards in this deck.
Unlock Deck
k this deck
19
If the number of workers in a country is 12,000 and its income per worker is $380, its GDP is ________.
A) $1,240,000
B) $4,560,000
C) $524,000
D) $618,000
A) $1,240,000
B) $4,560,000
C) $524,000
D) $618,000
Unlock Deck
Unlock for access to all 29 flashcards in this deck.
Unlock Deck
k this deck
20
In Lutheria, there are 10,000 people in the age group of 0-14 years, 30,000 people are employed, and 2,000 people are unemployed. Lutheria?s GDP, measured in luthers, is 1 billion. Income per worker in Lutheria is ________ luthers.
A) 10,000
B) 23,667
C) 28,999
D) 33,333
A) 10,000
B) 23,667
C) 28,999
D) 33,333
Unlock Deck
Unlock for access to all 29 flashcards in this deck.
Unlock Deck
k this deck
21
The total number of workers in two different countries is equal. However, workers in Country A are three times more productive than workers in Country B. Which of the following is true in this case?
A) The total efficiency units of labor in Country A is one-third the total efficiency units of labor in Country B.
B) The total efficiency units of labor in Country A is three times more than the total efficiency units of labor in Country B.
C) The physical capital stock in Country B is three times more than the physical capital stock in Country A.
D) The total efficiency units of labor in Country B is six times more than the total efficiency units of labor in Country B.
Unlock Deck
Unlock for access to all 29 flashcards in this deck.
Unlock Deck
k this deck
22
Red Country and Purple Country have identical aggregate production functions. The amount of physical capital stock available to each country is equal. Labor supply in Red Country is HR, while the labor supply in Purple Country is HP.
-Refer to the scenario above. Population growth is relatively slower in Purple Country than in Red Country, but increased teacher salaries have helped increase high school and college graduation rates. Over time, how will output and total efficiency units of labor likely change in Purple Country?
A) Output will increase faster and total efficiency units will increase slower than in Red Country.
B) Output may or may not increase faster and total efficiency units will increase faster than in Red Country.
C) Output will increase slower and total efficiency units may or may not increase faster than in Red Country.
D) Output may or may not increase faster and total efficiency units may or may not increase faster than in Red Country.
-Refer to the scenario above. Population growth is relatively slower in Purple Country than in Red Country, but increased teacher salaries have helped increase high school and college graduation rates. Over time, how will output and total efficiency units of labor likely change in Purple Country?
A) Output will increase faster and total efficiency units will increase slower than in Red Country.
B) Output may or may not increase faster and total efficiency units will increase faster than in Red Country.
C) Output will increase slower and total efficiency units may or may not increase faster than in Red Country.
D) Output may or may not increase faster and total efficiency units may or may not increase faster than in Red Country.
Unlock Deck
Unlock for access to all 29 flashcards in this deck.
Unlock Deck
k this deck
23
Two economies, A and B, have identical aggregate production functions with diminishing returns. In both economies, capital and labor are equally important for production. Economy A has twice as many efficiency units of labor as economy B. Economy B has twice as much physical capital stock as economy A.
-Refer to the scenario above. If you were to draw the aggregate production functions for economies A and B, holding physical capital stock constant at each county's given level, you would draw ________.
A) one aggregate production function, where economy B?s level of production is greater than economy A?s level of production
B) two separate aggregate production functions, where the one for economy B lies above the one for economy A
C) one aggregate production function, where both economies? output are at the same level
D) two separate aggregate production functions where the one for economy A lies above the one for economy B
Unlock Deck
Unlock for access to all 29 flashcards in this deck.
Unlock Deck
k this deck
24
Country A has a smaller stock of capital than Country B, but the supply of labor in both countries is equal. What does this imply?
A) The increase in output due to the use of an additional unit of capital will be smaller in Country A than in Country B.
B) The increase in output due to the use of an additional unit of capital will be larger in Country A than in Country B.
C) The use of an additional unit of capital will increase output in Country A only if there is an increase in the total efficiency units of labor.
D) The use of an additional unit of capital will increase output in Country B only if there is an increase in the total efficiency units of labor.
Unlock Deck
Unlock for access to all 29 flashcards in this deck.
Unlock Deck
k this deck
25
What is Moore?s Law?
Unlock Deck
Unlock for access to all 29 flashcards in this deck.
Unlock Deck
k this deck
26
Two countries, Rhodia and Rubium, have identical production functions in the form Y = A × K0.25 × H0.75, where Y denotes total output, A denotes the level of technology, K denotes the physical capital stock, and H denotes the efficiency units of production. Both countries have the same amount of physical capital stock and use the same technology. However, the total efficiency units of labor in Rhodia is higher than that in Rubium. Which of the following is likely to be true in this case?
A) The GDP of Rhodia is higher than that of Rubium.
B) The GDP of Rubium is higher than that of Rhodia.
C) The Human Development Index of Rhodia is lower than that of Rubium.
D) The poverty rate in Rhodia is likely to be higher than that in Rubium.
A) The GDP of Rhodia is higher than that of Rubium.
B) The GDP of Rubium is higher than that of Rhodia.
C) The Human Development Index of Rhodia is lower than that of Rubium.
D) The poverty rate in Rhodia is likely to be higher than that in Rubium.
Unlock Deck
Unlock for access to all 29 flashcards in this deck.
Unlock Deck
k this deck
27
Two countries, Baltonia and Polonia, have aggregate production functions in the form Y = A × K1/3 × H2/3, where Y denotes total output, A denotes the level of technology, K denotes the physical capital stock, and H denotes the number of efficiency units of production. Both countries have the same number of efficiency units of labor and use the same technology. However, Baltonia has a smaller physical capital stock than Polonia does. Which of the following is likely to be true in this case?
A) The GDP of Baltonia is higher than that of Polonia.
B) The GDP of Baltonia is lower than that of Polonia.
C) The Human Development Index of Baltonia is higher than that of Polonia.
D) The poverty rate in Baltonia is lower than that in Polonia.
A) The GDP of Baltonia is higher than that of Polonia.
B) The GDP of Baltonia is lower than that of Polonia.
C) The Human Development Index of Baltonia is higher than that of Polonia.
D) The poverty rate in Baltonia is lower than that in Polonia.
Unlock Deck
Unlock for access to all 29 flashcards in this deck.
Unlock Deck
k this deck
28
Country X has 1,000 workers. The country?s aggregate production function is YX = 1.5 KX2/3 HX1/3, where KX = 1,000,000 and HX = 2,500,000.
-Refer to the scenario above. What was the country's GDP per capita?
A) $62,780
B) $75,000
C) $94,170
D) $37,500
-Refer to the scenario above. What was the country's GDP per capita?
A) $62,780
B) $75,000
C) $94,170
D) $37,500
Unlock Deck
Unlock for access to all 29 flashcards in this deck.
Unlock Deck
k this deck
29
Berylia?s aggregate production function is Y = A K1/3 H2/3. What is the contribution of technology to Berylia?s GDP if its GDP is $2,000,000, the physical capital stock is 125,000 units, and the total efficiency units of labor is 1,000,000?
Unlock Deck
Unlock for access to all 29 flashcards in this deck.
Unlock Deck
k this deck
Unlock Deck
Unlock for access to all 29 flashcards in this deck.


