Deck 2: Demand, Supply, and Equilibrium
Full screen (f)
Question
Question
Question
The figure below shows Sue?s and Carlos? demand curves for gasoline. It would be useful to find the equation of the demand curves to answer the questions below.
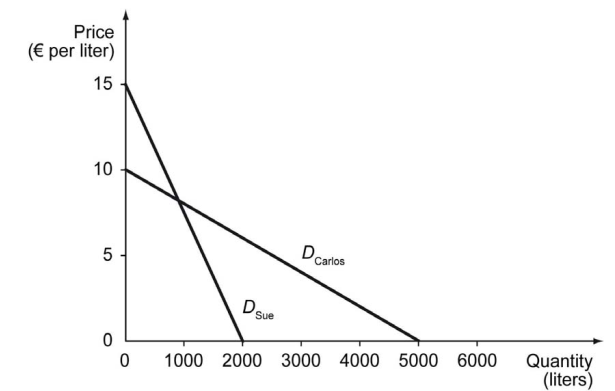
-Refer to the figure above. If the price of gasoline is 3.00 euros per liter, the total quantity of gasoline demanded is ________ liters.
A) 1,600
B) 2,400
C) 4,300
D) 5,100
-Refer to the figure above. If the price of gasoline is 3.00 euros per liter, the total quantity of gasoline demanded is ________ liters.
A) 1,600
B) 2,400
C) 4,300
D) 5,100
Question
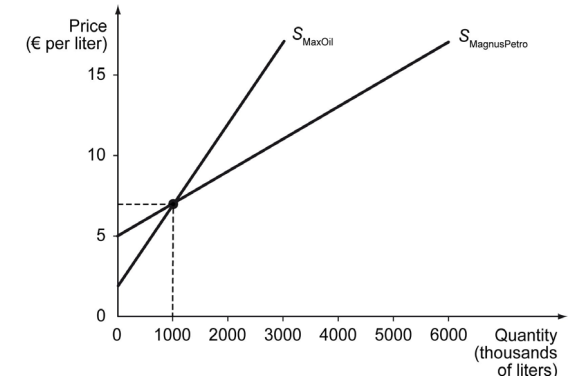
The figure below shows the supply curves for gasoline for two oil companies (MaxOil and MagnusPetro). It would be useful to find the equations of the two supply curves to answer the questions below.
-Refer to the figure above. The total demand curve has the vertical intercept at ________ and its slope changes at ________.
A) 5.00 euros; 10.00 euros
B) 5.00 euros; 7.00 euros
C) 2.00 euros; 5.00 euros
D) 2.00 euros; 7.00 euros
-Refer to the figure above. The total demand curve has the vertical intercept at ________ and its slope changes at ________.
A) 5.00 euros; 10.00 euros
B) 5.00 euros; 7.00 euros
C) 2.00 euros; 5.00 euros
D) 2.00 euros; 7.00 euros
Question
The figure below shows the supply curves for gasoline for two oil companies (MaxOil and MagnusPetro). It would be useful to find the equations of the two supply curves to answer the questions below.
-Refer to the figure above. Suppose that MaxOil, through a negotiation with the labor union representing its workforce, reduced its contribution to workers? health insurance. Meanwhile, MagnusPetro successfully negotiated to lower the price of ethanol (to be blended with its gasoline) with a supplier. How do these changes affect the supply curves?
A) Both companies supply curves and the total supply curve will shift leftward.
B) Both companies supply curves and the total supply curve will shift rightward.
C) MaxOil?s supply curve will shift leftward, MagnusPetro?s supply curve will shift rightward, and the total supply curve will shift leftward.
D) MaxOil?s supply curve will shift righttward, MagnusPetro?s supply curve will shift leftward, and the total supply curve will shift rightward.
Question
Question

Unlock Deck
Sign up to unlock the cards in this deck!
Unlock Deck
Unlock Deck
1/7
Play
Full screen (f)
Deck 2: Demand, Supply, and Equilibrium
1
Why do economists study perfectly competitive markets even though few, if any, markets in the real world are perfectly competitive?
A) Because insights we gain from studying the perfectly competitive market are directly applicable to real markets, even though they are not perfectly competitive.
B) Because the behavior of buyers and sellers can be studied theoretically only in the perfectly competitive market model.
C) Because the perfectly competitive market is a good approximation to many markets in the real world and helps us understand how real markets work.
D) Because the perfectly competitive market is the most relevant model for actual government economic policies.
Because the perfectly competitive market is a good approximation to many markets in the real world and helps us understand how real markets work.
2
Which of the following best describes the difference between a demand curve and a demand schedule?
A) A demand curve can be derived from a demand schedule, but a demand schedule cannot be derived from a demand curve.
B) A demand curve is a graphical representation of the relationship between the quantity of a good and its price, whereas a demand schedule is a tabular representation.
C) A demand curve shows the different quantities of a good demanded at different prices, whereas a demand schedule shows the different quantities of a good demanded at different incomes.
D) A demand curve shows the different quantities of a good demanded at different incomes, whereas a demand schedule shows the different quantities of a good demanded at different prices.
A demand curve is a graphical representation of the relationship between the quantity of a good and its price, whereas a demand schedule is a tabular representation.
3
The figure below shows Sue?s and Carlos? demand curves for gasoline. It would be useful to find the equation of the demand curves to answer the questions below.
-Refer to the figure above. If the price of gasoline is 3.00 euros per liter, the total quantity of gasoline demanded is ________ liters.
A) 1,600
B) 2,400
C) 4,300
D) 5,100
-Refer to the figure above. If the price of gasoline is 3.00 euros per liter, the total quantity of gasoline demanded is ________ liters.
A) 1,600
B) 2,400
C) 4,300
D) 5,100
5,100
4
The figure below shows the supply curves for gasoline for two oil companies (MaxOil and MagnusPetro). It would be useful to find the equations of the two supply curves to answer the questions below.
-Refer to the figure above. The total demand curve has the vertical intercept at ________ and its slope changes at ________.
A) 5.00 euros; 10.00 euros
B) 5.00 euros; 7.00 euros
C) 2.00 euros; 5.00 euros
D) 2.00 euros; 7.00 euros
-Refer to the figure above. The total demand curve has the vertical intercept at ________ and its slope changes at ________.
A) 5.00 euros; 10.00 euros
B) 5.00 euros; 7.00 euros
C) 2.00 euros; 5.00 euros
D) 2.00 euros; 7.00 euros
Unlock Deck
Unlock for access to all 7 flashcards in this deck.
Unlock Deck
k this deck
5
The figure below shows the supply curves for gasoline for two oil companies (MaxOil and MagnusPetro). It would be useful to find the equations of the two supply curves to answer the questions below.
-Refer to the figure above. Suppose that MaxOil, through a negotiation with the labor union representing its workforce, reduced its contribution to workers? health insurance. Meanwhile, MagnusPetro successfully negotiated to lower the price of ethanol (to be blended with its gasoline) with a supplier. How do these changes affect the supply curves?
A) Both companies supply curves and the total supply curve will shift leftward.
B) Both companies supply curves and the total supply curve will shift rightward.
C) MaxOil?s supply curve will shift leftward, MagnusPetro?s supply curve will shift rightward, and the total supply curve will shift leftward.
D) MaxOil?s supply curve will shift righttward, MagnusPetro?s supply curve will shift leftward, and the total supply curve will shift rightward.
Unlock Deck
Unlock for access to all 7 flashcards in this deck.
Unlock Deck
k this deck
6
Suppose that the government imposes a price control on gasoline where the legal price is set at $1.50 per gallon while the equilibrium price would be $2.25. A shortage ensues. Worried that you may not have enough gas to commute to school and do errands, you get up before dawn to go to a gas station to fill up the tank. But you find yourself waiting in a long line. Fortunately, the station did not run out of gas before your turn came up, and you were happy to drive away with a full tank.
-Refer to the scenario above. For the last gallon of gas that the seller is willing to produce at $1.50, the consumers are willing to pay ________.
A) more than $2.25
B) more than $1.50 but less than $2.25
C) exactly $1.50
D) less than $1.50
-Refer to the scenario above. For the last gallon of gas that the seller is willing to produce at $1.50, the consumers are willing to pay ________.
A) more than $2.25
B) more than $1.50 but less than $2.25
C) exactly $1.50
D) less than $1.50
Unlock Deck
Unlock for access to all 7 flashcards in this deck.
Unlock Deck
k this deck
7
Suppose that, when you arrive at the sale site for $50 Apple laptops (described in the text) at 1:45 A.M., you find more than 2,000 people already waiting for the site to open. You turn around and go home to get some sleep. Later you buy an Apple laptop, the same model as the $50 one, for $1,070. This indicates that________.
A) more than fifty people in the crowd were physically stronger than you
B) you are willing to pay at most $1,070 for the laptop
C) your opportunity cost of waiting at the site (and pushing and shoving) is at most $1,020
D) your opportunity cost of waiting at the site (and pushing and shoving) is at least $1,020
Unlock Deck
Unlock for access to all 7 flashcards in this deck.
Unlock Deck
k this deck
Unlock Deck
Unlock for access to all 7 flashcards in this deck.


