Deck 14: Data Analysis: Preliminary Steps
Full screen (f)
Question
Question
Question
Question
Question
Question
Question
Question
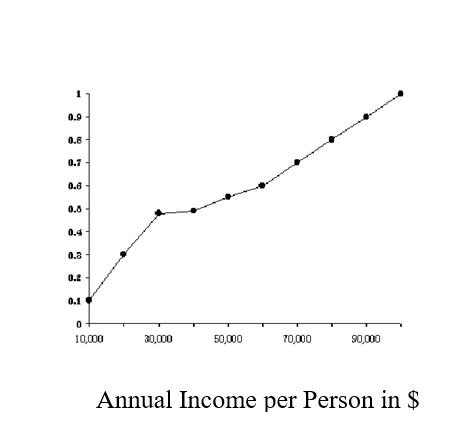
-The median income in the above figure is
A) $ 10,000.
B) $ 20,000.
C) $ 30,000.
D) $ 50,000.
E) $100,000.
Question
Question
Question
Question
Question
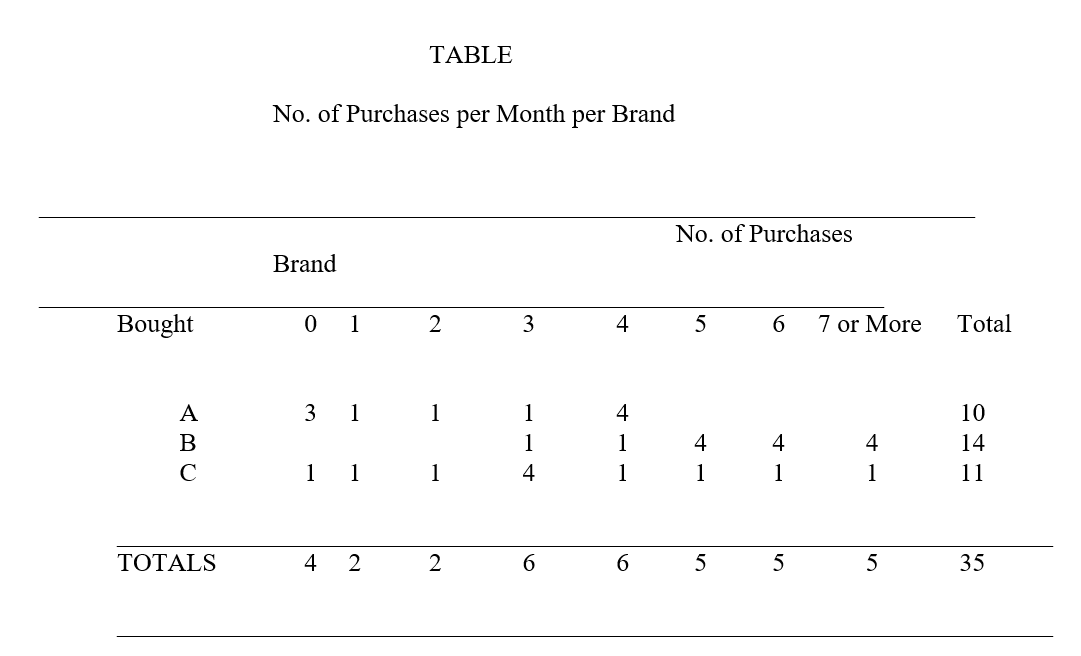
-In the above table, which numbers are referred to as the marginals?
A)10,14,11
B)35
C)3,1,1,1,4
D)3,1
E)none of the above are the marginals
Question
-The preceding table is a
A) conditional table.
B) zero order table.
C) one-way tabulation.
D) directional table.
E) computational tabulation.
Question
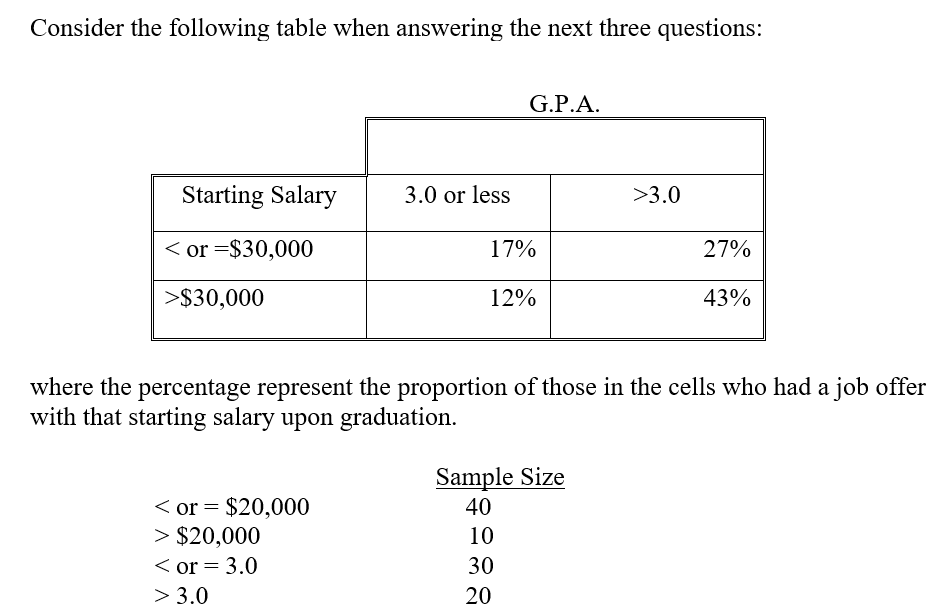
-In this table____ is (are) the control variable(s).
A) B.P.A. and starting salary
B) G.P.A., starting salary, and job after graduation.
C) job offer by graduation
D) starting salary
E) G.P.A.
Question
-By how much does having a G.P.A. of greater than 3.0 (versus a G.P.A. of less than or equal to 3.0) increase the probability of receiving a job offer by graduation?
A) .14
B) .16
C) .21
D) .41
E) None of the above are correct.
Question
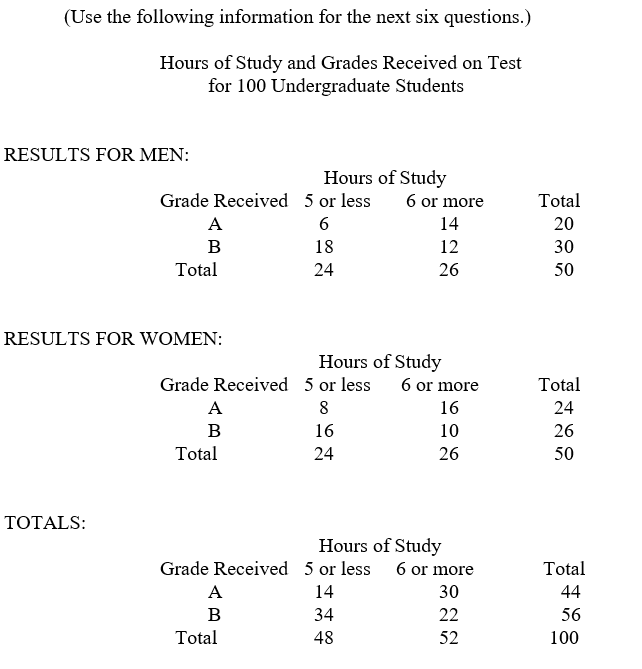
-Considering only the results for the men, if the chart were to be expressed in terms of percentages, what percentage would be associated with the 18 men who received a "B" and studied five hours or less?
A) 60%
B) 36%
C) 48%
D) 75%
E) none of the above
Question
-The "totals" chart might also be called the_____between the variables "grade received" and "hours of study."
A) One-way tabulation
B) conditional association
C) Zero-order association
D) a and c only
E) none of the above
Question
-For all individuals (men and women combined), how much does studying six or more hours impact the possibility of making an "A" over studying five hours or less?
A) 29%
B) 16%
C) 36%
D) 58%
E) none of the above
Question
-In a chart of the cross-tabulation of "sex" vs. "grade received," which of the following sets of numbers would be marginals?
A) 20, 24
B) 44, 56
C) 30, 26
D) 48, 52
E) none of the above
Question
-How much does being a woman rather than a man impact the probability of making an "A"?
A) -8%
B) 4%
C) 8%
D) cannot determine from the information given
E) none of the above
Question
-For men only, the impact of studying six hours or more on the probability of making an "A" is____, while for women this impact is___.This means that there is____between the independent variables.
A) 12%;12%;no statistical interaction
B) 29%;29%;statistical interaction
C) 12%;12%;statistical interaction
D) 29%;29%;no statistical interaction
E) none of the above
Question
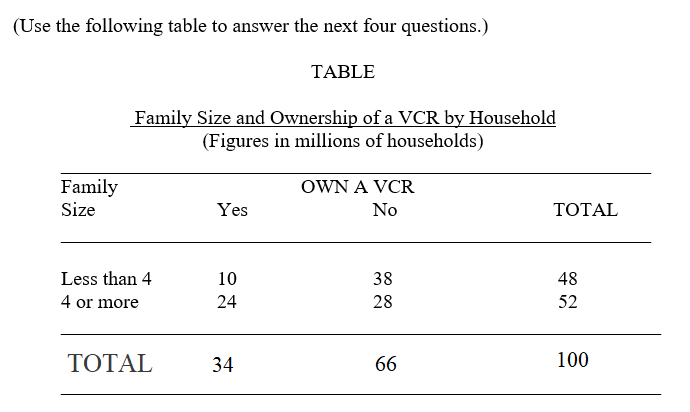
-What relationship can be inferred from the above table between family size and owning a VCR?
A) Nothing can be inferred.
B) The smaller the family the more likely they are to own a VCR.
C) A lower proportion of large families (4 or more) own VCR's than small families.
D) Owning a VCR causes the family size to increase.
E) Ownership of a VCR tends to increase as family size increases.
Question
Question
Question
Question
Question
Question
Question
Question
Question
Question
Question

Unlock Deck
Sign up to unlock the cards in this deck!
Unlock Deck
Unlock Deck
1/34
Play
Full screen (f)
Deck 14: Data Analysis: Preliminary Steps
1
When coding data for computer analysis, which of the following is NOT recommended?
A) Use only one character per record column.
B) Use alphabetic characters.
C) Assign as many columns to a variable as is necessary to capture the variable, e.g., two columns would need to be assigned to a question with 12 possible answers.
D) Use standard codes like "8" for all "no answers" and "9" for all "don't knows" throughout the study.
E) Each of these procedures is recommended.
Use alphabetic characters.
2
Which of the following uses of a one-way tabulation is NOT considered a part of "data cleaning"?
A) locating outliers
B) calculating summary statistics
C) determining the degree of item nonresponse
D) locating blunders
E) all of the above are considered data cleaning
A) locating outliers
B) calculating summary statistics
C) determining the degree of item nonresponse
D) locating blunders
E) all of the above are considered data cleaning
calculating summary statistics
3
The NUMBER of tabulations is a direct function of the
A) number of cross tabulations.
B) number of categories.
C) number of variables.
D) number of respondents in the sample.
E) a and c.
A) number of cross tabulations.
B) number of categories.
C) number of variables.
D) number of respondents in the sample.
E) a and c.
a and c.
4
(Use the following one-way tabulation to answer the next three questions.)
Value Frequency
1 12
2 15
3 8
4 7
-What is the mode of the distribution for this variable?
A) 1
B) 2
C) 3
D) 4
E) none of the above
Value Frequency
1 12
2 15
3 8
4 7
-What is the mode of the distribution for this variable?
A) 1
B) 2
C) 3
D) 4
E) none of the above
Unlock Deck
Unlock for access to all 34 flashcards in this deck.
Unlock Deck
k this deck
5
(Use the following one-way tabulation to answer the next three questions.)
Value Frequency
1 12
2 15
3 8
4 7
-What is the mean of the distribution for this variable?
A) 10.50
B) 2.00
C) 2.24
D) 2.50
E) none of the above
Value Frequency
1 12
2 15
3 8
4 7
-What is the mean of the distribution for this variable?
A) 10.50
B) 2.00
C) 2.24
D) 2.50
E) none of the above
Unlock Deck
Unlock for access to all 34 flashcards in this deck.
Unlock Deck
k this deck
6
(Use the following one-way tabulation to answer the next three questions.)
Value Frequency
1 12
2 15
3 8
4 7
-Approximately what is the standard deviation of the distribution for this variable?
A) 1.06
B) 1.11
C) 6.76
D) 3.70
E) none of the above
Value Frequency
1 12
2 15
3 8
4 7
-Approximately what is the standard deviation of the distribution for this variable?
A) 1.06
B) 1.11
C) 6.76
D) 3.70
E) none of the above
Unlock Deck
Unlock for access to all 34 flashcards in this deck.
Unlock Deck
k this deck
7
A useful device for determining whether the distribution of observed incomes is consistent with a theoretical or assumed distribution is the
A) cumulative distribution function.
B) matrix.
C) frequency polygon.
D) contingency table.
E) a and c.
A) cumulative distribution function.
B) matrix.
C) frequency polygon.
D) contingency table.
E) a and c.
Unlock Deck
Unlock for access to all 34 flashcards in this deck.
Unlock Deck
k this deck
8
-The median income in the above figure is
A) $ 10,000.
B) $ 20,000.
C) $ 30,000.
D) $ 50,000.
E) $100,000.
Unlock Deck
Unlock for access to all 34 flashcards in this deck.
Unlock Deck
k this deck
9
The use of an additional variable to refine the initial results is a basic technique of
A) longitudinal analysis.
B) coding.
C) One-way tabulation analysis.
D) Cross-sectional analysis.
E) Cross-tabulation analysis.
A) longitudinal analysis.
B) coding.
C) One-way tabulation analysis.
D) Cross-sectional analysis.
E) Cross-tabulation analysis.
Unlock Deck
Unlock for access to all 34 flashcards in this deck.
Unlock Deck
k this deck
10
Which of the following is FALSE?
A) The cross-tabulation provides information on the joint occurrence of two or more variables.
B) The cross tabulation emphasizes the division of the sample into subgroups so as to learn how the dependent variable varies from subgroup to subgroup.
C) Cross tabulation is very useful for studying relationships between variables.
D) Although a variable is part of a planned cross tabulation, it is still necessary to develop the one-way tabulation if one wishes to construct the histogram showing the distribution of the variable.
E) The conclusion regarding the relationship between two variables in a cross tabulation can change with the introduction of another variable to the analysis.
Unlock Deck
Unlock for access to all 34 flashcards in this deck.
Unlock Deck
k this deck
11
A cross-classification table with only two variables, the criterion variable and a predictor variable
A) reflects the total or zero order association between the variables.
B) is called a conditional table.
C) reflects the conditional association between the variables.
D) is called a first-order conditional table.
E) is called a second-order conditional table.
A) reflects the total or zero order association between the variables.
B) is called a conditional table.
C) reflects the conditional association between the variables.
D) is called a first-order conditional table.
E) is called a second-order conditional table.
Unlock Deck
Unlock for access to all 34 flashcards in this deck.
Unlock Deck
k this deck
12
A researcher should specify the relationships to be investigated and the appropriate cross tabulations
A)when modifying the variables.
B)before data collection.
C)after data collection.
D)during data collection.
E)after scanning some initial questionnaires.
A)when modifying the variables.
B)before data collection.
C)after data collection.
D)during data collection.
E)after scanning some initial questionnaires.
Unlock Deck
Unlock for access to all 34 flashcards in this deck.
Unlock Deck
k this deck
13
-In the above table, which numbers are referred to as the marginals?
A)10,14,11
B)35
C)3,1,1,1,4
D)3,1
E)none of the above are the marginals
Unlock Deck
Unlock for access to all 34 flashcards in this deck.
Unlock Deck
k this deck
14
-The preceding table is a
A) conditional table.
B) zero order table.
C) one-way tabulation.
D) directional table.
E) computational tabulation.
Unlock Deck
Unlock for access to all 34 flashcards in this deck.
Unlock Deck
k this deck
15
-In this table____ is (are) the control variable(s).
A) B.P.A. and starting salary
B) G.P.A., starting salary, and job after graduation.
C) job offer by graduation
D) starting salary
E) G.P.A.
Unlock Deck
Unlock for access to all 34 flashcards in this deck.
Unlock Deck
k this deck
16
-By how much does having a G.P.A. of greater than 3.0 (versus a G.P.A. of less than or equal to 3.0) increase the probability of receiving a job offer by graduation?
A) .14
B) .16
C) .21
D) .41
E) None of the above are correct.
Unlock Deck
Unlock for access to all 34 flashcards in this deck.
Unlock Deck
k this deck
17
-Considering only the results for the men, if the chart were to be expressed in terms of percentages, what percentage would be associated with the 18 men who received a "B" and studied five hours or less?
A) 60%
B) 36%
C) 48%
D) 75%
E) none of the above
Unlock Deck
Unlock for access to all 34 flashcards in this deck.
Unlock Deck
k this deck
18
-The "totals" chart might also be called the_____between the variables "grade received" and "hours of study."
A) One-way tabulation
B) conditional association
C) Zero-order association
D) a and c only
E) none of the above
Unlock Deck
Unlock for access to all 34 flashcards in this deck.
Unlock Deck
k this deck
19
-For all individuals (men and women combined), how much does studying six or more hours impact the possibility of making an "A" over studying five hours or less?
A) 29%
B) 16%
C) 36%
D) 58%
E) none of the above
Unlock Deck
Unlock for access to all 34 flashcards in this deck.
Unlock Deck
k this deck
20
-In a chart of the cross-tabulation of "sex" vs. "grade received," which of the following sets of numbers would be marginals?
A) 20, 24
B) 44, 56
C) 30, 26
D) 48, 52
E) none of the above
Unlock Deck
Unlock for access to all 34 flashcards in this deck.
Unlock Deck
k this deck
21
-How much does being a woman rather than a man impact the probability of making an "A"?
A) -8%
B) 4%
C) 8%
D) cannot determine from the information given
E) none of the above
Unlock Deck
Unlock for access to all 34 flashcards in this deck.
Unlock Deck
k this deck
22
-For men only, the impact of studying six hours or more on the probability of making an "A" is____, while for women this impact is___.This means that there is____between the independent variables.
A) 12%;12%;no statistical interaction
B) 29%;29%;statistical interaction
C) 12%;12%;statistical interaction
D) 29%;29%;no statistical interaction
E) none of the above
Unlock Deck
Unlock for access to all 34 flashcards in this deck.
Unlock Deck
k this deck
23
-What relationship can be inferred from the above table between family size and owning a VCR?
A) Nothing can be inferred.
B) The smaller the family the more likely they are to own a VCR.
C) A lower proportion of large families (4 or more) own VCR's than small families.
D) Owning a VCR causes the family size to increase.
E) Ownership of a VCR tends to increase as family size increases.
Unlock Deck
Unlock for access to all 34 flashcards in this deck.
Unlock Deck
k this deck
24
A cross-tabulation reveals a high degree of association between the wearing of swim trunks and the eating of ice cream. This is most likely an example of_____.
A) a causal relationship
B) spurious correlation
C) spurious noncorrelation
D) miscoding of data
E) none of the above
A) a causal relationship
B) spurious correlation
C) spurious noncorrelation
D) miscoding of data
E) none of the above
Unlock Deck
Unlock for access to all 34 flashcards in this deck.
Unlock Deck
k this deck
25
Spurious noncorrelation is said to occur when
A) there is no true relationship between X and Y and the researcher concludes there is.
B) the researcher concludes there is no relationship between X and Y and in fact there is.
C) there is a true relationship between X and Y and the researcher concludes this is so.
D) there is no true relationship between X and Y and the researcher concludes this is so.
E) none of the above.
Unlock Deck
Unlock for access to all 34 flashcards in this deck.
Unlock Deck
k this deck
26
The addition of a third variable to an analysis between two variables might
A) identify limiting conditions in the relationship between the original variables.
B) have no impact on the relationship between the original variables.
C) uncover spurious noncorrelation between the original variables.
D) uncover spurious correlation between the original variables.
E) do all of the above.
Unlock Deck
Unlock for access to all 34 flashcards in this deck.
Unlock Deck
k this deck
27
You are a researcher conducting a cross-tabulation on three variables: sex (male, female), region of the country (east, west, north, south), and marital status (single, married, divorced, separated). Assuming an even allocation of observations to cells, how many observations are necessary for 20 per cell?
A) 60
B) 320
C) 480
D) 640
E) none of the above
A) 60
B) 320
C) 480
D) 640
E) none of the above
Unlock Deck
Unlock for access to all 34 flashcards in this deck.
Unlock Deck
k this deck
28
There is a great temptation in cross-tabulation analysis to continue adding successive variables to the analysis. Which of the following typically act to constrain the researcher in this regard?
A) incorrect anticipation of the tabulations that will be needed, resulting in failure to collect some needed data
B) size of the sample
C) theory
D) a and b
E) a, b, and c
A) incorrect anticipation of the tabulations that will be needed, resulting in failure to collect some needed data
B) size of the sample
C) theory
D) a and b
E) a, b, and c
Unlock Deck
Unlock for access to all 34 flashcards in this deck.
Unlock Deck
k this deck
29
Which of the following is NOT an advantage of using a banner table?
A) Much information can be presented in a small amount of space.
B) The display format makes it easy for managers to read.
C) They provide a useful substitute for traditional cross-tabulation analysis.
D) Many explanatory variables can be considered in a single table.
E) All of the above are advantages of using a banner table.
Unlock Deck
Unlock for access to all 34 flashcards in this deck.
Unlock Deck
k this deck
30
Which of the following is a disadvantage to using a banner table instead of a traditional cross tabulation?
A) They may hide relationships in which it is necessary to consider several variables simultaneously.
B) They make it difficult to probe alternative explanations as to what might be producing certain results.
C) It is more difficult to detect data errors due to improper coding or editing.
D) a and c only
E) All of the above are disadvantages to using a banner table.
Unlock Deck
Unlock for access to all 34 flashcards in this deck.
Unlock Deck
k this deck
31
Which of the following kinds of data should not be analyzed using the Kolmogorov-Smirnov test?
A) sales data for various shades of paint
B) number of patients visiting a doctor each day of the week
C) sales data for three brands of blue jeans
D) sales data for four different grades of building materials
E) all of the above should be analyzed using the Kolmogorov-Smirnov test
A) sales data for various shades of paint
B) number of patients visiting a doctor each day of the week
C) sales data for three brands of blue jeans
D) sales data for four different grades of building materials
E) all of the above should be analyzed using the Kolmogorov-Smirnov test
Unlock Deck
Unlock for access to all 34 flashcards in this deck.
Unlock Deck
k this deck
32
Which of the following statements are NOT true of the Kolmogorov-Smirnov (K-S) test with respect to the chi-square goodness-of-fit test?
A) The K-S test can take advantage of the ordinal nature of data, while the chi-square test cannot.
B) In almost all cases, the K-S test is more powerful than the chi-square test.
C) The K-S test requires a certain minimum expected frequency in each cell, while the chi-square test does not.
D) The K-S test is easier to compute than the chi-square test.
E) All of the above are true of the K-S test with respect to the chi-square test.
Unlock Deck
Unlock for access to all 34 flashcards in this deck.
Unlock Deck
k this deck
33
Compared to the chi-square goodness-of -fit test, when the data are ordinal, the Kolmogorov-Smirnov test
A) is more powerful.
B) is easier to compute.
C) does not require minimum cell frequencies for computations.
D) all of the above.
E) a and b only.
A) is more powerful.
B) is easier to compute.
C) does not require minimum cell frequencies for computations.
D) all of the above.
E) a and b only.
Unlock Deck
Unlock for access to all 34 flashcards in this deck.
Unlock Deck
k this deck
34
The Kolmogorov-Smirnov test can be used to determine whether
A) two independent samples are drawn from the same population.
B) two independent samples are drawn from different populations.
C) two variables x and y are correlated.
D) variable x explains a significant amount of variation in the dependent measure, y.
E) a and b above.
A) two independent samples are drawn from the same population.
B) two independent samples are drawn from different populations.
C) two variables x and y are correlated.
D) variable x explains a significant amount of variation in the dependent measure, y.
E) a and b above.
Unlock Deck
Unlock for access to all 34 flashcards in this deck.
Unlock Deck
k this deck
Unlock Deck
Unlock for access to all 34 flashcards in this deck.


