Deck 4: Relationships Between Categorical Variables
Full screen (f)
Question
Use the following information for questions:
The table below shows the counts by gender and highest degree attained for 498 respondents in the General Social Survey.
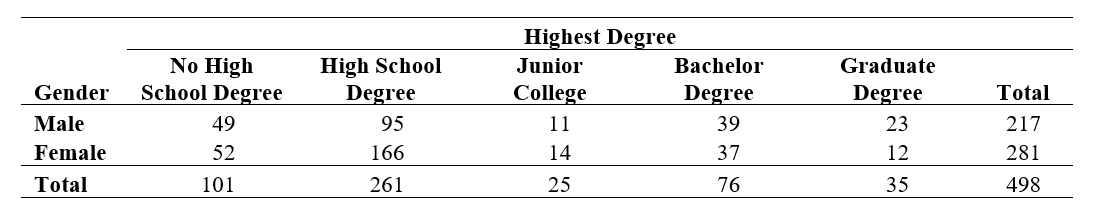
-What percent of the sample were males?
A) 43.6%
B) 48.5%
C) 56.4%
D) 77.2%
The table below shows the counts by gender and highest degree attained for 498 respondents in the General Social Survey.
-What percent of the sample were males?
A) 43.6%
B) 48.5%
C) 56.4%
D) 77.2%
Question
Use the following information for questions:
The table below shows the counts by gender and highest degree attained for 498 respondents in the General Social Survey.
-What percent of the sample were males with no high school degree?
A) 9.8%
B) 20.3%
C) 22.6%
D) 48.5%
The table below shows the counts by gender and highest degree attained for 498 respondents in the General Social Survey.
-What percent of the sample were males with no high school degree?
A) 9.8%
B) 20.3%
C) 22.6%
D) 48.5%
Question
Use the following information for questions:
The table below shows the counts by gender and highest degree attained for 498 respondents in the General Social Survey.
-What percent of the sample did not graduate from high school?
A) 18.5%
B) 20.3%
C) 22.6%
D) 52.4%
The table below shows the counts by gender and highest degree attained for 498 respondents in the General Social Survey.
-What percent of the sample did not graduate from high school?
A) 18.5%
B) 20.3%
C) 22.6%
D) 52.4%
Question
Use the following information for questions:
The table below shows the counts by gender and highest degree attained for 498 respondents in the General Social Survey.
-What percent of females had a graduate degree?
A) 2.4%
B) 4.3%
C) 7.0%
D) 56.4%
The table below shows the counts by gender and highest degree attained for 498 respondents in the General Social Survey.
-What percent of females had a graduate degree?
A) 2.4%
B) 4.3%
C) 7.0%
D) 56.4%
Question
Use the following information for questions:
The table below shows the number of Olympic medals won by the three countries with the most medals during the 2000 Olympics in Sydney, Australia. There were a total of 244 medals won by the three countries.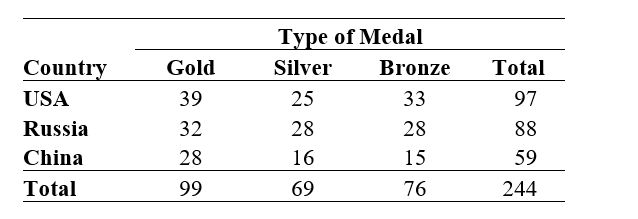
-What percent of the medals won among the three countries were won by the USA?
A) 39.4%
B) 39.8%
C) 40.2%
D) 40.6%
Question
Use the following information for questions:
The table below shows the number of Olympic medals won by the three countries with the most medals during the 2000 Olympics in Sydney, Australia. There were a total of 244 medals won by the three countries.
-What percent of the medals won among the three countries were gold?
A) 39.4%
B) 39.8%
C) 40.2%
D) 40.6%
Question
Use the following information for questions:
The table below shows the number of Olympic medals won by the three countries with the most medals during the 2000 Olympics in Sydney, Australia. There were a total of 244 medals won by the three countries.
-What percent of the medals won by the USA were gold?
A) 39.4%
B) 39.8%
C) 40.2%
D) 40.6%
The table below shows the number of Olympic medals won by the three countries with the most medals during the 2000 Olympics in Sydney, Australia. There were a total of 244 medals won by the three countries.
-What percent of the medals won by the USA were gold?
A) 39.4%
B) 39.8%
C) 40.2%
D) 40.6%
Question
Use the following information for questions:
The table below shows the number of Olympic medals won by the three countries with the most medals during the 2000 Olympics in Sydney, Australia. There were a total of 244 medals won by the three countries.
-What percent of the medals won by China were silver?
A) 6.6%
B) 24.2%
C) 27.1%
D) 28.3%
The table below shows the number of Olympic medals won by the three countries with the most medals during the 2000 Olympics in Sydney, Australia. There were a total of 244 medals won by the three countries.
-What percent of the medals won by China were silver?
A) 6.6%
B) 24.2%
C) 27.1%
D) 28.3%
Question
Use the following information for questions:
A researcher conducted a study on college students to see if there was a link between gender and how often they have cheated on an exam. She asked two questions on a survey:
(1) What is your gender? Male ___ Female ___
(2) How many times have you cheated on an exam while in college?
Never __ 1 or 2 times ___ 3 or more times ___
A two-way table of observed counts follows:
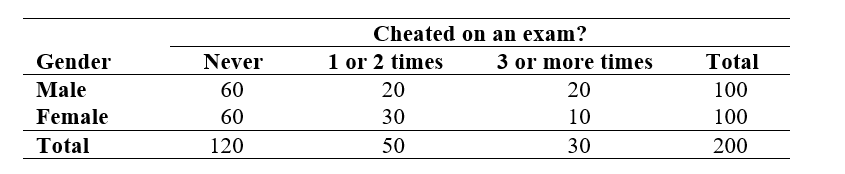
-What percent of the students in the study never cheated on an exam?
A) 60%
B) 120%
C) 50%
D) 30%
A researcher conducted a study on college students to see if there was a link between gender and how often they have cheated on an exam. She asked two questions on a survey:
(1) What is your gender? Male ___ Female ___
(2) How many times have you cheated on an exam while in college?
Never __ 1 or 2 times ___ 3 or more times ___
A two-way table of observed counts follows:
-What percent of the students in the study never cheated on an exam?
A) 60%
B) 120%
C) 50%
D) 30%
Question
Use the following information for questions:
A researcher conducted a study on college students to see if there was a link between gender and how often they have cheated on an exam. She asked two questions on a survey:
(1) What is your gender? Male ___ Female ___
(2) How many times have you cheated on an exam while in college?
Never __ 1 or 2 times ___ 3 or more times ___
A two-way table of observed counts follows:
-What percent of the students in the study cheated 1 or 2 times on an exam?
A) 20%
B) 30%
C) 50%
D) 25%
Question
Use the following information for questions:
A researcher conducted a study on college students to see if there was a link between gender and how often they have cheated on an exam. She asked two questions on a survey:
(1) What is your gender? Male ___ Female ___
(2) How many times have you cheated on an exam while in college?
Never __ 1 or 2 times ___ 3 or more times ___
A two-way table of observed counts follows:
-What percent of the students in the study cheated 3 or more times on an exam?
A) 20%
B) 10%
C) 30%
D) 15%
Question
Use the following information for questions:
A researcher conducted a study on college students to see if there was a link between gender and how often they have cheated on an exam. She asked two questions on a survey:
(1) What is your gender? Male ___ Female ___
(2) How many times have you cheated on an exam while in college?
Never __ 1 or 2 times ___ 3 or more times ___
A two-way table of observed counts follows:
-What percent of the males in the study cheated 3 or more times on an exam?
A) 20%
B) 10%
C) 30%
D) 15%
Question
Use the following information for questions:
A researcher conducted a study on college students to see if there was a link between gender and how often they have cheated on an exam. She asked two questions on a survey:
(1) What is your gender? Male ___ Female ___
(2) How many times have you cheated on an exam while in college?
Never __ 1 or 2 times ___ 3 or more times ___
A two-way table of observed counts follows:
-What percent of the females in the study cheated 3 or more times on an exam?
A) 20%
B) 10%
C) 30%
D) 15%
Question
Use the following information for questions:
The table below shows the opinions of 908 respondents in the General Social Survey to the question "Do you believe there is life after death?"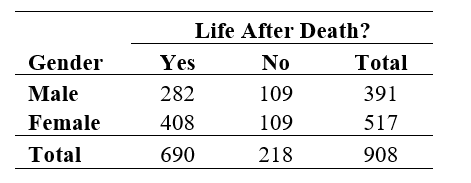
-What percent of males believe in life after death?
The table below shows the opinions of 908 respondents in the General Social Survey to the question "Do you believe there is life after death?"
-What percent of males believe in life after death?
Question
Use the following information for questions:
The table below shows the opinions of 908 respondents in the General Social Survey to the question "Do you believe there is life after death?"
-What percent of females believe in life after death?
The table below shows the opinions of 908 respondents in the General Social Survey to the question "Do you believe there is life after death?"
-What percent of females believe in life after death?
Question
Use the following information for questions:
The table below shows the opinions of 908 respondents in the General Social Survey to the question "Do you believe there is life after death?"
-What percent of respondents in the sample believe in life after death?
The table below shows the opinions of 908 respondents in the General Social Survey to the question "Do you believe there is life after death?"
-What percent of respondents in the sample believe in life after death?
Question
Use the following information for questions:
The table shows the opinions of 953 respondents in the General Social Survey to the question "If your party nominated a woman for President, would you vote for her if she were qualified for the job?"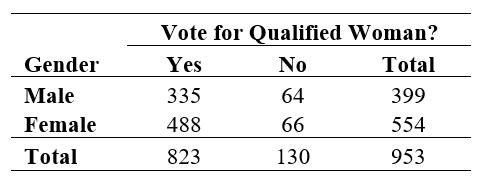
-What percent of males would vote for a woman president?
The table shows the opinions of 953 respondents in the General Social Survey to the question "If your party nominated a woman for President, would you vote for her if she were qualified for the job?"
-What percent of males would vote for a woman president?
Question
Use the following information for questions:
The table shows the opinions of 953 respondents in the General Social Survey to the question "If your party nominated a woman for President, would you vote for her if she were qualified for the job?"
-What percent of females would vote for a woman president?
The table shows the opinions of 953 respondents in the General Social Survey to the question "If your party nominated a woman for President, would you vote for her if she were qualified for the job?"
-What percent of females would vote for a woman president?
Question
Use the following information for questions:
The table shows the opinions of 953 respondents in the General Social Survey to the question "If your party nominated a woman for President, would you vote for her if she were qualified for the job?"
-What percent of respondents in the sample would vote for a woman president?
The table shows the opinions of 953 respondents in the General Social Survey to the question "If your party nominated a woman for President, would you vote for her if she were qualified for the job?"
-What percent of respondents in the sample would vote for a woman president?
Question
Use the following information for questions:
The table shows the opinions of 953 respondents in the General Social Survey to the question "If your party nominated a woman for President, would you vote for her if she were qualified for the job?"
-What percent of respondents in the sample were female?
The table shows the opinions of 953 respondents in the General Social Survey to the question "If your party nominated a woman for President, would you vote for her if she were qualified for the job?"
-What percent of respondents in the sample were female?
Question
Use the following information for questions:
In a survey of 1000 adults, respondents were asked about the expense of a college education and the relative necessity of financial assistance. The correspondents were classified as to whether they currently had a child in college or not (college status), and whether they thought the loan obligation for most college students was too high, about right, or too little (loan obligation opinion). The table below summarizes some of the survey results. Use these results to answer the following questions.
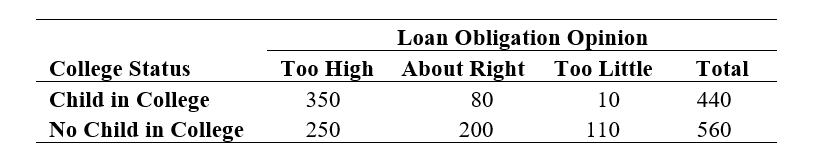
-What percent of adults with a child in college surveyed think loan obligations are too high?
In a survey of 1000 adults, respondents were asked about the expense of a college education and the relative necessity of financial assistance. The correspondents were classified as to whether they currently had a child in college or not (college status), and whether they thought the loan obligation for most college students was too high, about right, or too little (loan obligation opinion). The table below summarizes some of the survey results. Use these results to answer the following questions.
-What percent of adults with a child in college surveyed think loan obligations are too high?
Question
Use the following information for questions:
In a survey of 1000 adults, respondents were asked about the expense of a college education and the relative necessity of financial assistance. The correspondents were classified as to whether they currently had a child in college or not (college status), and whether they thought the loan obligation for most college students was too high, about right, or too little (loan obligation opinion). The table below summarizes some of the survey results. Use these results to answer the following questions.
-What percent of adults with no child in college surveyed think loan obligations are too high?
Question
Use the following information for questions:
In a survey of 1000 adults, respondents were asked about the expense of a college education and the relative necessity of financial assistance. The correspondents were classified as to whether they currently had a child in college or not (college status), and whether they thought the loan obligation for most college students was too high, about right, or too little (loan obligation opinion). The table below summarizes some of the survey results. Use these results to answer the following questions.
-What percent of all adults surveyed think loan obligations are too high?
Question
Use the following information for questions:
In a survey of 1000 adults, respondents were asked about the expense of a college education and the relative necessity of financial assistance. The correspondents were classified as to whether they currently had a child in college or not (college status), and whether they thought the loan obligation for most college students was too high, about right, or too little (loan obligation opinion). The table below summarizes some of the survey results. Use these results to answer the following questions.
-The table below shows the row percentages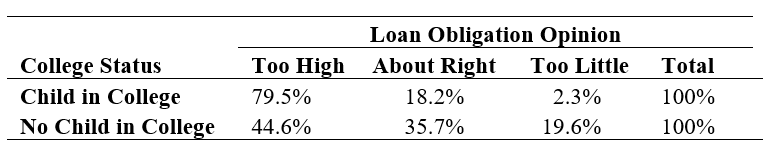 Based on these percentages, describe the relationship between loan obligation opinion and college status.
In a survey of 1000 adults, respondents were asked about the expense of a college education and the relative necessity of financial assistance. The correspondents were classified as to whether they currently had a child in college or not (college status), and whether they thought the loan obligation for most college students was too high, about right, or too little (loan obligation opinion). The table below summarizes some of the survey results. Use these results to answer the following questions.
-The table below shows the row percentages
Based on these percentages, describe the relationship between loan obligation opinion and college status. Question
Question
Question
Question
Use the following information for questions:
The table below shows the responses from a sample of 680 people in the General Social Survey to the question, "Do you sometimes drink more than you think you should?"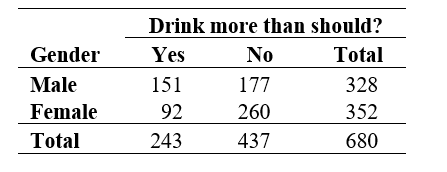
-What is the risk (or percentage) of men thinking they drank more than they should?
A) 22.2%
B) 35.7%
C) 46.0%
D) 62.1%
The table below shows the responses from a sample of 680 people in the General Social Survey to the question, "Do you sometimes drink more than you think you should?"
-What is the risk (or percentage) of men thinking they drank more than they should?
A) 22.2%
B) 35.7%
C) 46.0%
D) 62.1%
Question
Use the following information for questions:
The table below shows the responses from a sample of 680 people in the General Social Survey to the question, "Do you sometimes drink more than you think you should?"
-What is the risk (or percentage) of women thinking they drank more than they should?
A) 13.5%
B) 26.1%
C) 35.7%
D) 37.9%
The table below shows the responses from a sample of 680 people in the General Social Survey to the question, "Do you sometimes drink more than you think you should?"
-What is the risk (or percentage) of women thinking they drank more than they should?
A) 13.5%
B) 26.1%
C) 35.7%
D) 37.9%
Question
Use the following information for questions:
The table below shows the responses from a sample of 680 people in the General Social Survey to the question, "Do you sometimes drink more than you think you should?"
-What is the relative risk for women thinking they drank more than they should compared to men?
A) 0.41
B) 0.57
C) 1.76
D) 2.41
The table below shows the responses from a sample of 680 people in the General Social Survey to the question, "Do you sometimes drink more than you think you should?"
-What is the relative risk for women thinking they drank more than they should compared to men?
A) 0.41
B) 0.57
C) 1.76
D) 2.41
Question
Use the following information for questions:
The table below shows the responses from a sample of 680 people in the General Social Survey to the question, "Do you sometimes drink more than you think you should?"
-What is the odds ratio for women thinking they drank more than they should compared to men?
A) 0.41
B) 0.57
C) 1.76
D) 2.41
The table below shows the responses from a sample of 680 people in the General Social Survey to the question, "Do you sometimes drink more than you think you should?"
-What is the odds ratio for women thinking they drank more than they should compared to men?
A) 0.41
B) 0.57
C) 1.76
D) 2.41
Question
Use the following information for questions:
The table below summarizes, by gender of respondent, the responses from 1,033 people to the question, "Do you smoke?"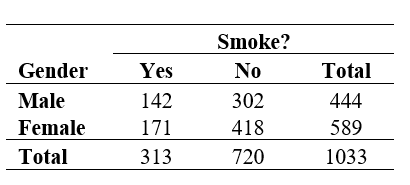
-What are the odds of smoking (to not smoking) for a man?
A) 0.14
B) 0.32
C) 0.45
D) 0.47
The table below summarizes, by gender of respondent, the responses from 1,033 people to the question, "Do you smoke?"
-What are the odds of smoking (to not smoking) for a man?
A) 0.14
B) 0.32
C) 0.45
D) 0.47
Question
Use the following information for questions:
The table below summarizes, by gender of respondent, the responses from 1,033 people to the question, "Do you smoke?"
-What are the odds of smoking (to not smoking) for a woman?
A) 0.17
B) 0.39
C) 0.41
D) 0.55
The table below summarizes, by gender of respondent, the responses from 1,033 people to the question, "Do you smoke?"
-What are the odds of smoking (to not smoking) for a woman?
A) 0.17
B) 0.39
C) 0.41
D) 0.55
Question
Use the following information for questions:
The table below summarizes, by gender of respondent, the responses from 1,033 people to the question, "Do you smoke?"
-What is the odds ratio for women smoking (to not smoking) compared to men?
A) 0.87
B) 0.91
C) 1.10
D) 1.15
The table below summarizes, by gender of respondent, the responses from 1,033 people to the question, "Do you smoke?"
-What is the odds ratio for women smoking (to not smoking) compared to men?
A) 0.87
B) 0.91
C) 1.10
D) 1.15
Question
Use the following information for questions:
The table below summarizes, by gender of respondent, the responses from 1,033 people to the question, "Do you smoke?"
-What is the odds ratio for men smoking (to not smoking) compared to women?
A) 0.87
B) 0.91
C) 1.10
D) 1.15
The table below summarizes, by gender of respondent, the responses from 1,033 people to the question, "Do you smoke?"
-What is the odds ratio for men smoking (to not smoking) compared to women?
A) 0.87
B) 0.91
C) 1.10
D) 1.15
Question
Use the following information for questions:
The table below summarizes, by gender of respondent, the responses from 1,033 people to the question, "Do you smoke?"
-What is the relative risk for women smoking compared to men smoking?
A) 0.87
B) 0.91
C) 1.10
D) 1.15
The table below summarizes, by gender of respondent, the responses from 1,033 people to the question, "Do you smoke?"
-What is the relative risk for women smoking compared to men smoking?
A) 0.87
B) 0.91
C) 1.10
D) 1.15
Question
Use the following information for questions:
The table below summarizes, by gender of respondent, the responses from 1,033 people to the question, "Do you smoke?"
-Based on the National Household Survey on Drug Abuse, the percentage of 17-year olds who ever tried cigarette smoking is 56.2%. The relative risk of ever smoking for a 17-year old versus a 12-year old is 3.6. What is the risk of smoking for a 12-year-old (i.e. what was the percentage of 12-year olds who ever tried smoking)?
A) 14.1%
B) 15.6%
C) 50.0%
D) 56.2%
Question
Use the following information for questions:
A survey asked people how often they exceed speed limits. The data are then categorized into the following contingency table of counts showing the relationship between age group and response.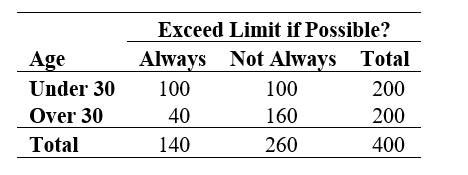
-Among people with age over 30, what's the "risk"of always exceeding the speed limit?
A) 0.20
B) 0.40
C) 0.33
D) 0.50
Question
Use the following information for questions:
A survey asked people how often they exceed speed limits. The data are then categorized into the following contingency table of counts showing the relationship between age group and response.
-Among people with age under 30 what are the odds that they always exceed the speed limit?
A) 1 to 2
B) 2 to 1
C) 1 to 1
D) 50%
Question
Use the following information for questions:
A survey asked people how often they exceed speed limits. The data are then categorized into the following contingency table of counts showing the relationship between age group and response.
-What is the relative risk of always exceeding the speed limit for people under 30 compared to people over 30?
A) 2.5
B) 0.4
C) 0.5
D) 30%
Question
Question
Question
Question
Question
Question
Question
Question
Question
Question
Use the following information for questions:
The table below shows the opinions of 908 respondents in the General Social Survey to the question "Do you believe there is life after death?"Life After Death?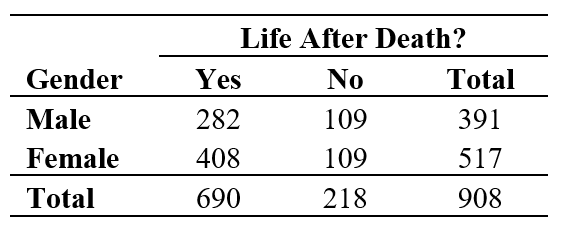
-What are the odds of believing in life after death for males?
The table below shows the opinions of 908 respondents in the General Social Survey to the question "Do you believe there is life after death?"Life After Death?
-What are the odds of believing in life after death for males?
Question
Use the following information for questions:
The table below shows the opinions of 908 respondents in the General Social Survey to the question "Do you believe there is life after death?"Life After Death?
-What are the odds of believing in life after death for females?
The table below shows the opinions of 908 respondents in the General Social Survey to the question "Do you believe there is life after death?"Life After Death?
-What are the odds of believing in life after death for females?
Question
Use the following information for questions:
The table below shows the opinions of 908 respondents in the General Social Survey to the question "Do you believe there is life after death?"Life After Death?
-What is the odds ratio for males versus females who believe in life after death?
The table below shows the opinions of 908 respondents in the General Social Survey to the question "Do you believe there is life after death?"Life After Death?
-What is the odds ratio for males versus females who believe in life after death?
Question
Question
Use the following information for questions:
The table below shows the ratings given by 200 students in an introductory statistics course. There were two instructors for the course, each with 100 students.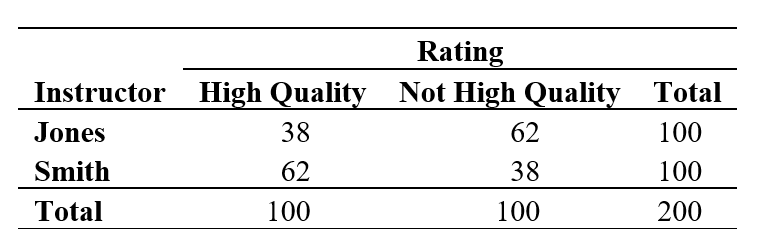
-What percent of Jones' students rated the teaching as high quality?
A) 38%
B) 62%
C) 50%
The table below shows the ratings given by 200 students in an introductory statistics course. There were two instructors for the course, each with 100 students.
-What percent of Jones' students rated the teaching as high quality?
A) 38%
B) 62%
C) 50%
Question
Use the following information for questions:
The table below shows the ratings given by 200 students in an introductory statistics course. There were two instructors for the course, each with 100 students.
-What percent of Smith's students rated the teaching as high quality?
A) 38%
B) 62%
C) 50%
The table below shows the ratings given by 200 students in an introductory statistics course. There were two instructors for the course, each with 100 students.
-What percent of Smith's students rated the teaching as high quality?
A) 38%
B) 62%
C) 50%
Question
Use the following information for questions:
The table below shows the ratings given by 200 students in an introductory statistics course. There were two instructors for the course, each with 100 students.
-Which instructor has the highest percentage of high quality teaching ratings?
A) Jones
B) Smith
C) They had the same percentages.
The table below shows the ratings given by 200 students in an introductory statistics course. There were two instructors for the course, each with 100 students.
-Which instructor has the highest percentage of high quality teaching ratings?
A) Jones
B) Smith
C) They had the same percentages.
Question
The tables below show the ratings for each instructor for these two groups of students.
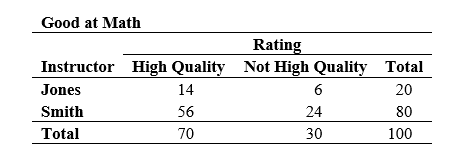
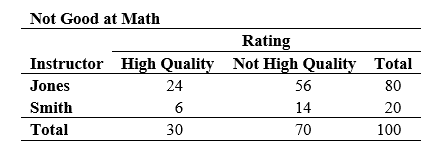
-Among those students who consider themselves good at math, which instructor has the highest percentage of high quality teaching ratings?
A) Jones
B) Smith
C) They had the same percentages.
-Among those students who consider themselves good at math, which instructor has the highest percentage of high quality teaching ratings?
A) Jones
B) Smith
C) They had the same percentages.
Question
The tables below show the ratings for each instructor for these two groups of students.
-Among those students who consider themselves good at math, which instructor has the highest percentage of high quality teaching ratings?
A) Jones
B) Smith
C) They had the same percentages.
-Among those students who consider themselves good at math, which instructor has the highest percentage of high quality teaching ratings?
A) Jones
B) Smith
C) They had the same percentages.
Question
Use the following information for questions:
The table below shows the ratings given by 200 students in an introductory statistics course. There were two instructors for the course, each with 100 students.
-Which phrases best complete this sentence? Those students who are ____________ at math generally gave higher instructor ratings and instructor __________ had a higher percentage of these type of students, giving the inaccurate impression that this instructor was best overall.
A) good, Jones
B) good, Smith
C) not good, Jones
D) not good, Smith
Question
Use the following information for questions:
The table below shows the decisions for 1200 applicants for financial aid at a local college by gender.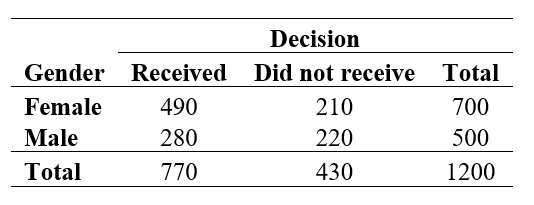
-What percent of females received some sort of financial aid?
The table below shows the decisions for 1200 applicants for financial aid at a local college by gender.
-What percent of females received some sort of financial aid?
Question
Use the following information for questions:
The table below shows the decisions for 1200 applicants for financial aid at a local college by gender.
-What percent of males received some sort of financial aid?
The table below shows the decisions for 1200 applicants for financial aid at a local college by gender.
-What percent of males received some sort of financial aid?
Question
The tables below show the financial aid results by gender for each program.
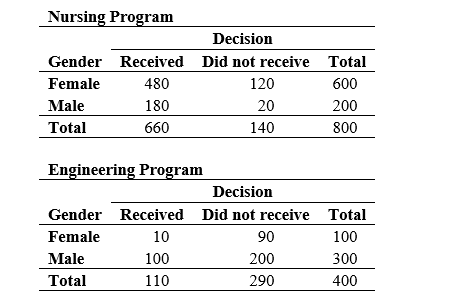
-For the nursing program, what are the percentages of females and of males that received some sort of financial aid?
-For the nursing program, what are the percentages of females and of males that received some sort of financial aid?
Question
The tables below show the financial aid results by gender for each program.
-For the engineering program, what are the percentages of females and of males that received some sort of financial aid?
-For the engineering program, what are the percentages of females and of males that received some sort of financial aid?
Question
The tables below show the financial aid results by gender for each program.
-Explain how each program can have a higher percentage of males receiving financial aid, yet overall there was a higher percentage of females receiving financial aid. Think about the differences between these two programs in terms of financial aid being given, and the distribution of gender for each program.
-Explain how each program can have a higher percentage of males receiving financial aid, yet overall there was a higher percentage of females receiving financial aid. Think about the differences between these two programs in terms of financial aid being given, and the distribution of gender for each program.
Question
Question
Use the following information for questions:
The table below shows the opinions of 321 respondents from the General Social Survey by whether they owned a gun (or not) and whether they favored (or opposed) a law requiring a permit to own a gun.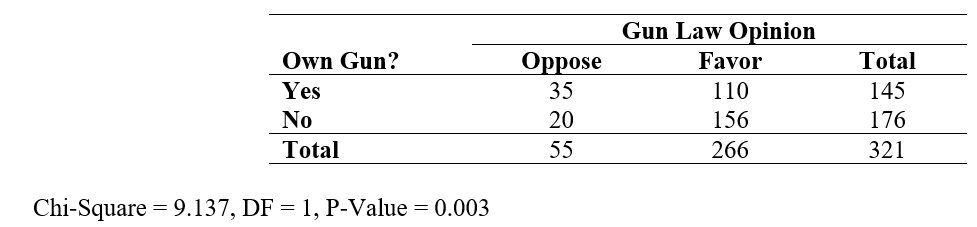
-The percentage of gun owners in favor of the gun law was
A) 34%
B) 41%
C) 76%
D) 83%
The table below shows the opinions of 321 respondents from the General Social Survey by whether they owned a gun (or not) and whether they favored (or opposed) a law requiring a permit to own a gun.
-The percentage of gun owners in favor of the gun law was
A) 34%
B) 41%
C) 76%
D) 83%
Question
Use the following information for questions:
The table below shows the opinions of 321 respondents from the General Social Survey by whether they owned a gun (or not) and whether they favored (or opposed) a law requiring a permit to own a gun.
-The percentage of non-gun owners in favor of the gun law was
A) 49%
B) 59%
C) 83%
D) 89%
The table below shows the opinions of 321 respondents from the General Social Survey by whether they owned a gun (or not) and whether they favored (or opposed) a law requiring a permit to own a gun.
-The percentage of non-gun owners in favor of the gun law was
A) 49%
B) 59%
C) 83%
D) 89%
Question
Use the following information for questions:
The table below shows the opinions of 321 respondents from the General Social Survey by whether they owned a gun (or not) and whether they favored (or opposed) a law requiring a permit to own a gun.
-Based on the chi-square statistic and p-value, one can conclude that
A) the difference between the support for the gun law between gun owners and non-gun owners is not statistically significant.
B) the difference between the support for the gun law between gun owners and non-gun owners is statistically significant.
C) the difference between the support for the gun law between gun owners and non-gun owners is not practically significant.
D) the difference between the support for the gun law between gun owners and non-gun owners is practically significant.
Question
Use the following information for questions:
A researcher conducted a study on college students to see if there was a link between gender and how often they have cheated on an exam. She asked two questions on a survey:
(1) What is your gender? Male ___ Female ___
(2) How many times have you cheated on an exam while in college?
Never __ 1 or 2 times ___ 3 or more times ___
A two-way table of observed counts follows:
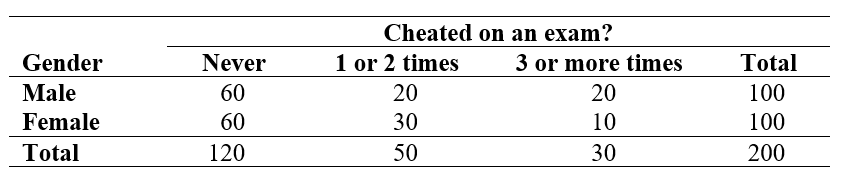 Chi-Square = 5.33, DF = 2, P-Value = 0.0696
-The percentage of males who cheated 1 or 2 times was
A) 20%
B) 30%
C) 50%
D) 25%
A researcher conducted a study on college students to see if there was a link between gender and how often they have cheated on an exam. She asked two questions on a survey:
(1) What is your gender? Male ___ Female ___
(2) How many times have you cheated on an exam while in college?
Never __ 1 or 2 times ___ 3 or more times ___
A two-way table of observed counts follows:
Chi-Square = 5.33, DF = 2, P-Value = 0.0696-The percentage of males who cheated 1 or 2 times was
A) 20%
B) 30%
C) 50%
D) 25%
Question
Use the following information for questions:
A researcher conducted a study on college students to see if there was a link between gender and how often they have cheated on an exam. She asked two questions on a survey:
(1) What is your gender? Male ___ Female ___
(2) How many times have you cheated on an exam while in college?
Never __ 1 or 2 times ___ 3 or more times ___
A two-way table of observed counts follows:
Chi-Square = 5.33, DF = 2, P-Value = 0.0696
-The percentage of females who cheated 1 or 2 times was
A) 20%
B) 30%
C) 50%
D) 25%
A researcher conducted a study on college students to see if there was a link between gender and how often they have cheated on an exam. She asked two questions on a survey:
(1) What is your gender? Male ___ Female ___
(2) How many times have you cheated on an exam while in college?
Never __ 1 or 2 times ___ 3 or more times ___
A two-way table of observed counts follows:
Chi-Square = 5.33, DF = 2, P-Value = 0.0696-The percentage of females who cheated 1 or 2 times was
A) 20%
B) 30%
C) 50%
D) 25%
Question
Use the following information for questions:
A researcher conducted a study on college students to see if there was a link between gender and how often they have cheated on an exam. She asked two questions on a survey:
(1) What is your gender? Male ___ Female ___
(2) How many times have you cheated on an exam while in college?
Never __ 1 or 2 times ___ 3 or more times ___
A two-way table of observed counts follows:
Chi-Square = 5.33, DF = 2, P-Value = 0.0696
-Based on the chi-square statistic and p-value, what conclusion can be made about the relationship between gender and response to the question about cheating, using = 0.05?
A) The result is not statistically significant so there does not appear to be a relationship.
B) The result is not statistically significant so there does appear to be a relationship.
C) The result is statistically significant so there does not appear to be relationship.
D) The result is statistically significant so there does appear to be a relationship.
A researcher conducted a study on college students to see if there was a link between gender and how often they have cheated on an exam. She asked two questions on a survey:
(1) What is your gender? Male ___ Female ___
(2) How many times have you cheated on an exam while in college?
Never __ 1 or 2 times ___ 3 or more times ___
A two-way table of observed counts follows:
Chi-Square = 5.33, DF = 2, P-Value = 0.0696-Based on the chi-square statistic and p-value, what conclusion can be made about the relationship between gender and response to the question about cheating, using = 0.05?
A) The result is not statistically significant so there does not appear to be a relationship.
B) The result is not statistically significant so there does appear to be a relationship.
C) The result is statistically significant so there does not appear to be relationship.
D) The result is statistically significant so there does appear to be a relationship.
Question
Use the following information for questions:
In the General Social Survey, respondents were asked "Would you approve of an adult male punching a stranger if the stranger was drunk and bumped into the man and his wife on the street?" A two-way table summarizing the results for 1006 respondents, by gender, is shown below: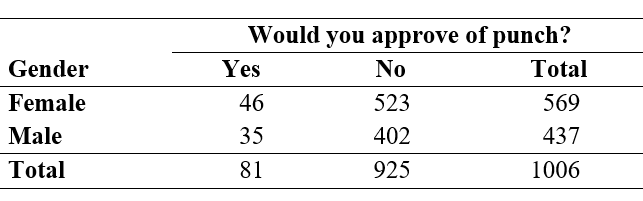 Chi-Square = 0.002, DF = 2, P-Value = 0.9990
-The percentage of males who responded 'Yes' was
A) 8.1%
B) 4.6%
C) 8.0%
D) 3.5%
In the General Social Survey, respondents were asked "Would you approve of an adult male punching a stranger if the stranger was drunk and bumped into the man and his wife on the street?" A two-way table summarizing the results for 1006 respondents, by gender, is shown below:
Chi-Square = 0.002, DF = 2, P-Value = 0.9990-The percentage of males who responded 'Yes' was
A) 8.1%
B) 4.6%
C) 8.0%
D) 3.5%
Question
Use the following information for questions:
In the General Social Survey, respondents were asked "Would you approve of an adult male punching a stranger if the stranger was drunk and bumped into the man and his wife on the street?" A two-way table summarizing the results for 1006 respondents, by gender, is shown below: Chi-Square = 0.002, DF = 2, P-Value = 0.9990
-The percentage of females who responded 'Yes' was
A) 8.1%
B) 4.6%
C) 8.0%
D) 3.5%
In the General Social Survey, respondents were asked "Would you approve of an adult male punching a stranger if the stranger was drunk and bumped into the man and his wife on the street?" A two-way table summarizing the results for 1006 respondents, by gender, is shown below:
Chi-Square = 0.002, DF = 2, P-Value = 0.9990-The percentage of females who responded 'Yes' was
A) 8.1%
B) 4.6%
C) 8.0%
D) 3.5%
Question
Use the following information for questions:
In the General Social Survey, respondents were asked "Would you approve of an adult male punching a stranger if the stranger was drunk and bumped into the man and his wife on the street?" A two-way table summarizing the results for 1006 respondents, by gender, is shown below: Chi-Square = 0.002, DF = 2, P-Value = 0.9990
-Based on the chi-square statistic and p-value, what conclusion can be made about the relationship between gender and response to the question about approving of a punch, using = 0.05?
A) The result is not statistically significant so there does not appear to be a relationship.
B) The result is not statistically significant so there does appear to be a relationship.
C) The result is statistically significant so there does not appear to be relationship.
D) The result is statistically significant so there does appear to be a relationship.
In the General Social Survey, respondents were asked "Would you approve of an adult male punching a stranger if the stranger was drunk and bumped into the man and his wife on the street?" A two-way table summarizing the results for 1006 respondents, by gender, is shown below:
Chi-Square = 0.002, DF = 2, P-Value = 0.9990-Based on the chi-square statistic and p-value, what conclusion can be made about the relationship between gender and response to the question about approving of a punch, using = 0.05?
A) The result is not statistically significant so there does not appear to be a relationship.
B) The result is not statistically significant so there does appear to be a relationship.
C) The result is statistically significant so there does not appear to be relationship.
D) The result is statistically significant so there does appear to be a relationship.
Question
Use the following information for questions:
Students in a statistics class were asked, "With whom do you find it easier to make friends: person of the same sex, person of opposite sex, or no preference?" A table summarizing the responses by gender is given below. Minitab results for a chi-square test for these data were "Chi-Sq = 7.15 DF=2 P-value = 0.028."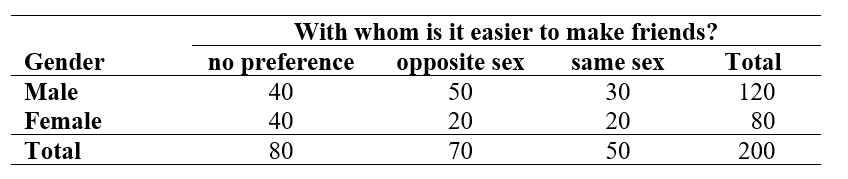
-Among females, what percent said "same sex?"
A) 15%
B) 25%
C) 30%
D) 60%
Question
Use the following information for questions:
Students in a statistics class were asked, "With whom do you find it easier to make friends: person of the same sex, person of opposite sex, or no preference?" A table summarizing the responses by gender is given below. Minitab results for a chi-square test for these data were "Chi-Sq = 7.15 DF=2 P-value = 0.028."
-Assume these students represent a random sample of all students. Based on the chi-square test, what conclusion can be made about the relationship between gender and response to the question about friends, using = 0.05?
A) The result is not statistically significant so there does not appear to be a relationship.
B) The result is not statistically significant so there does appear to be a relationship.
C) The result is statistically significant so there does not appear to be relationship.
D) The result is statistically significant so there does appear to be a relationship.
Question
Question
Question
The following two-way cross-tabulation (contingency table) of counts summarizes the relationship between gender and smoking status: 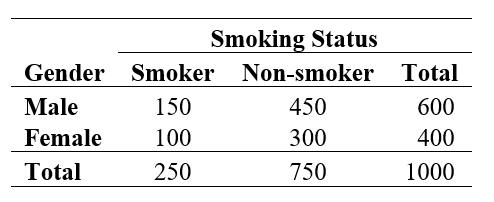 Of the males, what percentage smokes?
A) 600/1000, or 60%
B) 150/1000, or 15%.
C) 150/600, or 25%.
D) 150/250, or 60%.
Of the males, what percentage smokes?A) 600/1000, or 60%
B) 150/1000, or 15%.
C) 150/600, or 25%.
D) 150/250, or 60%.
Question

Unlock Deck
Sign up to unlock the cards in this deck!
Unlock Deck
Unlock Deck
1/100
Play
Full screen (f)
Deck 4: Relationships Between Categorical Variables
1
Use the following information for questions:
The table below shows the counts by gender and highest degree attained for 498 respondents in the General Social Survey.
-What percent of the sample were males?
A) 43.6%
B) 48.5%
C) 56.4%
D) 77.2%
The table below shows the counts by gender and highest degree attained for 498 respondents in the General Social Survey.
-What percent of the sample were males?
A) 43.6%
B) 48.5%
C) 56.4%
D) 77.2%
43.6%
2
Use the following information for questions:
The table below shows the counts by gender and highest degree attained for 498 respondents in the General Social Survey.
-What percent of the sample were males with no high school degree?
A) 9.8%
B) 20.3%
C) 22.6%
D) 48.5%
The table below shows the counts by gender and highest degree attained for 498 respondents in the General Social Survey.
-What percent of the sample were males with no high school degree?
A) 9.8%
B) 20.3%
C) 22.6%
D) 48.5%
9.8%
3
Use the following information for questions:
The table below shows the counts by gender and highest degree attained for 498 respondents in the General Social Survey.
-What percent of the sample did not graduate from high school?
A) 18.5%
B) 20.3%
C) 22.6%
D) 52.4%
The table below shows the counts by gender and highest degree attained for 498 respondents in the General Social Survey.
-What percent of the sample did not graduate from high school?
A) 18.5%
B) 20.3%
C) 22.6%
D) 52.4%
20.3%
4
Use the following information for questions:
The table below shows the counts by gender and highest degree attained for 498 respondents in the General Social Survey.
-What percent of females had a graduate degree?
A) 2.4%
B) 4.3%
C) 7.0%
D) 56.4%
The table below shows the counts by gender and highest degree attained for 498 respondents in the General Social Survey.
-What percent of females had a graduate degree?
A) 2.4%
B) 4.3%
C) 7.0%
D) 56.4%
Unlock Deck
Unlock for access to all 100 flashcards in this deck.
Unlock Deck
k this deck
5
Use the following information for questions:
The table below shows the number of Olympic medals won by the three countries with the most medals during the 2000 Olympics in Sydney, Australia. There were a total of 244 medals won by the three countries.
-What percent of the medals won among the three countries were won by the USA?
A) 39.4%
B) 39.8%
C) 40.2%
D) 40.6%
Unlock Deck
Unlock for access to all 100 flashcards in this deck.
Unlock Deck
k this deck
6
Use the following information for questions:
The table below shows the number of Olympic medals won by the three countries with the most medals during the 2000 Olympics in Sydney, Australia. There were a total of 244 medals won by the three countries.
-What percent of the medals won among the three countries were gold?
A) 39.4%
B) 39.8%
C) 40.2%
D) 40.6%
Unlock Deck
Unlock for access to all 100 flashcards in this deck.
Unlock Deck
k this deck
7
Use the following information for questions:
The table below shows the number of Olympic medals won by the three countries with the most medals during the 2000 Olympics in Sydney, Australia. There were a total of 244 medals won by the three countries.
-What percent of the medals won by the USA were gold?
A) 39.4%
B) 39.8%
C) 40.2%
D) 40.6%
The table below shows the number of Olympic medals won by the three countries with the most medals during the 2000 Olympics in Sydney, Australia. There were a total of 244 medals won by the three countries.
-What percent of the medals won by the USA were gold?
A) 39.4%
B) 39.8%
C) 40.2%
D) 40.6%
Unlock Deck
Unlock for access to all 100 flashcards in this deck.
Unlock Deck
k this deck
8
Use the following information for questions:
The table below shows the number of Olympic medals won by the three countries with the most medals during the 2000 Olympics in Sydney, Australia. There were a total of 244 medals won by the three countries.
-What percent of the medals won by China were silver?
A) 6.6%
B) 24.2%
C) 27.1%
D) 28.3%
The table below shows the number of Olympic medals won by the three countries with the most medals during the 2000 Olympics in Sydney, Australia. There were a total of 244 medals won by the three countries.
-What percent of the medals won by China were silver?
A) 6.6%
B) 24.2%
C) 27.1%
D) 28.3%
Unlock Deck
Unlock for access to all 100 flashcards in this deck.
Unlock Deck
k this deck
9
Use the following information for questions:
A researcher conducted a study on college students to see if there was a link between gender and how often they have cheated on an exam. She asked two questions on a survey:
(1) What is your gender? Male ___ Female ___
(2) How many times have you cheated on an exam while in college?
Never __ 1 or 2 times ___ 3 or more times ___
A two-way table of observed counts follows:
-What percent of the students in the study never cheated on an exam?
A) 60%
B) 120%
C) 50%
D) 30%
Unlock Deck
Unlock for access to all 100 flashcards in this deck.
Unlock Deck
k this deck
10
Use the following information for questions:
A researcher conducted a study on college students to see if there was a link between gender and how often they have cheated on an exam. She asked two questions on a survey:
(1) What is your gender? Male ___ Female ___
(2) How many times have you cheated on an exam while in college?
Never __ 1 or 2 times ___ 3 or more times ___
A two-way table of observed counts follows:
-What percent of the students in the study cheated 1 or 2 times on an exam?
A) 20%
B) 30%
C) 50%
D) 25%
Unlock Deck
Unlock for access to all 100 flashcards in this deck.
Unlock Deck
k this deck
11
Use the following information for questions:
A researcher conducted a study on college students to see if there was a link between gender and how often they have cheated on an exam. She asked two questions on a survey:
(1) What is your gender? Male ___ Female ___
(2) How many times have you cheated on an exam while in college?
Never __ 1 or 2 times ___ 3 or more times ___
A two-way table of observed counts follows:
-What percent of the students in the study cheated 3 or more times on an exam?
A) 20%
B) 10%
C) 30%
D) 15%
Unlock Deck
Unlock for access to all 100 flashcards in this deck.
Unlock Deck
k this deck
12
Use the following information for questions:
A researcher conducted a study on college students to see if there was a link between gender and how often they have cheated on an exam. She asked two questions on a survey:
(1) What is your gender? Male ___ Female ___
(2) How many times have you cheated on an exam while in college?
Never __ 1 or 2 times ___ 3 or more times ___
A two-way table of observed counts follows:
-What percent of the males in the study cheated 3 or more times on an exam?
A) 20%
B) 10%
C) 30%
D) 15%
Unlock Deck
Unlock for access to all 100 flashcards in this deck.
Unlock Deck
k this deck
13
Use the following information for questions:
A researcher conducted a study on college students to see if there was a link between gender and how often they have cheated on an exam. She asked two questions on a survey:
(1) What is your gender? Male ___ Female ___
(2) How many times have you cheated on an exam while in college?
Never __ 1 or 2 times ___ 3 or more times ___
A two-way table of observed counts follows:
-What percent of the females in the study cheated 3 or more times on an exam?
A) 20%
B) 10%
C) 30%
D) 15%
Unlock Deck
Unlock for access to all 100 flashcards in this deck.
Unlock Deck
k this deck
14
Use the following information for questions:
The table below shows the opinions of 908 respondents in the General Social Survey to the question "Do you believe there is life after death?"
-What percent of males believe in life after death?
The table below shows the opinions of 908 respondents in the General Social Survey to the question "Do you believe there is life after death?"
-What percent of males believe in life after death?
Unlock Deck
Unlock for access to all 100 flashcards in this deck.
Unlock Deck
k this deck
15
Use the following information for questions:
The table below shows the opinions of 908 respondents in the General Social Survey to the question "Do you believe there is life after death?"
-What percent of females believe in life after death?
The table below shows the opinions of 908 respondents in the General Social Survey to the question "Do you believe there is life after death?"
-What percent of females believe in life after death?
Unlock Deck
Unlock for access to all 100 flashcards in this deck.
Unlock Deck
k this deck
16
Use the following information for questions:
The table below shows the opinions of 908 respondents in the General Social Survey to the question "Do you believe there is life after death?"
-What percent of respondents in the sample believe in life after death?
The table below shows the opinions of 908 respondents in the General Social Survey to the question "Do you believe there is life after death?"
-What percent of respondents in the sample believe in life after death?
Unlock Deck
Unlock for access to all 100 flashcards in this deck.
Unlock Deck
k this deck
17
Use the following information for questions:
The table shows the opinions of 953 respondents in the General Social Survey to the question "If your party nominated a woman for President, would you vote for her if she were qualified for the job?"
-What percent of males would vote for a woman president?
The table shows the opinions of 953 respondents in the General Social Survey to the question "If your party nominated a woman for President, would you vote for her if she were qualified for the job?"
-What percent of males would vote for a woman president?
Unlock Deck
Unlock for access to all 100 flashcards in this deck.
Unlock Deck
k this deck
18
Use the following information for questions:
The table shows the opinions of 953 respondents in the General Social Survey to the question "If your party nominated a woman for President, would you vote for her if she were qualified for the job?"
-What percent of females would vote for a woman president?
The table shows the opinions of 953 respondents in the General Social Survey to the question "If your party nominated a woman for President, would you vote for her if she were qualified for the job?"
-What percent of females would vote for a woman president?
Unlock Deck
Unlock for access to all 100 flashcards in this deck.
Unlock Deck
k this deck
19
Use the following information for questions:
The table shows the opinions of 953 respondents in the General Social Survey to the question "If your party nominated a woman for President, would you vote for her if she were qualified for the job?"
-What percent of respondents in the sample would vote for a woman president?
The table shows the opinions of 953 respondents in the General Social Survey to the question "If your party nominated a woman for President, would you vote for her if she were qualified for the job?"
-What percent of respondents in the sample would vote for a woman president?
Unlock Deck
Unlock for access to all 100 flashcards in this deck.
Unlock Deck
k this deck
20
Use the following information for questions:
The table shows the opinions of 953 respondents in the General Social Survey to the question "If your party nominated a woman for President, would you vote for her if she were qualified for the job?"
-What percent of respondents in the sample were female?
The table shows the opinions of 953 respondents in the General Social Survey to the question "If your party nominated a woman for President, would you vote for her if she were qualified for the job?"
-What percent of respondents in the sample were female?
Unlock Deck
Unlock for access to all 100 flashcards in this deck.
Unlock Deck
k this deck
21
Use the following information for questions:
In a survey of 1000 adults, respondents were asked about the expense of a college education and the relative necessity of financial assistance. The correspondents were classified as to whether they currently had a child in college or not (college status), and whether they thought the loan obligation for most college students was too high, about right, or too little (loan obligation opinion). The table below summarizes some of the survey results. Use these results to answer the following questions.
-What percent of adults with a child in college surveyed think loan obligations are too high?
Unlock Deck
Unlock for access to all 100 flashcards in this deck.
Unlock Deck
k this deck
22
Use the following information for questions:
In a survey of 1000 adults, respondents were asked about the expense of a college education and the relative necessity of financial assistance. The correspondents were classified as to whether they currently had a child in college or not (college status), and whether they thought the loan obligation for most college students was too high, about right, or too little (loan obligation opinion). The table below summarizes some of the survey results. Use these results to answer the following questions.
-What percent of adults with no child in college surveyed think loan obligations are too high?
Unlock Deck
Unlock for access to all 100 flashcards in this deck.
Unlock Deck
k this deck
23
Use the following information for questions:
In a survey of 1000 adults, respondents were asked about the expense of a college education and the relative necessity of financial assistance. The correspondents were classified as to whether they currently had a child in college or not (college status), and whether they thought the loan obligation for most college students was too high, about right, or too little (loan obligation opinion). The table below summarizes some of the survey results. Use these results to answer the following questions.
-What percent of all adults surveyed think loan obligations are too high?
Unlock Deck
Unlock for access to all 100 flashcards in this deck.
Unlock Deck
k this deck
24
Use the following information for questions:
In a survey of 1000 adults, respondents were asked about the expense of a college education and the relative necessity of financial assistance. The correspondents were classified as to whether they currently had a child in college or not (college status), and whether they thought the loan obligation for most college students was too high, about right, or too little (loan obligation opinion). The table below summarizes some of the survey results. Use these results to answer the following questions.
-The table below shows the row percentages Based on these percentages, describe the relationship between loan obligation opinion and college status.
In a survey of 1000 adults, respondents were asked about the expense of a college education and the relative necessity of financial assistance. The correspondents were classified as to whether they currently had a child in college or not (college status), and whether they thought the loan obligation for most college students was too high, about right, or too little (loan obligation opinion). The table below summarizes some of the survey results. Use these results to answer the following questions.
-The table below shows the row percentages
Based on these percentages, describe the relationship between loan obligation opinion and college status. Unlock Deck
Unlock for access to all 100 flashcards in this deck.
Unlock Deck
k this deck
25
If there is no difference in the risk of a disease for smokers and non-smokers, then the relative risk of the disease for smokers compared to non-smokers would be:
A) 0
B) 0.5
C) 1
D) It depends on the actual risks.
A) 0
B) 0.5
C) 1
D) It depends on the actual risks.
Unlock Deck
Unlock for access to all 100 flashcards in this deck.
Unlock Deck
k this deck
26
The relative risk of a disease for group 1 compared to group 2 is close to the odds ratio under which of these circumstances?
A) When the numbers with the disease in each group are small compared to the total in each group.
B) When the numbers with the disease are about equal to the numbers without the disease in each group.
C) When the numbers with the disease in each group are almost equal to the total in each group.
D) The relative risk and the odds ratio are never close to each other.
Unlock Deck
Unlock for access to all 100 flashcards in this deck.
Unlock Deck
k this deck
27
If the relative risk of having an accident while eating when driving (compared to not eating) is 5, and the risk of having an accident when not eating is 1 in 10000, then the risk of having an accident while eating is:
A) 1 in 5000
B) 1 in 50000
C) 1 in 2000
D) None of the above.
A) 1 in 5000
B) 1 in 50000
C) 1 in 2000
D) None of the above.
Unlock Deck
Unlock for access to all 100 flashcards in this deck.
Unlock Deck
k this deck
28
Use the following information for questions:
The table below shows the responses from a sample of 680 people in the General Social Survey to the question, "Do you sometimes drink more than you think you should?"
-What is the risk (or percentage) of men thinking they drank more than they should?
A) 22.2%
B) 35.7%
C) 46.0%
D) 62.1%
The table below shows the responses from a sample of 680 people in the General Social Survey to the question, "Do you sometimes drink more than you think you should?"
-What is the risk (or percentage) of men thinking they drank more than they should?
A) 22.2%
B) 35.7%
C) 46.0%
D) 62.1%
Unlock Deck
Unlock for access to all 100 flashcards in this deck.
Unlock Deck
k this deck
29
Use the following information for questions:
The table below shows the responses from a sample of 680 people in the General Social Survey to the question, "Do you sometimes drink more than you think you should?"
-What is the risk (or percentage) of women thinking they drank more than they should?
A) 13.5%
B) 26.1%
C) 35.7%
D) 37.9%
The table below shows the responses from a sample of 680 people in the General Social Survey to the question, "Do you sometimes drink more than you think you should?"
-What is the risk (or percentage) of women thinking they drank more than they should?
A) 13.5%
B) 26.1%
C) 35.7%
D) 37.9%
Unlock Deck
Unlock for access to all 100 flashcards in this deck.
Unlock Deck
k this deck
30
Use the following information for questions:
The table below shows the responses from a sample of 680 people in the General Social Survey to the question, "Do you sometimes drink more than you think you should?"
-What is the relative risk for women thinking they drank more than they should compared to men?
A) 0.41
B) 0.57
C) 1.76
D) 2.41
The table below shows the responses from a sample of 680 people in the General Social Survey to the question, "Do you sometimes drink more than you think you should?"
-What is the relative risk for women thinking they drank more than they should compared to men?
A) 0.41
B) 0.57
C) 1.76
D) 2.41
Unlock Deck
Unlock for access to all 100 flashcards in this deck.
Unlock Deck
k this deck
31
Use the following information for questions:
The table below shows the responses from a sample of 680 people in the General Social Survey to the question, "Do you sometimes drink more than you think you should?"
-What is the odds ratio for women thinking they drank more than they should compared to men?
A) 0.41
B) 0.57
C) 1.76
D) 2.41
The table below shows the responses from a sample of 680 people in the General Social Survey to the question, "Do you sometimes drink more than you think you should?"
-What is the odds ratio for women thinking they drank more than they should compared to men?
A) 0.41
B) 0.57
C) 1.76
D) 2.41
Unlock Deck
Unlock for access to all 100 flashcards in this deck.
Unlock Deck
k this deck
32
Use the following information for questions:
The table below summarizes, by gender of respondent, the responses from 1,033 people to the question, "Do you smoke?"
-What are the odds of smoking (to not smoking) for a man?
A) 0.14
B) 0.32
C) 0.45
D) 0.47
The table below summarizes, by gender of respondent, the responses from 1,033 people to the question, "Do you smoke?"
-What are the odds of smoking (to not smoking) for a man?
A) 0.14
B) 0.32
C) 0.45
D) 0.47
Unlock Deck
Unlock for access to all 100 flashcards in this deck.
Unlock Deck
k this deck
33
Use the following information for questions:
The table below summarizes, by gender of respondent, the responses from 1,033 people to the question, "Do you smoke?"
-What are the odds of smoking (to not smoking) for a woman?
A) 0.17
B) 0.39
C) 0.41
D) 0.55
The table below summarizes, by gender of respondent, the responses from 1,033 people to the question, "Do you smoke?"
-What are the odds of smoking (to not smoking) for a woman?
A) 0.17
B) 0.39
C) 0.41
D) 0.55
Unlock Deck
Unlock for access to all 100 flashcards in this deck.
Unlock Deck
k this deck
34
Use the following information for questions:
The table below summarizes, by gender of respondent, the responses from 1,033 people to the question, "Do you smoke?"
-What is the odds ratio for women smoking (to not smoking) compared to men?
A) 0.87
B) 0.91
C) 1.10
D) 1.15
The table below summarizes, by gender of respondent, the responses from 1,033 people to the question, "Do you smoke?"
-What is the odds ratio for women smoking (to not smoking) compared to men?
A) 0.87
B) 0.91
C) 1.10
D) 1.15
Unlock Deck
Unlock for access to all 100 flashcards in this deck.
Unlock Deck
k this deck
35
Use the following information for questions:
The table below summarizes, by gender of respondent, the responses from 1,033 people to the question, "Do you smoke?"
-What is the odds ratio for men smoking (to not smoking) compared to women?
A) 0.87
B) 0.91
C) 1.10
D) 1.15
The table below summarizes, by gender of respondent, the responses from 1,033 people to the question, "Do you smoke?"
-What is the odds ratio for men smoking (to not smoking) compared to women?
A) 0.87
B) 0.91
C) 1.10
D) 1.15
Unlock Deck
Unlock for access to all 100 flashcards in this deck.
Unlock Deck
k this deck
36
Use the following information for questions:
The table below summarizes, by gender of respondent, the responses from 1,033 people to the question, "Do you smoke?"
-What is the relative risk for women smoking compared to men smoking?
A) 0.87
B) 0.91
C) 1.10
D) 1.15
The table below summarizes, by gender of respondent, the responses from 1,033 people to the question, "Do you smoke?"
-What is the relative risk for women smoking compared to men smoking?
A) 0.87
B) 0.91
C) 1.10
D) 1.15
Unlock Deck
Unlock for access to all 100 flashcards in this deck.
Unlock Deck
k this deck
37
Use the following information for questions:
The table below summarizes, by gender of respondent, the responses from 1,033 people to the question, "Do you smoke?"
-Based on the National Household Survey on Drug Abuse, the percentage of 17-year olds who ever tried cigarette smoking is 56.2%. The relative risk of ever smoking for a 17-year old versus a 12-year old is 3.6. What is the risk of smoking for a 12-year-old (i.e. what was the percentage of 12-year olds who ever tried smoking)?
A) 14.1%
B) 15.6%
C) 50.0%
D) 56.2%
Unlock Deck
Unlock for access to all 100 flashcards in this deck.
Unlock Deck
k this deck
38
Use the following information for questions:
A survey asked people how often they exceed speed limits. The data are then categorized into the following contingency table of counts showing the relationship between age group and response.
-Among people with age over 30, what's the "risk"of always exceeding the speed limit?
A) 0.20
B) 0.40
C) 0.33
D) 0.50
Unlock Deck
Unlock for access to all 100 flashcards in this deck.
Unlock Deck
k this deck
39
Use the following information for questions:
A survey asked people how often they exceed speed limits. The data are then categorized into the following contingency table of counts showing the relationship between age group and response.
-Among people with age under 30 what are the odds that they always exceed the speed limit?
A) 1 to 2
B) 2 to 1
C) 1 to 1
D) 50%
Unlock Deck
Unlock for access to all 100 flashcards in this deck.
Unlock Deck
k this deck
40
Use the following information for questions:
A survey asked people how often they exceed speed limits. The data are then categorized into the following contingency table of counts showing the relationship between age group and response.
-What is the relative risk of always exceeding the speed limit for people under 30 compared to people over 30?
A) 2.5
B) 0.4
C) 0.5
D) 30%
Unlock Deck
Unlock for access to all 100 flashcards in this deck.
Unlock Deck
k this deck
41
Use the following information for questions:
A newspaper article reported that "Children who routinely compete in vigorous after-school sports on smoggy days are three times more likely to get asthma than their non-athletic peers."(Sacramento Bee, Feb 1, 2002, p. A1)
-Of the following, which is the most important additional information that would be useful before making a decision about participation in school sports?
A) Where was the study conducted?
B) How many students in the study participated in after-school sports?
C) What is the baseline risk for getting asthma?
D) Who funded the study?
Unlock Deck
Unlock for access to all 100 flashcards in this deck.
Unlock Deck
k this deck
42
Use the following information for questions:
A newspaper article reported that "Children who routinely compete in vigorous after-school sports on smoggy days are three times more likely to get asthma than their non-athletic peers."(Sacramento Bee, Feb 1, 2002, p. A1)
-The newspaper also reported that "The number of children in the study who contracted asthma was relatively small - 265 of 3,535."From this information and the information given in the original quote, which of the following could not be computed?
A) The baseline risk of getting asthma without participating in after-school sports.
B) The overall risk of getting asthma for the children in this study.
C) The relative risk of getting asthma for children who routinely participate in vigorous after-school sports on smoggy days and their non-athletic peers.
D) All of the above could be computed.
Unlock Deck
Unlock for access to all 100 flashcards in this deck.
Unlock Deck
k this deck
43
Use the following information for questions:
A study done by the Center for Academic Integrity at Rutgers University surveyed 2116 students at 21 colleges and universities. Some of the schools had an "honor code"and others did not. Of the students at schools with an honor code, 7% reported having plagiarized a paper via the Internet, while at schools with no honor code, 13% did so. (Sacramento Bee, Feb 29, 2000, D1.)
-For this study, the relative risk of a student having plagiarized a paper via the Internet at a school with no honor code, compared to a school with an honor code is:
A) 13/7 = 1.857
B) 7/13 = 0.538
C) 13/87 = 0.149
D) 87/13 = 6.692
Unlock Deck
Unlock for access to all 100 flashcards in this deck.
Unlock Deck
k this deck
44
Use the following information for questions:
A study done by the Center for Academic Integrity at Rutgers University surveyed 2116 students at 21 colleges and universities. Some of the schools had an "honor code"and others did not. Of the students at schools with an honor code, 7% reported having plagiarized a paper via the Internet, while at schools with no honor code, 13% did so. (Sacramento Bee, Feb 29, 2000, D1.)
-Which of the following statements about percent increase in risk is correct for this study?
A) There is a 185.7% increase in the risk of plagiarism at a school with no honor code, compared to a school with an honor code.
B) There is an 85.7% increase in the risk of plagiarism at a school with no honor code, compared to a school with an honor code.
C) There is a 53.8% increase in the risk of plagiarism at a school with no honor code, compared to a school with an honor code.
D) There is a 6% increase in the risk of plagiarism at a school with no honor code, compared to a school with an honor code.
Unlock Deck
Unlock for access to all 100 flashcards in this deck.
Unlock Deck
k this deck
45
A study on the use of seat belts versus belted booster seats for children ages 4 and 5 reported that "Using seat belts instead of booster seats was associated with increased risk for serious injury in an accident; the relative risk was 2.4."Based on this, it can be concluded that for this study:
A) Children ages 4 and 5 in a booster seat were 2.4 times more likely to have serious injuries in an accident than were children wearing seatbelts.
B) Children ages 4 and 5 wearing seatbelts were 2.4 times more likely to have serious injuries in an accident than were children in a booster seat.
C) The percent of children ages 4 and 5 in a booster seat was 2.4 times higher than the percent of children wearing seatbelts.
D) The percent of children ages 4 and 5 wearing seatbelts was 2.4 times higher than the percent of children in a booster seat.
Unlock Deck
Unlock for access to all 100 flashcards in this deck.
Unlock Deck
k this deck
46
The relative risk of allergies for children of parents who smoke compared to children of parents who don't smoke is 3.0. Suppose that the risk of allergies for the children of non-smokers is 0.15 (15%). What is the risk of allergies for the children of smokers?
A) 3%
B) 5%
C) 30%
D) 45%
A) 3%
B) 5%
C) 30%
D) 45%
Unlock Deck
Unlock for access to all 100 flashcards in this deck.
Unlock Deck
k this deck
47
An article in the Sacramento Bee (May 8, 2000, p A12) reported that "Early results from a study of more than 2000 pregnant women in Alabama show that pregnant mothers with severe gum disease are up to eight times more likely to have underweight premature babies than moms with healthy mouths."The phrase "eight times more likely"indicates what in our statistical language?
Unlock Deck
Unlock for access to all 100 flashcards in this deck.
Unlock Deck
k this deck
48
A 1995 Washington Post-ABC News Poll on Affirmative Action reported that 76 percent of men and 69 percent of women opposed giving preferences to women in hiring, promotions and college admissions. What are the odds that a woman was opposed to giving preferences versus not opposed?
Unlock Deck
Unlock for access to all 100 flashcards in this deck.
Unlock Deck
k this deck
49
The relative risk of a 25-year-old woman developing invasive breast cancer within 5 years is 5.72 times greater than for a 20-year-old woman. If the 5-year risk of breast cancer for a 20 year old woman is 0.007%, what is the risk for a 25 year old woman?
Unlock Deck
Unlock for access to all 100 flashcards in this deck.
Unlock Deck
k this deck
50
Use the following information for questions:
The table below shows the opinions of 908 respondents in the General Social Survey to the question "Do you believe there is life after death?"Life After Death?
-What are the odds of believing in life after death for males?
The table below shows the opinions of 908 respondents in the General Social Survey to the question "Do you believe there is life after death?"Life After Death?
-What are the odds of believing in life after death for males?
Unlock Deck
Unlock for access to all 100 flashcards in this deck.
Unlock Deck
k this deck
51
Use the following information for questions:
The table below shows the opinions of 908 respondents in the General Social Survey to the question "Do you believe there is life after death?"Life After Death?
-What are the odds of believing in life after death for females?
The table below shows the opinions of 908 respondents in the General Social Survey to the question "Do you believe there is life after death?"Life After Death?
-What are the odds of believing in life after death for females?
Unlock Deck
Unlock for access to all 100 flashcards in this deck.
Unlock Deck
k this deck
52
Use the following information for questions:
The table below shows the opinions of 908 respondents in the General Social Survey to the question "Do you believe there is life after death?"Life After Death?
-What is the odds ratio for males versus females who believe in life after death?
The table below shows the opinions of 908 respondents in the General Social Survey to the question "Do you believe there is life after death?"Life After Death?
-What is the odds ratio for males versus females who believe in life after death?
Unlock Deck
Unlock for access to all 100 flashcards in this deck.
Unlock Deck
k this deck
53
Simpson's Paradox occurs when
A) no baseline risk is given, so it is not know whether or not a high relative risk has practical importance.
B) a confounding variable rather than the explanatory variable is responsible for a change in the response variable.
C) the direction of the relationship between two variables changes when the categories of a confounding variable are taken into account.
D) the results of a test are statistically significant but are really due to chance.
Unlock Deck
Unlock for access to all 100 flashcards in this deck.
Unlock Deck
k this deck
54
Use the following information for questions:
The table below shows the ratings given by 200 students in an introductory statistics course. There were two instructors for the course, each with 100 students.
-What percent of Jones' students rated the teaching as high quality?
A) 38%
B) 62%
C) 50%
The table below shows the ratings given by 200 students in an introductory statistics course. There were two instructors for the course, each with 100 students.
-What percent of Jones' students rated the teaching as high quality?
A) 38%
B) 62%
C) 50%
Unlock Deck
Unlock for access to all 100 flashcards in this deck.
Unlock Deck
k this deck
55
Use the following information for questions:
The table below shows the ratings given by 200 students in an introductory statistics course. There were two instructors for the course, each with 100 students.
-What percent of Smith's students rated the teaching as high quality?
A) 38%
B) 62%
C) 50%
The table below shows the ratings given by 200 students in an introductory statistics course. There were two instructors for the course, each with 100 students.
-What percent of Smith's students rated the teaching as high quality?
A) 38%
B) 62%
C) 50%
Unlock Deck
Unlock for access to all 100 flashcards in this deck.
Unlock Deck
k this deck
56
Use the following information for questions:
The table below shows the ratings given by 200 students in an introductory statistics course. There were two instructors for the course, each with 100 students.
-Which instructor has the highest percentage of high quality teaching ratings?
A) Jones
B) Smith
C) They had the same percentages.
The table below shows the ratings given by 200 students in an introductory statistics course. There were two instructors for the course, each with 100 students.
-Which instructor has the highest percentage of high quality teaching ratings?
A) Jones
B) Smith
C) They had the same percentages.
Unlock Deck
Unlock for access to all 100 flashcards in this deck.
Unlock Deck
k this deck
57
The tables below show the ratings for each instructor for these two groups of students.
-Among those students who consider themselves good at math, which instructor has the highest percentage of high quality teaching ratings?
A) Jones
B) Smith
C) They had the same percentages.
-Among those students who consider themselves good at math, which instructor has the highest percentage of high quality teaching ratings?
A) Jones
B) Smith
C) They had the same percentages.
Unlock Deck
Unlock for access to all 100 flashcards in this deck.
Unlock Deck
k this deck
58
The tables below show the ratings for each instructor for these two groups of students.
-Among those students who consider themselves good at math, which instructor has the highest percentage of high quality teaching ratings?
A) Jones
B) Smith
C) They had the same percentages.
-Among those students who consider themselves good at math, which instructor has the highest percentage of high quality teaching ratings?
A) Jones
B) Smith
C) They had the same percentages.
Unlock Deck
Unlock for access to all 100 flashcards in this deck.
Unlock Deck
k this deck
59
Use the following information for questions:
The table below shows the ratings given by 200 students in an introductory statistics course. There were two instructors for the course, each with 100 students.
-Which phrases best complete this sentence? Those students who are ____________ at math generally gave higher instructor ratings and instructor __________ had a higher percentage of these type of students, giving the inaccurate impression that this instructor was best overall.
A) good, Jones
B) good, Smith
C) not good, Jones
D) not good, Smith
Unlock Deck
Unlock for access to all 100 flashcards in this deck.
Unlock Deck
k this deck
60
Use the following information for questions:
The table below shows the decisions for 1200 applicants for financial aid at a local college by gender.
-What percent of females received some sort of financial aid?
The table below shows the decisions for 1200 applicants for financial aid at a local college by gender.
-What percent of females received some sort of financial aid?
Unlock Deck
Unlock for access to all 100 flashcards in this deck.
Unlock Deck
k this deck
61
Use the following information for questions:
The table below shows the decisions for 1200 applicants for financial aid at a local college by gender.
-What percent of males received some sort of financial aid?
The table below shows the decisions for 1200 applicants for financial aid at a local college by gender.
-What percent of males received some sort of financial aid?
Unlock Deck
Unlock for access to all 100 flashcards in this deck.
Unlock Deck
k this deck
62
The tables below show the financial aid results by gender for each program.
-For the nursing program, what are the percentages of females and of males that received some sort of financial aid?
-For the nursing program, what are the percentages of females and of males that received some sort of financial aid?
Unlock Deck
Unlock for access to all 100 flashcards in this deck.
Unlock Deck
k this deck
63
The tables below show the financial aid results by gender for each program.
-For the engineering program, what are the percentages of females and of males that received some sort of financial aid?
-For the engineering program, what are the percentages of females and of males that received some sort of financial aid?
Unlock Deck
Unlock for access to all 100 flashcards in this deck.
Unlock Deck
k this deck
64
The tables below show the financial aid results by gender for each program.
-Explain how each program can have a higher percentage of males receiving financial aid, yet overall there was a higher percentage of females receiving financial aid. Think about the differences between these two programs in terms of financial aid being given, and the distribution of gender for each program.
-Explain how each program can have a higher percentage of males receiving financial aid, yet overall there was a higher percentage of females receiving financial aid. Think about the differences between these two programs in terms of financial aid being given, and the distribution of gender for each program.
Unlock Deck
Unlock for access to all 100 flashcards in this deck.
Unlock Deck
k this deck
65
Explain in your own words or through an example what Simpson's paradox is.
Unlock Deck
Unlock for access to all 100 flashcards in this deck.
Unlock Deck
k this deck
66
Use the following information for questions:
The table below shows the opinions of 321 respondents from the General Social Survey by whether they owned a gun (or not) and whether they favored (or opposed) a law requiring a permit to own a gun.
-The percentage of gun owners in favor of the gun law was
A) 34%
B) 41%
C) 76%
D) 83%
The table below shows the opinions of 321 respondents from the General Social Survey by whether they owned a gun (or not) and whether they favored (or opposed) a law requiring a permit to own a gun.
-The percentage of gun owners in favor of the gun law was
A) 34%
B) 41%
C) 76%
D) 83%
Unlock Deck
Unlock for access to all 100 flashcards in this deck.
Unlock Deck
k this deck
67
Use the following information for questions:
The table below shows the opinions of 321 respondents from the General Social Survey by whether they owned a gun (or not) and whether they favored (or opposed) a law requiring a permit to own a gun.
-The percentage of non-gun owners in favor of the gun law was
A) 49%
B) 59%
C) 83%
D) 89%
The table below shows the opinions of 321 respondents from the General Social Survey by whether they owned a gun (or not) and whether they favored (or opposed) a law requiring a permit to own a gun.
-The percentage of non-gun owners in favor of the gun law was
A) 49%
B) 59%
C) 83%
D) 89%
Unlock Deck
Unlock for access to all 100 flashcards in this deck.
Unlock Deck
k this deck
68
Use the following information for questions:
The table below shows the opinions of 321 respondents from the General Social Survey by whether they owned a gun (or not) and whether they favored (or opposed) a law requiring a permit to own a gun.
-Based on the chi-square statistic and p-value, one can conclude that
A) the difference between the support for the gun law between gun owners and non-gun owners is not statistically significant.
B) the difference between the support for the gun law between gun owners and non-gun owners is statistically significant.
C) the difference between the support for the gun law between gun owners and non-gun owners is not practically significant.
D) the difference between the support for the gun law between gun owners and non-gun owners is practically significant.
Unlock Deck
Unlock for access to all 100 flashcards in this deck.
Unlock Deck
k this deck
69
Use the following information for questions:
A researcher conducted a study on college students to see if there was a link between gender and how often they have cheated on an exam. She asked two questions on a survey:
(1) What is your gender? Male ___ Female ___
(2) How many times have you cheated on an exam while in college?
Never __ 1 or 2 times ___ 3 or more times ___
A two-way table of observed counts follows:
Chi-Square = 5.33, DF = 2, P-Value = 0.0696
-The percentage of males who cheated 1 or 2 times was
A) 20%
B) 30%
C) 50%
D) 25%
A researcher conducted a study on college students to see if there was a link between gender and how often they have cheated on an exam. She asked two questions on a survey:
(1) What is your gender? Male ___ Female ___
(2) How many times have you cheated on an exam while in college?
Never __ 1 or 2 times ___ 3 or more times ___
A two-way table of observed counts follows:
Chi-Square = 5.33, DF = 2, P-Value = 0.0696-The percentage of males who cheated 1 or 2 times was
A) 20%
B) 30%
C) 50%
D) 25%
Unlock Deck
Unlock for access to all 100 flashcards in this deck.
Unlock Deck
k this deck
70
Use the following information for questions:
A researcher conducted a study on college students to see if there was a link between gender and how often they have cheated on an exam. She asked two questions on a survey:
(1) What is your gender? Male ___ Female ___
(2) How many times have you cheated on an exam while in college?
Never __ 1 or 2 times ___ 3 or more times ___
A two-way table of observed counts follows:
Chi-Square = 5.33, DF = 2, P-Value = 0.0696
-The percentage of females who cheated 1 or 2 times was
A) 20%
B) 30%
C) 50%
D) 25%
A researcher conducted a study on college students to see if there was a link between gender and how often they have cheated on an exam. She asked two questions on a survey:
(1) What is your gender? Male ___ Female ___
(2) How many times have you cheated on an exam while in college?
Never __ 1 or 2 times ___ 3 or more times ___
A two-way table of observed counts follows:
Chi-Square = 5.33, DF = 2, P-Value = 0.0696-The percentage of females who cheated 1 or 2 times was
A) 20%
B) 30%
C) 50%
D) 25%
Unlock Deck
Unlock for access to all 100 flashcards in this deck.
Unlock Deck
k this deck
71
Use the following information for questions:
A researcher conducted a study on college students to see if there was a link between gender and how often they have cheated on an exam. She asked two questions on a survey:
(1) What is your gender? Male ___ Female ___
(2) How many times have you cheated on an exam while in college?
Never __ 1 or 2 times ___ 3 or more times ___
A two-way table of observed counts follows:
Chi-Square = 5.33, DF = 2, P-Value = 0.0696
-Based on the chi-square statistic and p-value, what conclusion can be made about the relationship between gender and response to the question about cheating, using = 0.05?
A) The result is not statistically significant so there does not appear to be a relationship.
B) The result is not statistically significant so there does appear to be a relationship.
C) The result is statistically significant so there does not appear to be relationship.
D) The result is statistically significant so there does appear to be a relationship.
A researcher conducted a study on college students to see if there was a link between gender and how often they have cheated on an exam. She asked two questions on a survey:
(1) What is your gender? Male ___ Female ___
(2) How many times have you cheated on an exam while in college?
Never __ 1 or 2 times ___ 3 or more times ___
A two-way table of observed counts follows:
Chi-Square = 5.33, DF = 2, P-Value = 0.0696-Based on the chi-square statistic and p-value, what conclusion can be made about the relationship between gender and response to the question about cheating, using = 0.05?
A) The result is not statistically significant so there does not appear to be a relationship.
B) The result is not statistically significant so there does appear to be a relationship.
C) The result is statistically significant so there does not appear to be relationship.
D) The result is statistically significant so there does appear to be a relationship.
Unlock Deck
Unlock for access to all 100 flashcards in this deck.
Unlock Deck
k this deck
72
Use the following information for questions:
In the General Social Survey, respondents were asked "Would you approve of an adult male punching a stranger if the stranger was drunk and bumped into the man and his wife on the street?" A two-way table summarizing the results for 1006 respondents, by gender, is shown below: Chi-Square = 0.002, DF = 2, P-Value = 0.9990
-The percentage of males who responded 'Yes' was
A) 8.1%
B) 4.6%
C) 8.0%
D) 3.5%
In the General Social Survey, respondents were asked "Would you approve of an adult male punching a stranger if the stranger was drunk and bumped into the man and his wife on the street?" A two-way table summarizing the results for 1006 respondents, by gender, is shown below:
Chi-Square = 0.002, DF = 2, P-Value = 0.9990-The percentage of males who responded 'Yes' was
A) 8.1%
B) 4.6%
C) 8.0%
D) 3.5%
Unlock Deck
Unlock for access to all 100 flashcards in this deck.
Unlock Deck
k this deck
73
Use the following information for questions:
In the General Social Survey, respondents were asked "Would you approve of an adult male punching a stranger if the stranger was drunk and bumped into the man and his wife on the street?" A two-way table summarizing the results for 1006 respondents, by gender, is shown below: Chi-Square = 0.002, DF = 2, P-Value = 0.9990
-The percentage of females who responded 'Yes' was
A) 8.1%
B) 4.6%
C) 8.0%
D) 3.5%
In the General Social Survey, respondents were asked "Would you approve of an adult male punching a stranger if the stranger was drunk and bumped into the man and his wife on the street?" A two-way table summarizing the results for 1006 respondents, by gender, is shown below:
Chi-Square = 0.002, DF = 2, P-Value = 0.9990-The percentage of females who responded 'Yes' was
A) 8.1%
B) 4.6%
C) 8.0%
D) 3.5%
Unlock Deck
Unlock for access to all 100 flashcards in this deck.
Unlock Deck
k this deck
74
Use the following information for questions:
In the General Social Survey, respondents were asked "Would you approve of an adult male punching a stranger if the stranger was drunk and bumped into the man and his wife on the street?" A two-way table summarizing the results for 1006 respondents, by gender, is shown below: Chi-Square = 0.002, DF = 2, P-Value = 0.9990
-Based on the chi-square statistic and p-value, what conclusion can be made about the relationship between gender and response to the question about approving of a punch, using = 0.05?
A) The result is not statistically significant so there does not appear to be a relationship.
B) The result is not statistically significant so there does appear to be a relationship.
C) The result is statistically significant so there does not appear to be relationship.
D) The result is statistically significant so there does appear to be a relationship.
In the General Social Survey, respondents were asked "Would you approve of an adult male punching a stranger if the stranger was drunk and bumped into the man and his wife on the street?" A two-way table summarizing the results for 1006 respondents, by gender, is shown below:
Chi-Square = 0.002, DF = 2, P-Value = 0.9990-Based on the chi-square statistic and p-value, what conclusion can be made about the relationship between gender and response to the question about approving of a punch, using = 0.05?
A) The result is not statistically significant so there does not appear to be a relationship.
B) The result is not statistically significant so there does appear to be a relationship.
C) The result is statistically significant so there does not appear to be relationship.
D) The result is statistically significant so there does appear to be a relationship.
Unlock Deck
Unlock for access to all 100 flashcards in this deck.
Unlock Deck
k this deck
75
Use the following information for questions:
Students in a statistics class were asked, "With whom do you find it easier to make friends: person of the same sex, person of opposite sex, or no preference?" A table summarizing the responses by gender is given below. Minitab results for a chi-square test for these data were "Chi-Sq = 7.15 DF=2 P-value = 0.028."
-Among females, what percent said "same sex?"
A) 15%
B) 25%
C) 30%
D) 60%
Unlock Deck
Unlock for access to all 100 flashcards in this deck.
Unlock Deck
k this deck
76
Use the following information for questions:
Students in a statistics class were asked, "With whom do you find it easier to make friends: person of the same sex, person of opposite sex, or no preference?" A table summarizing the responses by gender is given below. Minitab results for a chi-square test for these data were "Chi-Sq = 7.15 DF=2 P-value = 0.028."
-Assume these students represent a random sample of all students. Based on the chi-square test, what conclusion can be made about the relationship between gender and response to the question about friends, using = 0.05?
A) The result is not statistically significant so there does not appear to be a relationship.
B) The result is not statistically significant so there does appear to be a relationship.
C) The result is statistically significant so there does not appear to be relationship.
D) The result is statistically significant so there does appear to be a relationship.
Unlock Deck
Unlock for access to all 100 flashcards in this deck.
Unlock Deck
k this deck
77
A study done by the Center for Academic Integrity at Rutgers University surveyed 2116 students at 21 colleges and universities. Some of the schools had an "honor code"and others did not. Of the students at schools with an honor code, 7% reported having plagiarized a paper via the Internet, while at schools with no honor code, 13% did so. (Sacramento Bee, Feb 29, 2000, D1.) Although the data provided are not sufficient to carry out a chi-square test of the relationship between whether or not a school has an honor code and whether or not a student would plagiarize a paper via the Internet, suppose such a test were to show a statistically significant relationship on the basis of this study. What would be the correct conclusion?
A) Because this is an observational study, it can be concluded that implementing an honor code at a college or university will reduce the risk of plagiarism.
B) Because this is a randomized experiment, it can be concluded that implementing an honor code at a college or university will reduce the risk of plagiarism.
C) Because this is an observational study and confounding variables are likely, it cannot be concluded that implementing an honor code at a college or university will reduce the risk of plagiarism.
D) Because this is a randomized experiment and confounding variables are likely, it cannot be concluded that implementing an honor code at a college or university will reduce the risk of plagiarism.
Unlock Deck
Unlock for access to all 100 flashcards in this deck.
Unlock Deck
k this deck
78
The statistical significance of the association or relationship between two categorical variables is examined using a value known as the chi-square statistic, and a corresponding p-value that assesses the chance of getting this value for the Chi-square statistic or one even larger. Suppose the p-value of the test turns out to be 0.18. In this case, we should decide that
A) there is only an 18% chance that the observed relationship occurred by chance, so we can say that the relationship is statistically significant.
B) the observed relationship most likely did not occur by chance, so we can say that the relationship is statistically significant.
C) the observed relationship most likely did not occur by chance, so we cannot say that the relationship is statistically significant.
D) the observed relationship could have occurred by chance, so we cannot say that the relationship is statistically significant
Unlock Deck
Unlock for access to all 100 flashcards in this deck.
Unlock Deck
k this deck
79
The following two-way cross-tabulation (contingency table) of counts summarizes the relationship between gender and smoking status: Of the males, what percentage smokes?
A) 600/1000, or 60%
B) 150/1000, or 15%.
C) 150/600, or 25%.
D) 150/250, or 60%.
Of the males, what percentage smokes?A) 600/1000, or 60%
B) 150/1000, or 15%.
C) 150/600, or 25%.
D) 150/250, or 60%.
Unlock Deck
Unlock for access to all 100 flashcards in this deck.
Unlock Deck
k this deck
80
A statistically significant relationship between two categorical variables is illustrated in the sample as one that
A) is small enough that it is likely to have occurred in the observed sample even if there is no relationship in the population.
B) is small enough that it is unlikely to have occurred in the observed sample if there is no relationship in the population.
C) is large enough that it is likely to have occurred in the observed sample even if there is no relationship in the population
D) is large enough that it is unlikely to have occurred in the observed sample if there is no relationship in the population
Unlock Deck
Unlock for access to all 100 flashcards in this deck.
Unlock Deck
k this deck
Unlock Deck
Unlock for access to all 100 flashcards in this deck.


