Deck 2: Trade-Offs, Comparative Advantage, and the Market System
Full screen (f)
Question
Question
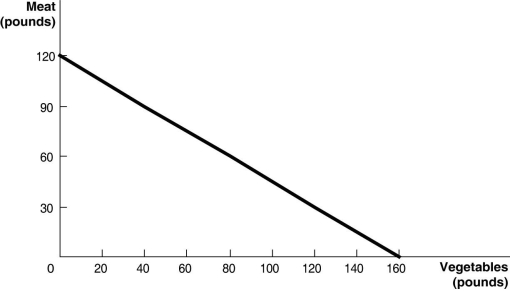 Figure 2-2 above shows the production possibilities frontier for Mendonca, an agrarian nation that produces two goods, meat and vegetables.
-Refer to Figure 2-2. What is the opportunity cost of one pound of vegetables?
A) pound of meat
B) 1.2 pounds of meat
C) pounds of meat
D) 12 pounds of meat
Question
Figure 2-2 above shows the production possibilities frontier for Mendonca, an agrarian nation that produces two goods, meat and vegetables.-Refer to Figure 2-2. What is the opportunity cost of one pound of meat?
A) pound of vegetables
B) pounds of vegetables
C) 1.6 pounds of vegetables
D) 16 pounds of vegetables
Question
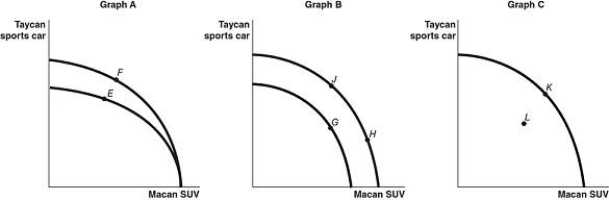 Porsche is developing all-electric and hybrid electric vehicles, and has announced that by 2025, they expect more than 50 percent of their worldwide sales will be all-electric or hybrid models. Figure 2-7 shows changes to Porsche's production possibilities frontier at its manufacturing facilities in response to new developments and different strategic production decisions.
-Refer to Figure 2-7. Assume a technological advancement greatly reduces the cost to produce batteries for its Taycan sports car. This is best represented by the
A) movement from E to F in Graph A.
B) movement from G to H in Graph B.
C) movement from K to L in Graph C.
D) movement from H to J in Graph B.
Question
Porsche is developing all-electric and hybrid electric vehicles, and has announced that by 2025, they expect more than 50 percent of their worldwide sales will be all-electric or hybrid models. Figure 2-7 shows changes to Porsche's production possibilities frontier at its manufacturing facilities in response to new developments and different strategic production decisions.-Refer to Figure 2-7. Assume that in response to changing consumer demands, Porsche cuts back on the production of Macan SUVs and increases its production of Taycan sports cars. This strategy is best represented by the
A) movement from E to F in Graph A.
B) movement from J to G in Graph B.
C) movement from L to K in Graph C.
D) movement from H to J in Graph B.
Question
Porsche is developing all-electric and hybrid electric vehicles, and has announced that by 2025, they expect more than 50 percent of their worldwide sales will be all-electric or hybrid models. Figure 2-7 shows changes to Porsche's production possibilities frontier at its manufacturing facilities in response to new developments and different strategic production decisions.-Refer to Figure 2-7. Assume that in 2025, Porsche temporarily shuts down part of it manufacturing facilities for an extensive renovation, and this reduces the amount of production capacity available for both types of vehicles. This is best represented by the
A) movement from E to F in Graph A.
B) movement from H to J in Graph B.
C) movement from K to L in Graph C.
D) movement from G to J in Graph B.
Question
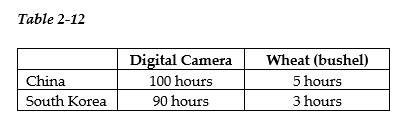
-Refer to Table 2-12. This table shows the number of labor hours required to produce a digital camera and a bushel of wheat in China and South Korea.
a. Assume each country has a total of 9,000 labor hours to devote to the production of the two goods and draw the production possibilities frontier for each country. Put "Digital Camera" on the horizontal axis and "Wheat" on the vertical axis. Be sure to identify the intercept values on your graphs.
b. Suppose each country allocates 60% of its labor hours to wheat production and 40% to the production of digital cameras. Complete Table 2-13 below to show each country's output of the two products.
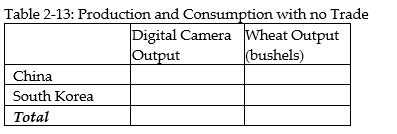 c. If the two countries do not trade and consume whatever they produce, identify the current production and consumption point for each country on their respective production possibilities frontiers. Label China's consumption point "C" and South Korea's consumption point "K."
d. Suppose the two countries specialize and trade. Which country should produce digital cameras and which should produce wheat? Explain your answer.
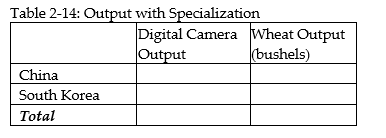
e. Complete Table 2-14 below to show each country's output with specialization.
 f. Did specialization increase the combined output for the two countries without any increase in resources? If so, by how much?
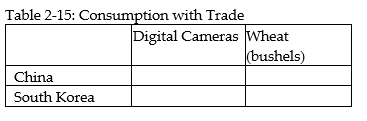
g. Suppose China and South Korea agree to trade so that in exchange for 1,200 bushels of wheat, the exporter of wheat receives 48 digital cameras. Complete Table 2-15 below to show each country's consumption bundle after trade.
 h. Show the consumption points after trade on each country's production possibilities frontier. Label these points "B" for China and "J" for South Korea.
i. Has trade made the two countries better off? Explain your answer.
Question
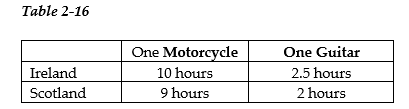
-Refer to Table 2-16. This table shows the number of labor hours required to produce a motorcycle and a guitar in Ireland and Scotland.
a. Which country has an absolute advantage in the production of motorcycles?
b. Which country has an absolute advantage in the production of guitars?
c. What is Ireland's opportunity cost of producing one motorcycle?
d. What is Scotland's opportunity cost of producing one motorcycle?
e. What is Ireland's opportunity cost of producing one guitar?
f. What is Scotland's opportunity cost of producing one guitar?
g. If each country specializes in the production of the product in which it has a comparative advantage, which country should produce motorcycles?
h. If each country specializes in the production of the product in which it has a comparative advantage, which country should produce guitars?
Question
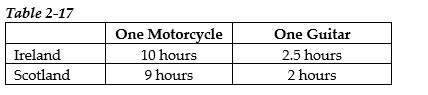
-Refer to Table 2-17. This table shows the number of labor hours required to produce a motorcycle and a guitar in Ireland and Scotland.
a. Assume each country has a total of 2,700 labor hours to devote to the production of the two goods and draw the production possibilities frontier for each country. Put "Motorcycle" on the horizontal axis and "Guitar" on the vertical axis. Be sure to identify the intercept values on your graphs.
b. Suppose each country allocates 55% of its labor hours to guitar production and 45% to the production of motorcycles. Complete Table 2-18 below to show each country's output of the two products.
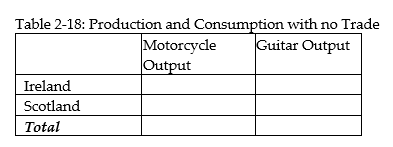 c. If the two countries do not trade and consume whatever they produce, identify the current production and consumption point for each country on their respective production possibilities frontiers. Label Ireland's consumption point "I" and Scotland's consumption point "S."
d. Suppose the two countries specialize and trade. Which country should produce motorcycles and which should produce guitars? Explain your answer.
e. Complete Table 2-19 below to show each country's output with specialization.
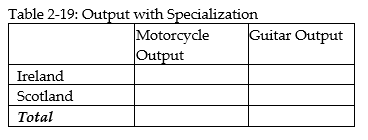 f. Did specialization increase the combined output for the two countries without any increase in resources? If so, by how much?
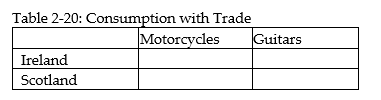
g. Suppose Ireland and Scotland agree to trade so that in exchange for 600 guitars, the exporter of guitars receives 140 motorcycles. Complete Table 2-20 below to show each country's consumption bundle after trade.
 h. Show the consumption points after trade on each country's production possibilities frontier. Label these points "X" for Ireland and "Y" for Scotland.
i. Has trade made the two countries better off? Explain your answer.
Question
Question
Question

Unlock Deck
Sign up to unlock the cards in this deck!
Unlock Deck
Unlock Deck
1/12
Play
Full screen (f)
Deck 2: Trade-Offs, Comparative Advantage, and the Market System
1
In 2017, Tesla Motors introduced the Model 3, its first low cost model which it had hoped to sell for $35,000 but realized that it would lose several thousand dollars per car at that price. Prior to the introduction of the Model 3, Tesla's two existing models (the Model S sedan and the Model X SUV) had starting prices of over $70,000 and at those prices, the company was earning a profit on each car sold. Tesla CEO Elon Musk said that "Higher volume and manufacturing design improvements are crucial for Tesla [to sell the Model 3 at a price of $35,000]...." In deciding to increase volume and improve manufacturing design for the Model 3, Tesla
A) faced no trade-offs because it was already making a profit selling its Model S and Model X vehicles.
B) faced a trade-off between devoting additional resources to the production of the Model 3 and devoting additional resources to producing its other models.
C) was guaranteed to be able to reduce costs on its Model 3 to a point where it could sell the Model 3 at a price of $35,000 and earn a profit.
D) had no choice but to increase the selling prices of its Model S sedan and Model X SUV.
faced a trade-off between devoting additional resources to the production of the Model 3 and devoting additional resources to producing its other models.
2
Figure 2-2 above shows the production possibilities frontier for Mendonca, an agrarian nation that produces two goods, meat and vegetables.-Refer to Figure 2-2. What is the opportunity cost of one pound of vegetables?
A) pound of meat
B) 1.2 pounds of meat
C) pounds of meat
D) 12 pounds of meat
pound of meat
3
Figure 2-2 above shows the production possibilities frontier for Mendonca, an agrarian nation that produces two goods, meat and vegetables.-Refer to Figure 2-2. What is the opportunity cost of one pound of meat?
A) pound of vegetables
B) pounds of vegetables
C) 1.6 pounds of vegetables
D) 16 pounds of vegetables
pounds of vegetables
4
Porsche is developing all-electric and hybrid electric vehicles, and has announced that by 2025, they expect more than 50 percent of their worldwide sales will be all-electric or hybrid models. Figure 2-7 shows changes to Porsche's production possibilities frontier at its manufacturing facilities in response to new developments and different strategic production decisions.-Refer to Figure 2-7. Assume a technological advancement greatly reduces the cost to produce batteries for its Taycan sports car. This is best represented by the
A) movement from E to F in Graph A.
B) movement from G to H in Graph B.
C) movement from K to L in Graph C.
D) movement from H to J in Graph B.
Unlock Deck
Unlock for access to all 12 flashcards in this deck.
Unlock Deck
k this deck
5
Porsche is developing all-electric and hybrid electric vehicles, and has announced that by 2025, they expect more than 50 percent of their worldwide sales will be all-electric or hybrid models. Figure 2-7 shows changes to Porsche's production possibilities frontier at its manufacturing facilities in response to new developments and different strategic production decisions.-Refer to Figure 2-7. Assume that in response to changing consumer demands, Porsche cuts back on the production of Macan SUVs and increases its production of Taycan sports cars. This strategy is best represented by the
A) movement from E to F in Graph A.
B) movement from J to G in Graph B.
C) movement from L to K in Graph C.
D) movement from H to J in Graph B.
Unlock Deck
Unlock for access to all 12 flashcards in this deck.
Unlock Deck
k this deck
6
Porsche is developing all-electric and hybrid electric vehicles, and has announced that by 2025, they expect more than 50 percent of their worldwide sales will be all-electric or hybrid models. Figure 2-7 shows changes to Porsche's production possibilities frontier at its manufacturing facilities in response to new developments and different strategic production decisions.-Refer to Figure 2-7. Assume that in 2025, Porsche temporarily shuts down part of it manufacturing facilities for an extensive renovation, and this reduces the amount of production capacity available for both types of vehicles. This is best represented by the
A) movement from E to F in Graph A.
B) movement from H to J in Graph B.
C) movement from K to L in Graph C.
D) movement from G to J in Graph B.
Unlock Deck
Unlock for access to all 12 flashcards in this deck.
Unlock Deck
k this deck
7
-Refer to Table 2-12. This table shows the number of labor hours required to produce a digital camera and a bushel of wheat in China and South Korea.
a. Assume each country has a total of 9,000 labor hours to devote to the production of the two goods and draw the production possibilities frontier for each country. Put "Digital Camera" on the horizontal axis and "Wheat" on the vertical axis. Be sure to identify the intercept values on your graphs.
b. Suppose each country allocates 60% of its labor hours to wheat production and 40% to the production of digital cameras. Complete Table 2-13 below to show each country's output of the two products.
c. If the two countries do not trade and consume whatever they produce, identify the current production and consumption point for each country on their respective production possibilities frontiers. Label China's consumption point "C" and South Korea's consumption point "K."d. Suppose the two countries specialize and trade. Which country should produce digital cameras and which should produce wheat? Explain your answer.
e. Complete Table 2-14 below to show each country's output with specialization.
f. Did specialization increase the combined output for the two countries without any increase in resources? If so, by how much?g. Suppose China and South Korea agree to trade so that in exchange for 1,200 bushels of wheat, the exporter of wheat receives 48 digital cameras. Complete Table 2-15 below to show each country's consumption bundle after trade.
h. Show the consumption points after trade on each country's production possibilities frontier. Label these points "B" for China and "J" for South Korea.i. Has trade made the two countries better off? Explain your answer.
Unlock Deck
Unlock for access to all 12 flashcards in this deck.
Unlock Deck
k this deck
8
-Refer to Table 2-16. This table shows the number of labor hours required to produce a motorcycle and a guitar in Ireland and Scotland.
a. Which country has an absolute advantage in the production of motorcycles?
b. Which country has an absolute advantage in the production of guitars?
c. What is Ireland's opportunity cost of producing one motorcycle?
d. What is Scotland's opportunity cost of producing one motorcycle?
e. What is Ireland's opportunity cost of producing one guitar?
f. What is Scotland's opportunity cost of producing one guitar?
g. If each country specializes in the production of the product in which it has a comparative advantage, which country should produce motorcycles?
h. If each country specializes in the production of the product in which it has a comparative advantage, which country should produce guitars?
Unlock Deck
Unlock for access to all 12 flashcards in this deck.
Unlock Deck
k this deck
9
-Refer to Table 2-17. This table shows the number of labor hours required to produce a motorcycle and a guitar in Ireland and Scotland.
a. Assume each country has a total of 2,700 labor hours to devote to the production of the two goods and draw the production possibilities frontier for each country. Put "Motorcycle" on the horizontal axis and "Guitar" on the vertical axis. Be sure to identify the intercept values on your graphs.
b. Suppose each country allocates 55% of its labor hours to guitar production and 45% to the production of motorcycles. Complete Table 2-18 below to show each country's output of the two products.
c. If the two countries do not trade and consume whatever they produce, identify the current production and consumption point for each country on their respective production possibilities frontiers. Label Ireland's consumption point "I" and Scotland's consumption point "S."d. Suppose the two countries specialize and trade. Which country should produce motorcycles and which should produce guitars? Explain your answer.
e. Complete Table 2-19 below to show each country's output with specialization.
f. Did specialization increase the combined output for the two countries without any increase in resources? If so, by how much?g. Suppose Ireland and Scotland agree to trade so that in exchange for 600 guitars, the exporter of guitars receives 140 motorcycles. Complete Table 2-20 below to show each country's consumption bundle after trade.
h. Show the consumption points after trade on each country's production possibilities frontier. Label these points "X" for Ireland and "Y" for Scotland.i. Has trade made the two countries better off? Explain your answer.
Unlock Deck
Unlock for access to all 12 flashcards in this deck.
Unlock Deck
k this deck
10
In December 2019, a bipartisan group of senators introduced a bill which would expand the authority of the United States Customs and Border Protection agency to seize counterfeit goods at the U.S. border that infringe on intellectual property rights. If passed, this legislation would prevent the importation of counterfeit products into the United States. The estimated global trade value of counterfeit products in 2019 was over $1 trillion.
Source: Paul D. Ackerman, Gary A. Abelev, and Aimee N. Soucie, "Proposed Counterfeit Goods Seizure Act of 2019 Would Provide Design Patent Protection at the US Border," huntonretailindustryblog.com, December 18, 2019.
-Refer to the Article Summary. If the Counterfeit Goods Seizure Act of 2019 becomes law, all of the following would most likely occur except
A) companies would increase investment in the development of more innovative products.
B) innovating companies would consider expanding their research and development departments.
C) more patents would be issued to innovators and inventors.
D) fewer dollars would be spent on the development of new technology.
Unlock Deck
Unlock for access to all 12 flashcards in this deck.
Unlock Deck
k this deck
11
An iPad contains hundreds of parts that are designed, manufactured, and assembled by firms around the world. Using many different firms in the production of the iPad addresses which of the following fundamental economic questions?
A) What goods and services will be produced?
B) How will the goods and services be produced?
C) Who will receive the goods and services produced?
D) When will the goods and services be produced?
A) What goods and services will be produced?
B) How will the goods and services be produced?
C) Who will receive the goods and services produced?
D) When will the goods and services be produced?
Unlock Deck
Unlock for access to all 12 flashcards in this deck.
Unlock Deck
k this deck
12
Socialist politicians including Senator Bernie Sanders and Congresswoman Alexandria Ocasio-Cortez advocate a larger role for government in the economy, including all of the following except
A) "Medicare for All."
B) government-paid tuition at two-year and four-year colleges.
C) higher tax rates on corporations and the elimination of taxes on individuals.
D) the "Green New Deal."
A) "Medicare for All."
B) government-paid tuition at two-year and four-year colleges.
C) higher tax rates on corporations and the elimination of taxes on individuals.
D) the "Green New Deal."
Unlock Deck
Unlock for access to all 12 flashcards in this deck.
Unlock Deck
k this deck
Unlock Deck
Unlock for access to all 12 flashcards in this deck.


