Deck 14: Tests of Hypotheses Based on Count Data
Full screen (f)
Question
Question
Question
Question
Question
Question
Question
Question
Question
Question
Question
Question
Question
Question
Question
Question
Question
Question
Question
Question
A manufacturer has test-marketed a new men's cologne. Simple random samples of male students at a university were asked to try the product for four weeks and then were asked the question: "Would you purchase the product?" The results are shown in the following table:
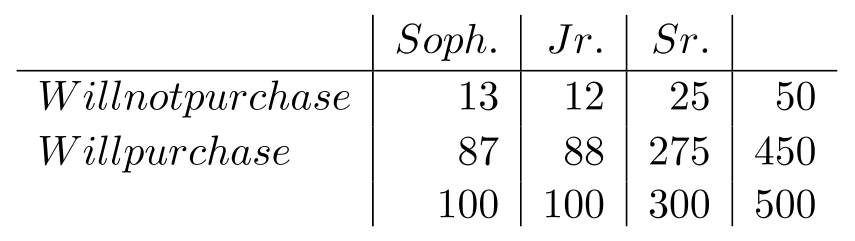
-Would you conclude the respondents' preferences are independent of year in college? Conduct the test at .
-Would you conclude the respondents' preferences are independent of year in college? Conduct the test at .
Question
A sample of 210 people were telephoned. The number of rings that have fully elapsed before each person answered the phone are recorded below.
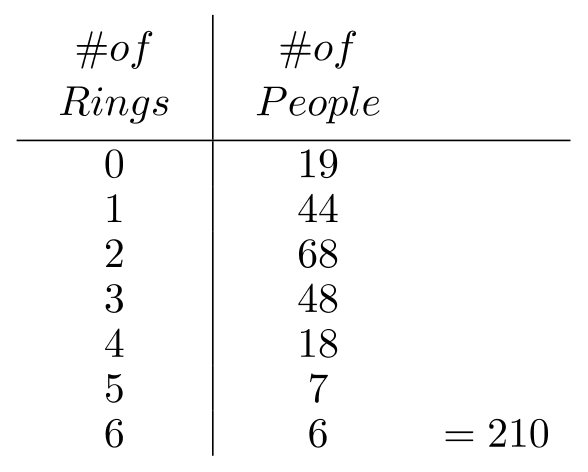
-At the 0.05 level of significance, does it appear that the data may be looked upon as a random sample from a binomial population with and ? Conduct the goodness-of-fit test.
-At the 0.05 level of significance, does it appear that the data may be looked upon as a random sample from a binomial population with and ? Conduct the goodness-of-fit test.
Question
Question
Question
Question
Question
Question
Question
Question
Question
Question
Question
Question
Question
Question
Question
Question
Question
Question
Question
Question
Question
Question

Unlock Deck
Sign up to unlock the cards in this deck!
Unlock Deck
Unlock Deck
1/43
Play
Full screen (f)
Deck 14: Tests of Hypotheses Based on Count Data
1
It is claimed that at most of all local businesses last more than one year. The null hypothesis is tested against the alternative at for a sample size of . Suppose eight of the businesses lasted more than one year. Which of the following decisions should be made regarding the null hypothesis?
A) Reject, since .
B) Do not reject, since .
C) Reject, since .
D) Do not reject, since .
A) Reject, since .
B) Do not reject, since .
C) Reject, since .
D) Do not reject, since .
Do not reject, since .
2
It is claimed that of all shoppers at a shopping mall enter a particular department store. A random sample of 14 shoppers at the mall was selected. If the null hypothesis is tested against the alternative that , the null hypothesis will be rejected at if __________ of the 14 shoppers enter the store.
A) at least 2
B) at most 1
C) at least 11
D) at most 10
A) at least 2
B) at most 1
C) at least 11
D) at most 10
at most 1
3
The null hypothesis that two processes produce the same proportion of defectives can be written
A) .
B) .
C) .
D) .
A) .
B) .
C) .
D) .
.
4
A placement office at a large university claims that approximately of the school's graduates will obtain jobs in their major field upon graduation. The administration feels that the percentage is larger than . From a random sample of 100 recent graduates it was found that 75 had obtained jobs in their field. The hypotheses are
A)
B)
C)
D)
A)
B)
C)
D)
Unlock Deck
Unlock for access to all 43 flashcards in this deck.
Unlock Deck
k this deck
5
If the observed frequencies are exactly equal to the expected frequencies in a chi-square test, the value of is
A) close to 1 .
B) a large positive value.
C) 0 .
D) a very small positive value.
A) close to 1 .
B) a large positive value.
C) 0 .
D) a very small positive value.
Unlock Deck
Unlock for access to all 43 flashcards in this deck.
Unlock Deck
k this deck
6
A small computed value for a contingency table reveals which of the following concerning the two variables?
A) There is a strong relationship between them.
B) One is dependent on the other.
C) The observed frequencies greatly differ from the expected frequencies.
D) One is independent of the other.
A) There is a strong relationship between them.
B) One is dependent on the other.
C) The observed frequencies greatly differ from the expected frequencies.
D) One is independent of the other.
Unlock Deck
Unlock for access to all 43 flashcards in this deck.
Unlock Deck
k this deck
7
In a study to determine if a college student's year in college is independent of his or her major, a sample of 200 students was found to contain 40 juniors and 50 accounting majors. Then, the expected frequency of junior accounting majors is
A) 10 .
B) 20 .
C) 25 .
D) 15 .
A) 10 .
B) 20 .
C) 25 .
D) 15 .
Unlock Deck
Unlock for access to all 43 flashcards in this deck.
Unlock Deck
k this deck
8
Which of the following conclusions is reasonable for a test of independence at if ?
A) If , then dependent.
B) If , then independent.
C) If , then dependent.
D) If , then independent.
A) If , then dependent.
B) If , then independent.
C) If , then dependent.
D) If , then independent.
Unlock Deck
Unlock for access to all 43 flashcards in this deck.
Unlock Deck
k this deck
9
For a contingency table, which of the following is true?
A) Numbers of rows and columns are equal.
B) Each cell has frequency .
C) Column and row totals are left to chance.
D) It cannot be used to test for the equality of two populations.
A) Numbers of rows and columns are equal.
B) Each cell has frequency .
C) Column and row totals are left to chance.
D) It cannot be used to test for the equality of two populations.
Unlock Deck
Unlock for access to all 43 flashcards in this deck.
Unlock Deck
k this deck
10
An office worker claims that at most of the phone calls he makes are the nonbusiness type. Test the null hypothesis that against a one-tailed alternative if a random sample of 13 of his calls reveals 8 nonbusiness calls. Use .
Unlock Deck
Unlock for access to all 43 flashcards in this deck.
Unlock Deck
k this deck
11
An office worker claims that at most of the phone calls he makes are the nonbusiness type. Test the null hypothesis that against a one-tailed alternative if a random sample of 13 of his calls reveals 8 nonbusiness calls. Use .
Unlock Deck
Unlock for access to all 43 flashcards in this deck.
Unlock Deck
k this deck
12
An office worker claims that at most of the phone calls he makes are the nonbusiness type. Conduct a two-tailed test of at , if a random sample of 13 of his calls reveals 8 nonbusiness calls.
Unlock Deck
Unlock for access to all 43 flashcards in this deck.
Unlock Deck
k this deck
13
A cereal company is marketing a new breakfast food. In a random sample of 250 people who have tried the product, 175 said that they would buy it again. What can we state with confidence about the maximum
size of our error if we use the sample proportion as an estimate of the actual population proportion of people who will buy the product a second time?
size of our error if we use the sample proportion as an estimate of the actual population proportion of people who will buy the product a second time?
Unlock Deck
Unlock for access to all 43 flashcards in this deck.
Unlock Deck
k this deck
14
A drug company wants to know whether the probability is really 0.20 that one of their products will produce side effects. In a random sample of 150 consumers of the product, 42 were victims of side effects. Conduct the two-tailed test. Use . State the hypothesis.
Unlock Deck
Unlock for access to all 43 flashcards in this deck.
Unlock Deck
k this deck
15
A drug company wants to know whether the probability is really 0.20 that one of their products will produce side effects. In a random sample of 150 consumers of the product, 42 were victims of side effects. Conduct a one-tailed test where the alternative is that the probability is greater than 0.20 . Use .
Unlock Deck
Unlock for access to all 43 flashcards in this deck.
Unlock Deck
k this deck
16
A suntan lotion manufacturer wants to estimate the proportion of people who will get a tan by using their product. In a sample of 80 people, 50 were tanned by the product. Find a confidence interval for the population proportion of people who will receive a tan from the lotion.
Unlock Deck
Unlock for access to all 43 flashcards in this deck.
Unlock Deck
k this deck
17
A university placement office wants to estimate the percentage of graduates that obtain jobs within one month of graduation. They want to be confident in their result and be within of the true percentage. Find the necessary sample size for this experiment, and find a confidence interval if of the sample received jobs within one month of graduation.
Unlock Deck
Unlock for access to all 43 flashcards in this deck.
Unlock Deck
k this deck
18
A television station wants to determine if there is a difference in the proportions of people who watched two of their programs. In random samples of 60 and 80 people, 25 and 40 people watched the first and second programs respectively.
-Using a 5\% significance level, conduct the test for the situation above.
-Using a 5\% significance level, conduct the test for the situation above.
Unlock Deck
Unlock for access to all 43 flashcards in this deck.
Unlock Deck
k this deck
19
A television station wants to determine if there is a difference in the proportions of people who watched two of their programs. In random samples of 60 and 80 people, 25 and 40 people watched the first and second programs respectively.
-In the situation above, suppose the station wants to know if fewer people watched the first program than the second. Use the same sample results and conduct the one-tailed test at .
-In the situation above, suppose the station wants to know if fewer people watched the first program than the second. Use the same sample results and conduct the one-tailed test at .
Unlock Deck
Unlock for access to all 43 flashcards in this deck.
Unlock Deck
k this deck
20
A manufacturer has test-marketed a new men's cologne. Simple random samples of male students at a university were asked to try the product for four weeks and then were asked the question: "Would you purchase the product?" The results are shown in the following table:
-Would you conclude the respondents' preferences are independent of year in college? Conduct the test at .
-Would you conclude the respondents' preferences are independent of year in college? Conduct the test at .
Unlock Deck
Unlock for access to all 43 flashcards in this deck.
Unlock Deck
k this deck
21
A sample of 210 people were telephoned. The number of rings that have fully elapsed before each person answered the phone are recorded below.
-At the 0.05 level of significance, does it appear that the data may be looked upon as a random sample from a binomial population with and ? Conduct the goodness-of-fit test.
-At the 0.05 level of significance, does it appear that the data may be looked upon as a random sample from a binomial population with and ? Conduct the goodness-of-fit test.
Unlock Deck
Unlock for access to all 43 flashcards in this deck.
Unlock Deck
k this deck
22
A company is marketing a laser disk recorder. A survey of 80 randomly selected male students at a college reveals that 45 would be interested in buying such a recorder. A corresponding survey of 120 female students reveals that 75 want to buy it. Test the hypothesis that there is no difference between the males and the females on this issue. Use the significance level.
Unlock Deck
Unlock for access to all 43 flashcards in this deck.
Unlock Deck
k this deck
23
Ninety out of 120 house-husbands prefer detergent . If the 90 house-husbands represent a random sample from a population of all potential purchasers, estimate the fraction of total house-husbands favoring detergent by constructing a confidence interval.
Unlock Deck
Unlock for access to all 43 flashcards in this deck.
Unlock Deck
k this deck
24
An auditor is assigned to investigate the probability of a bank's accounts having errors. If she has reason to believe that the probability is anywhere between 0.15 and 0.40 , how large a sample will she need to be confident that the estimated percentage of accounts containing errors is within 0.02 of the true percentage?
Unlock Deck
Unlock for access to all 43 flashcards in this deck.
Unlock Deck
k this deck
25
An automobile repair service asks 170 customers with annual incomes under \$20,000, 180 customers with annual incomes from to and 150 customers with annual incomes over whether they rated the repair service as outstanding, above average, average, below average, or poor. What hypotheses do we want to test if we are going to perform a chi-square analysis of the resulting table?
Unlock Deck
Unlock for access to all 43 flashcards in this deck.
Unlock Deck
k this deck
26
In determining the necessary sample size for confidence interval, the value 0.95 must be substituted into the formula for .
Unlock Deck
Unlock for access to all 43 flashcards in this deck.
Unlock Deck
k this deck
27
The chi-square test can be used to determine if there is a significant difference between two sample proportions.
Unlock Deck
Unlock for access to all 43 flashcards in this deck.
Unlock Deck
k this deck
28
In order to use the maximum error of estimate formula involving the sample value must be large enough to justify the normal curve approximation to the binomial distribution.
Unlock Deck
Unlock for access to all 43 flashcards in this deck.
Unlock Deck
k this deck
29
To decide whether or not observed differences among three sample proportions can be attributed to chance requires the use of the normal distribution table.
Unlock Deck
Unlock for access to all 43 flashcards in this deck.
Unlock Deck
k this deck
30
The value of has a definite effect on the number of degrees of freedom used to determine .
Unlock Deck
Unlock for access to all 43 flashcards in this deck.
Unlock Deck
k this deck
31
For a contingency table, the expected frequency values are based on the assumption that the null hypothesis is true.
Unlock Deck
Unlock for access to all 43 flashcards in this deck.
Unlock Deck
k this deck
32
The null hypothesis in a chi-square test of independence is that there is no relationship between the two variables.
Unlock Deck
Unlock for access to all 43 flashcards in this deck.
Unlock Deck
k this deck
33
The statistic should never be applied to contingency tables if some of the expected frequencies are less than 5.
Unlock Deck
Unlock for access to all 43 flashcards in this deck.
Unlock Deck
k this deck
34
The null hypothesis in a goodness-of-fit test is that the distribution of the sample does not fit the theoretical distribution.
Unlock Deck
Unlock for access to all 43 flashcards in this deck.
Unlock Deck
k this deck
35
The symbol represents a sample estimate of __________.
Unlock Deck
Unlock for access to all 43 flashcards in this deck.
Unlock Deck
k this deck
36
The standard error of the proportion is given by __________.
Unlock Deck
Unlock for access to all 43 flashcards in this deck.
Unlock Deck
k this deck
37
If , an hypothesis test may be conducted to test a population proportion using the normal curve if is between __________ and __________.
Unlock Deck
Unlock for access to all 43 flashcards in this deck.
Unlock Deck
k this deck
38
For a particular error value and confidence level, the maximum value that the sample size formula can assume occurs when equals __________.
Unlock Deck
Unlock for access to all 43 flashcards in this deck.
Unlock Deck
k this deck
39
The chi-square statistic for a contingency table will have __________ degrees of freedom.
Unlock Deck
Unlock for access to all 43 flashcards in this deck.
Unlock Deck
k this deck
40
The sample value is an estimate of the population value __________.
Unlock Deck
Unlock for access to all 43 flashcards in this deck.
Unlock Deck
k this deck
41
When conducting a chi-square test for a goodness-of-fit, the number of degrees of freedom is given by __________.
Unlock Deck
Unlock for access to all 43 flashcards in this deck.
Unlock Deck
k this deck
42
To determine if a set of data fits the pattern of the binomial distribution, the __________ test is used.
Unlock Deck
Unlock for access to all 43 flashcards in this deck.
Unlock Deck
k this deck
43
The larger the statistic in a goodness-of-fit test, the __________ likely the data fits the hypothesized distribution.
Unlock Deck
Unlock for access to all 43 flashcards in this deck.
Unlock Deck
k this deck
Unlock Deck
Unlock for access to all 43 flashcards in this deck.


