Deck 8: Analyzing Probabilities and Expected Values
Full screen (f)
Question
Question
Question
Question
Question
Question
Question
Question
Question
Question
Question
Question
Question
Question
Question
Question
Question
Question
Question
Question
Question
Question
Question
Question
Question
Question
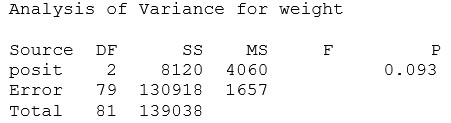
Data were collected on the weights for the entire roster of the 2005 Cal Poly football team. Individuals were classified as playing offense, defense, or special teams. Suppose you want to consider these data as representative of all collegiate football players and want to compare the average weight of the players in these three groups.
-State the alternative hypothesis in this study.
Consider the following ANOVA table.
-State the alternative hypothesis in this study.
Consider the following ANOVA table.
Question
Question
Question
Question
Question
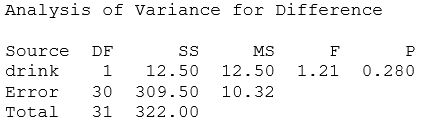
A group of students asked participants from their school to see how many sit-ups they could perform in one minute. Subjects were then randomly assigned to drink either Sobe or Rockstar, two energy drinks. Rockstar is marketed primarily as an energy drink, whereas Sobe is advertised more for taste. Exactly 30 minutes later, the number of sit-ups in one minute was again recorded. The students conjectured that the increase in the number of sit-ups performed would be higher for students drinking Rockstar than for Sobe.
-State the null hypothesis in symbols. Also clearly define what the symbols mean in this context. Consider the following ANOVA output:
-State the null hypothesis in symbols. Also clearly define what the symbols mean in this context. Consider the following ANOVA output:
Question
Question
Question

Unlock Deck
Sign up to unlock the cards in this deck!
Unlock Deck
Unlock Deck
1/34
Play
Full screen (f)
Deck 8: Analyzing Probabilities and Expected Values
1
Suppose that 70% of the customers at a particular fast food restaurant order a hamburger, 50% order French fries, and 45% order both. Let H denote the event that a randomly selected customer orders a hamburger, and let F denote the event that he or she orders French fries.
-Convert the given percentages into probability statements involving these symbols .
-Convert the given percentages into probability statements involving these symbols .
and
2
Suppose that 70% of the customers at a particular fast food restaurant order a hamburger, 50% order French fries, and 45% order both. Let H denote the event that a randomly selected customer orders a hamburger, and let F denote the event that he or she orders French fries.
-Determine the probability that a randomly selected customer orders either a hamburger or French fries.
-Determine the probability that a randomly selected customer orders either a hamburger or French fries.
By the addition rule, or and .
3
Suppose that 70% of the customers at a particular fast food restaurant order a hamburger, 50% order French fries, and 45% order both. Let H denote the event that a randomly selected customer orders a hamburger, and let F denote the event that he or she orders French fries.
-Determine the conditional probability that a randomly selected customer orders French fries given that he or she orders a hamburger.
-Determine the conditional probability that a randomly selected customer orders French fries given that he or she orders a hamburger.
and
4
Suppose that 70% of the customers at a particular fast food restaurant order a hamburger, 50% order French fries, and 45% order both. Let H denote the event that a randomly selected customer orders a hamburger, and let F denote the event that he or she orders French fries.
-Determine the conditional probability that a randomly selected customer orders a hamburger given that he or she orders French fries.
-Determine the conditional probability that a randomly selected customer orders a hamburger given that he or she orders French fries.
Unlock Deck
Unlock for access to all 34 flashcards in this deck.
Unlock Deck
k this deck
5
Suppose that 70% of the customers at a particular fast food restaurant order a hamburger, 50% order French fries, and 45% order both. Let H denote the event that a randomly selected customer orders a hamburger, and let F denote the event that he or she orders French fries.
-Are the events customer orders a hamburger and customer orders French fries independent? Justify your answer numerically.
-Are the events customer orders a hamburger and customer orders French fries independent? Justify your answer numerically.
Unlock Deck
Unlock for access to all 34 flashcards in this deck.
Unlock Deck
k this deck
6
Suppose that you have a probability of winning a game of solitaire, independently from game to game.
-If you play two games, what is the probability that you win both? State which probability rule you use for this calculation.
-If you play two games, what is the probability that you win both? State which probability rule you use for this calculation.
Unlock Deck
Unlock for access to all 34 flashcards in this deck.
Unlock Deck
k this deck
7
Suppose that you have a probability of winning a game of solitaire, independently from game to game.
-If you play two games, what is the probability that you lose both? State which probability rule(s) you use for this calculation.
-If you play two games, what is the probability that you lose both? State which probability rule(s) you use for this calculation.
Unlock Deck
Unlock for access to all 34 flashcards in this deck.
Unlock Deck
k this deck
8
Suppose that you have a probability of winning a game of solitaire, independently from game to game.
-If you play two games, what is the probability that you win at least once? State which probability rule(s) you use for this calculation.
-If you play two games, what is the probability that you win at least once? State which probability rule(s) you use for this calculation.
Unlock Deck
Unlock for access to all 34 flashcards in this deck.
Unlock Deck
k this deck
9
Suppose that you have a probability of winning a game of solitaire, independently from game to game.
-If you play repeatedly until you win, what is the probability that you lose four games and then win the fifth?
-If you play repeatedly until you win, what is the probability that you lose four games and then win the fifth?
Unlock Deck
Unlock for access to all 34 flashcards in this deck.
Unlock Deck
k this deck
10
Suppose that you have a probability of winning a game of solitaire, independently from game to game.
-If you play repeatedly until you win, what is the probability that you must play at least ten games?
-If you play repeatedly until you win, what is the probability that you must play at least ten games?
Unlock Deck
Unlock for access to all 34 flashcards in this deck.
Unlock Deck
k this deck
11
Suppose you encounter two traffic lights on your commute to school. You estimate that the probability is .5 that the first light will be red when you get to it, .4 that the second light will be red, and .6 that at least one of the lights will be red.
-Determine the probability that both lights will be red. (Hint: You might make a probability table or use one of the probability rules from Topic 30.)
-Determine the probability that both lights will be red. (Hint: You might make a probability table or use one of the probability rules from Topic 30.)
Unlock Deck
Unlock for access to all 34 flashcards in this deck.
Unlock Deck
k this deck
12
Suppose you encounter two traffic lights on your commute to school. You estimate that the probability is .5 that the first light will be red when you get to it, .4 that the second light will be red, and .6 that at least one of the lights will be red.
-Consider the random variable, which is the number of red lights that you encounter on this commute. Determine its probability distribution by listing its possible values and their probabilities.
-Consider the random variable, which is the number of red lights that you encounter on this commute. Determine its probability distribution by listing its possible values and their probabilities.
Unlock Deck
Unlock for access to all 34 flashcards in this deck.
Unlock Deck
k this deck
13
Suppose you encounter two traffic lights on your commute to school. You estimate that the probability is .5 that the first light will be red when you get to it, .4 that the second light will be red, and .6 that at least one of the lights will be red.
-Calculate and interpret the expected value of the number of red lights that you encounter.
-Calculate and interpret the expected value of the number of red lights that you encounter.
Unlock Deck
Unlock for access to all 34 flashcards in this deck.
Unlock Deck
k this deck
14
Suppose that a defendant faces charges of first-degree murder and of third-degree murder. She has been offered a plea-bargained agreement under which she would serve five years in jail by pleading guilty to the third-degree charge. If she does not plead guilty, however, the case will go to a jury trial, and the jury will reach one of three verdicts: not guilty, guilty of third-degree murder, or guilty of first-degree murder. If the jury finds her not guilty, she will serve no time in jail; if the jury finds her guilty of third-degree murder, she will serve seven years in jail; if the jury finds her guilty of first-degree murder, she will serve forty years in jail. Suppose that her attorney believes that the probability is .3 that a jury would find her innocent and .6 that a jury would find her guilty of third-degree murder.
-Determine the expected loss (in terms of years in jail) of proceeding to a jury trial.
-Determine the expected loss (in terms of years in jail) of proceeding to a jury trial.
Unlock Deck
Unlock for access to all 34 flashcards in this deck.
Unlock Deck
k this deck
15
Suppose that a defendant faces charges of first-degree murder and of third-degree murder. She has been offered a plea-bargained agreement under which she would serve five years in jail by pleading guilty to the third-degree charge. If she does not plead guilty, however, the case will go to a jury trial, and the jury will reach one of three verdicts: not guilty, guilty of third-degree murder, or guilty of first-degree murder. If the jury finds her not guilty, she will serve no time in jail; if the jury finds her guilty of third-degree murder, she will serve seven years in jail; if the jury finds her guilty of first-degree murder, she will serve forty years in jail. Suppose that her attorney believes that the probability is .3 that a jury would find her innocent and .6 that a jury would find her guilty of third-degree murder.
-Assuming that the defendant wants to minimize her expected jail sentence, should she accept the plea bargain or opt for a jury trial?
-Assuming that the defendant wants to minimize her expected jail sentence, should she accept the plea bargain or opt for a jury trial?
Unlock Deck
Unlock for access to all 34 flashcards in this deck.
Unlock Deck
k this deck
16
Suppose that a defendant faces charges of first-degree murder and of third-degree murder. She has been offered a plea-bargained agreement under which she would serve five years in jail by pleading guilty to the third-degree charge. If she does not plead guilty, however, the case will go to a jury trial, and the jury will reach one of three verdicts: not guilty, guilty of third-degree murder, or guilty of first-degree murder. If the jury finds her not guilty, she will serve no time in jail; if the jury finds her guilty of third-degree murder, she will serve seven years in jail; if the jury finds her guilty of first-degree murder, she will serve forty years in jail. Suppose that her attorney believes that the probability is .3 that a jury would find her innocent and .6 that a jury would find her guilty of third-degree murder.
-By making the decision that you reached in part , does the defendant guarantee she will be better off than if she had made the other decision? Explain.
-By making the decision that you reached in part , does the defendant guarantee she will be better off than if she had made the other decision? Explain.
Unlock Deck
Unlock for access to all 34 flashcards in this deck.
Unlock Deck
k this deck
17
When betting on a color in roulette, you have an 18/38 probability of winning on any one spin. Suppose that you bet on a color for five spins and count the number of times that you win.
-Explain why a binomial distribution is applicable here.
-Explain why a binomial distribution is applicable here.
Unlock Deck
Unlock for access to all 34 flashcards in this deck.
Unlock Deck
k this deck
18
When betting on a color in roulette, you have an 18/38 probability of winning on any one spin. Suppose that you bet on a color for five spins and count the number of times that you win.
-Specify the values of and for this binomial distribution.
-Specify the values of and for this binomial distribution.
Unlock Deck
Unlock for access to all 34 flashcards in this deck.
Unlock Deck
k this deck
19
When betting on a color in roulette, you have an 18/38 probability of winning on any one spin. Suppose that you bet on a color for five spins and count the number of times that you win.
-Calculate the probability that you win exactly three of the five spins.
-Calculate the probability that you win exactly three of the five spins.
Unlock Deck
Unlock for access to all 34 flashcards in this deck.
Unlock Deck
k this deck
20
When betting on a color in roulette, you have an 18/38 probability of winning on any one spin. Suppose that you bet on a color for five spins and count the number of times that you win.
-Calculate the probability that you win at least three of the five spins (and therefore come out ahead).
-Calculate the probability that you win at least three of the five spins (and therefore come out ahead).
Unlock Deck
Unlock for access to all 34 flashcards in this deck.
Unlock Deck
k this deck
21
When betting on a color in roulette, you have an 18/38 probability of winning on any one spin. Suppose that you bet on a color for five spins and count the number of times that you win.
-Determine the binomial probability that you win at least half of your spins if you spin 30 times.
-Determine the binomial probability that you win at least half of your spins if you spin 30 times.
Unlock Deck
Unlock for access to all 34 flashcards in this deck.
Unlock Deck
k this deck
22
In a study reported in the November 2007 issue of Nature, researchers investigated whether infants take into account an individual's actions towards others in evaluating that individual as appealing or aversive, perhaps laying the foundation for social interaction (Hamlin, Wynn, and Bloom, 2007). In one component of the study, 10-month-old infants were shown a "climber" character (a piece of wood with "google" eyes glued onto it) that could not make it up a hill in two tries. Then they were alternately shown two scenarios for the climber's next try, one where the climber was pushed to the top of the hill by another character ("helper") and one where the climber was pushed back down the hill by another character ("hinderer"). The infant was alternately shown these two scenarios several times. Then the child was presented with both pieces of wood (the helper and the hinderer) and asked to pick one to play with. The researchers found that 14 of the 16 infants chose the helper over the hinderer.
-If infants actually have no preference between the helper and hinderer, is it possible that 14 out of 16 infants would have chosen the helper toy just by chance? Explain.
-If infants actually have no preference between the helper and hinderer, is it possible that 14 out of 16 infants would have chosen the helper toy just by chance? Explain.
Unlock Deck
Unlock for access to all 34 flashcards in this deck.
Unlock Deck
k this deck
23
In a study reported in the November 2007 issue of Nature, researchers investigated whether infants take into account an individual's actions towards others in evaluating that individual as appealing or aversive, perhaps laying the foundation for social interaction (Hamlin, Wynn, and Bloom, 2007). In one component of the study, 10-month-old infants were shown a "climber" character (a piece of wood with "google" eyes glued onto it) that could not make it up a hill in two tries. Then they were alternately shown two scenarios for the climber's next try, one where the climber was pushed to the top of the hill by another character ("helper") and one where the climber was pushed back down the hill by another character ("hinderer"). The infant was alternately shown these two scenarios several times. Then the child was presented with both pieces of wood (the helper and the hinderer) and asked to pick one to play with. The researchers found that 14 of the 16 infants chose the helper over the hinderer.
-Use the binomial distribution to calculate the probability of 14 or more choosing the helper toy if they really had no preference. Show the details of how you calculate this probability by hand.
-Use the binomial distribution to calculate the probability of 14 or more choosing the helper toy if they really had no preference. Show the details of how you calculate this probability by hand.
Unlock Deck
Unlock for access to all 34 flashcards in this deck.
Unlock Deck
k this deck
24
In a study reported in the November 2007 issue of Nature, researchers investigated whether infants take into account an individual's actions towards others in evaluating that individual as appealing or aversive, perhaps laying the foundation for social interaction (Hamlin, Wynn, and Bloom, 2007). In one component of the study, 10-month-old infants were shown a "climber" character (a piece of wood with "google" eyes glued onto it) that could not make it up a hill in two tries. Then they were alternately shown two scenarios for the climber's next try, one where the climber was pushed to the top of the hill by another character ("helper") and one where the climber was pushed back down the hill by another character ("hinderer"). The infant was alternately shown these two scenarios several times. Then the child was presented with both pieces of wood (the helper and the hinderer) and asked to pick one to play with. The researchers found that 14 of the 16 infants chose the helper over the hinderer.
-Explain the relevance of this probability calculation to the research question of whether infants have a preference for the helper toy over the hinderer toy. Also summarize the conclusion that you would draw, and explain your reasoning.
-Explain the relevance of this probability calculation to the research question of whether infants have a preference for the helper toy over the hinderer toy. Also summarize the conclusion that you would draw, and explain your reasoning.
Unlock Deck
Unlock for access to all 34 flashcards in this deck.
Unlock Deck
k this deck
25
Data were collected on the weights for the entire roster of the 2005 Cal Poly football team. Individuals were classified as playing offense, defense, or special teams. Suppose you want to consider these data as representative of all collegiate football players and want to compare the average weight of the players in these three groups.
-Is this an experiment or an observational study?
-Is this an experiment or an observational study?
Unlock Deck
Unlock for access to all 34 flashcards in this deck.
Unlock Deck
k this deck
26
Data were collected on the weights for the entire roster of the 2005 Cal Poly football team. Individuals were classified as playing offense, defense, or special teams. Suppose you want to consider these data as representative of all collegiate football players and want to compare the average weight of the players in these three groups.
-State the alternative hypothesis in this study.
Consider the following ANOVA table.
-State the alternative hypothesis in this study.
Consider the following ANOVA table.
Unlock Deck
Unlock for access to all 34 flashcards in this deck.
Unlock Deck
k this deck
27
Data were collected on the weights for the entire roster of the 2005 Cal Poly football team. Individuals were classified as playing offense, defense, or special teams. Suppose you want to consider these data as representative of all collegiate football players and want to compare the average weight of the players in these three groups.
-Based on this output, how many players were on the Cal Poly team? Explain (briefly) how you know.
-Based on this output, how many players were on the Cal Poly team? Explain (briefly) how you know.
Unlock Deck
Unlock for access to all 34 flashcards in this deck.
Unlock Deck
k this deck
28
Data were collected on the weights for the entire roster of the 2005 Cal Poly football team. Individuals were classified as playing offense, defense, or special teams. Suppose you want to consider these data as representative of all collegiate football players and want to compare the average weight of the players in these three groups.
-Use the output to determine the value of the statistic. Show your calculation.
-Use the output to determine the value of the statistic. Show your calculation.
Unlock Deck
Unlock for access to all 34 flashcards in this deck.
Unlock Deck
k this deck
29
Data were collected on the weights for the entire roster of the 2005 Cal Poly football team. Individuals were classified as playing offense, defense, or special teams. Suppose you want to consider these data as representative of all collegiate football players and want to compare the average weight of the players in these three groups.
-Summarize the conclusion that you would draw from this study, with regard to the question of whether weights tend to differ across these categorizations.
-Summarize the conclusion that you would draw from this study, with regard to the question of whether weights tend to differ across these categorizations.
Unlock Deck
Unlock for access to all 34 flashcards in this deck.
Unlock Deck
k this deck
30
A group of students asked participants from their school to see how many sit-ups they could perform in one minute. Subjects were then randomly assigned to drink either Sobe or Rockstar, two energy drinks. Rockstar is marketed primarily as an energy drink, whereas Sobe is advertised more for taste. Exactly 30 minutes later, the number of sit-ups in one minute was again recorded. The students conjectured that the increase in the number of sit-ups performed would be higher for students drinking Rockstar than for Sobe.
-Is this an experiment or an observational study?
-Is this an experiment or an observational study?
Unlock Deck
Unlock for access to all 34 flashcards in this deck.
Unlock Deck
k this deck
31
A group of students asked participants from their school to see how many sit-ups they could perform in one minute. Subjects were then randomly assigned to drink either Sobe or Rockstar, two energy drinks. Rockstar is marketed primarily as an energy drink, whereas Sobe is advertised more for taste. Exactly 30 minutes later, the number of sit-ups in one minute was again recorded. The students conjectured that the increase in the number of sit-ups performed would be higher for students drinking Rockstar than for Sobe.
-State the null hypothesis in symbols. Also clearly define what the symbols mean in this context. Consider the following ANOVA output:
-State the null hypothesis in symbols. Also clearly define what the symbols mean in this context. Consider the following ANOVA output:
Unlock Deck
Unlock for access to all 34 flashcards in this deck.
Unlock Deck
k this deck
32
A group of students asked participants from their school to see how many sit-ups they could perform in one minute. Subjects were then randomly assigned to drink either Sobe or Rockstar, two energy drinks. Rockstar is marketed primarily as an energy drink, whereas Sobe is advertised more for taste. Exactly 30 minutes later, the number of sit-ups in one minute was again recorded. The students conjectured that the increase in the number of sit-ups performed would be higher for students drinking Rockstar than for Sobe.
-Summarize the conclusion you would draw from this study, with regard to the question of whether the brand of energy drink affects the increase in sit-up performance.
-Summarize the conclusion you would draw from this study, with regard to the question of whether the brand of energy drink affects the increase in sit-up performance.
Unlock Deck
Unlock for access to all 34 flashcards in this deck.
Unlock Deck
k this deck
33
A group of students asked participants from their school to see how many sit-ups they could perform in one minute. Subjects were then randomly assigned to drink either Sobe or Rockstar, two energy drinks. Rockstar is marketed primarily as an energy drink, whereas Sobe is advertised more for taste. Exactly 30 minutes later, the number of sit-ups in one minute was again recorded. The students conjectured that the increase in the number of sit-ups performed would be higher for students drinking Rockstar than for Sobe.
-If you had instead conducted a two-sided -test to compare the two groups, specify the value of the -value you would have obtained.
-If you had instead conducted a two-sided -test to compare the two groups, specify the value of the -value you would have obtained.
Unlock Deck
Unlock for access to all 34 flashcards in this deck.
Unlock Deck
k this deck
34
A group of students asked participants from their school to see how many sit-ups they could perform in one minute. Subjects were then randomly assigned to drink either Sobe or Rockstar, two energy drinks. Rockstar is marketed primarily as an energy drink, whereas Sobe is advertised more for taste. Exactly 30 minutes later, the number of sit-ups in one minute was again recorded. The students conjectured that the increase in the number of sit-ups performed would be higher for students drinking Rockstar than for Sobe.
-There are 19 males but only 12 females in this study. Explain why gender is not necessarily a confounding variable in this study.
-There are 19 males but only 12 females in this study. Explain why gender is not necessarily a confounding variable in this study.
Unlock Deck
Unlock for access to all 34 flashcards in this deck.
Unlock Deck
k this deck
Unlock Deck
Unlock for access to all 34 flashcards in this deck.


