Deck 1: Collecting Data and Drawing Conclusions
Full screen (f)
Question
Question
Question
Question
Question
Question
Question
Question
Question
Question
Question
Question
Question
Question
Question
Question
Question
Question
Question
Question
Question
Question
Question
Question
Question
Question
Question
Question
Question
Question
Question
Question
Question
Question
Question
Question
Question
Question
Question
Question
Question
Question
Question
Question
Question
Question
Question
Question
Question
Question
Question
Question
Consider the following dotplots of (hypothetical) ages for three groups of people:
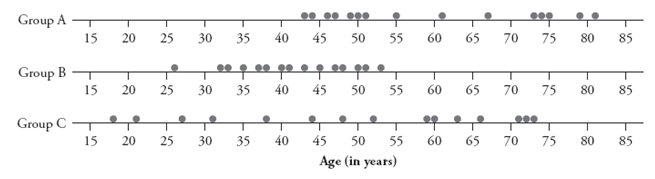 a. Which group tends to have the oldest ages? (No explanation or calculation is needed.)
b. Which group tends to have the youngest ages? (No explanation or calculation is needed.)
c. Which group has the most consistency in ages? (No explanation or calculation is needed.)
d. Which group has the least consistency in ages? (No explanation or calculation is needed.)
a. Which group tends to have the oldest ages? (No explanation or calculation is needed.)b. Which group tends to have the youngest ages? (No explanation or calculation is needed.)
c. Which group has the most consistency in ages? (No explanation or calculation is needed.)
d. Which group has the least consistency in ages? (No explanation or calculation is needed.)
Question
Question
Question
Question
Question
Question
Consider the following dotplots of bowling scores for 15 games by three different bowlers:
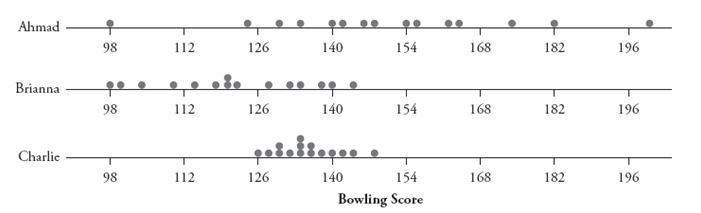 a. Which bowler tends to have the highest scores? (Do not provide explanations or calculations.)
b. Which bowler tends to have the lowest scores? (Do not provide explanations or calculations.)
c. Which bowler has the most consistency in his or her scores? (Do not provide explanations or calculations.)
d. Which bowler has the least consistency in his or her scores? (Do not provide explanations or calculations.)
a. Which bowler tends to have the highest scores? (Do not provide explanations or calculations.)b. Which bowler tends to have the lowest scores? (Do not provide explanations or calculations.)
c. Which bowler has the most consistency in his or her scores? (Do not provide explanations or calculations.)
d. Which bowler has the least consistency in his or her scores? (Do not provide explanations or calculations.)
Question
Question

Unlock Deck
Sign up to unlock the cards in this deck!
Unlock Deck
Unlock Deck
1/60
Play
Full screen (f)
Deck 1: Collecting Data and Drawing Conclusions
1
Suppose for every email message that you receive in the next week, you keep track of
- Whether the message is spam
- Whether the sender is a family member, a friend, or someone else
- Whether the message contains an emoticon (such as a smiley face )
- How many words are in the message
- What day of the week the message was sent
-Which of these variables is quantitative?
- Whether the message is spam
- Whether the sender is a family member, a friend, or someone else
- Whether the message contains an emoticon (such as a smiley face )
- How many words are in the message
- What day of the week the message was sent
-Which of these variables is quantitative?
The quantitative variable is how many words are in the message.
2
Suppose for every email message that you receive in the next week, you keep track of
- Whether the message is spam
- Whether the sender is a family member, a friend, or someone else
- Whether the message contains an emoticon (such as a smiley face )
- How many words are in the message
- What day of the week the message was sent
-How many of these variables are categorical? How many are binary?
Four of these five variables are categorical; two (the ones about spam, emoticon) are binary.
3
Suppose for every email message that you receive in the next week, you keep track of
- Whether the message is spam
- Whether the sender is a family member, a friend, or someone else
- Whether the message contains an emoticon (such as a smiley face )
- How many words are in the message
- What day of the week the message was sent
-What are the observational units in this study?
- Whether the message is spam
- Whether the sender is a family member, a friend, or someone else
- Whether the message contains an emoticon (such as a smiley face )
- How many words are in the message
- What day of the week the message was sent
-What are the observational units in this study?
The observational units are the email messages that you receive next week.
4
Suppose for every email message that you receive in the next week, you keep track of
- Whether the message is spam
- Whether the sender is a family member, a friend, or someone else
- Whether the message contains an emoticon (such as a smiley face )
- How many words are in the message
- What day of the week the message was sent
-State a research question that you could address with these data.
Unlock Deck
Unlock for access to all 60 flashcards in this deck.
Unlock Deck
k this deck
5
Suppose for every email message that you receive in the next week, you keep track of
- Whether the message is spam
- Whether the sender is a family member, a friend, or someone else
- Whether the message contains an emoticon (such as a smiley face )
- How many words are in the message
- What day of the week the message was sent
-Is people who send you a message with an emoticon a legitimate variable in this study? Explain why or why not.
Unlock Deck
Unlock for access to all 60 flashcards in this deck.
Unlock Deck
k this deck
6
In a study reported in the July 6, 2007, issue of the journal Science, researchers studied 396 American college students and kept track of each student's gender and also how many words they spoke in a day. They found that women spoke an average of 16,215 words per day and men an average of 15,669 words per day.
-Identify the observational units in this study.
-Identify the observational units in this study.
Unlock Deck
Unlock for access to all 60 flashcards in this deck.
Unlock Deck
k this deck
7
In a study reported in the July 6, 2007, issue of the journal Science, researchers studied 396 American college students and kept track of each student's gender and also how many words they spoke in a day. They found that women spoke an average of 16,215 words per day and men an average of 15,669 words per day.
-Identify the categorical variable described in this paragraph. (Be sure to state it as a variable.)
-Identify the categorical variable described in this paragraph. (Be sure to state it as a variable.)
Unlock Deck
Unlock for access to all 60 flashcards in this deck.
Unlock Deck
k this deck
8
In a study reported in the July 6, 2007, issue of the journal Science, researchers studied 396 American college students and kept track of each student's gender and also how many words they spoke in a day. They found that women spoke an average of 16,215 words per day and men an average of 15,669 words per day.
-Identify the quantitative variable described in this paragraph. (Be sure to state it as a variable.)
-Identify the quantitative variable described in this paragraph. (Be sure to state it as a variable.)
Unlock Deck
Unlock for access to all 60 flashcards in this deck.
Unlock Deck
k this deck
9
In a study reported in the July 6, 2007, issue of the journal Science, researchers studied 396 American college students and kept track of each student's gender and also how many words they spoke in a day. They found that women spoke an average of 16,215 words per day and men an average of 15,669 words per day.
-Consider a new variable: whether the student spoke at least 10,000 words that day. Is this a legitimate variable to record in this study? Explain why or why not.
-Consider a new variable: whether the student spoke at least 10,000 words that day. Is this a legitimate variable to record in this study? Explain why or why not.
Unlock Deck
Unlock for access to all 60 flashcards in this deck.
Unlock Deck
k this deck
10
In a study reported in the July 6, 2007, issue of the journal Science, researchers studied 396 American college students and kept track of each student's gender and also how many words they spoke in a day. They found that women spoke an average of 16,215 words per day and men an average of 15,669 words per day.
-Specify another variable that could have been recorded about the observational units in this study.
-Specify another variable that could have been recorded about the observational units in this study.
Unlock Deck
Unlock for access to all 60 flashcards in this deck.
Unlock Deck
k this deck
11
You want to compare prices of textbooks, so you ask six friends who are science majors and six friends who are humanities majors to report how much they spent on textbooks this term.
-Which would be appropriate for comparing responses of science and humanities majors - a dotplot or a bar graph? Explain why.
-Which would be appropriate for comparing responses of science and humanities majors - a dotplot or a bar graph? Explain why.
Unlock Deck
Unlock for access to all 60 flashcards in this deck.
Unlock Deck
k this deck
12
You want to compare prices of textbooks, so you ask six friends who are science majors and six friends who are humanities majors to report how much they spent on textbooks this term.
-Sketch what this graph would look like if all science majors spent more than all humanities majors on textbooks.
-Sketch what this graph would look like if all science majors spent more than all humanities majors on textbooks.
Unlock Deck
Unlock for access to all 60 flashcards in this deck.
Unlock Deck
k this deck
13
You want to compare prices of textbooks, so you ask six friends who are science majors and six friends who are humanities majors to report how much they spent on textbooks this term.
-Sketch what this graph would look like if it's not the case that all science majors spent more than all humanities majors, but there is a tendency for science majors to spend more than humanities majors on textbooks.
-Sketch what this graph would look like if it's not the case that all science majors spent more than all humanities majors, but there is a tendency for science majors to spend more than humanities majors on textbooks.
Unlock Deck
Unlock for access to all 60 flashcards in this deck.
Unlock Deck
k this deck
14
You want to compare prices of textbooks, so you ask six friends who are science majors and six friends who are humanities majors to report how much they spent on textbooks this term.
-Sketch what this graph would look like if the two groups spend similar amounts on textbooks on average, but the amounts show much less consistency with humanities majors.
-Sketch what this graph would look like if the two groups spend similar amounts on textbooks on average, but the amounts show much less consistency with humanities majors.
Unlock Deck
Unlock for access to all 60 flashcards in this deck.
Unlock Deck
k this deck
15
You want to compare prices of textbooks, so you ask six friends who are science majors and six friends who are humanities majors to report how much they spent on textbooks this term.
-What is the variable represented on the horizontal axis of these graphs? Be sure to label the horizontal axis (but you do not have to include a scale).
-What is the variable represented on the horizontal axis of these graphs? Be sure to label the horizontal axis (but you do not have to include a scale).
Unlock Deck
Unlock for access to all 60 flashcards in this deck.
Unlock Deck
k this deck
16
In a study reported in the Archives of Pediatric and Adolescent Medicine in October 2002 on treating warts, researchers investigated whether liquid nitrogen cryotherapy ("burning it off") or common duct tape would be a more effective treatment for kids with warts. The researchers found that 22 of 26 patients treated with duct tape saw complete disappearance of their warts, compared to 15 of 25 patients in the cryotherapy group.
-For each group, calculate the proportion of patients whose warts disappeared completely.
-For each group, calculate the proportion of patients whose warts disappeared completely.
Unlock Deck
Unlock for access to all 60 flashcards in this deck.
Unlock Deck
k this deck
17
In a study reported in the Archives of Pediatric and Adolescent Medicine in October 2002 on treating warts, researchers investigated whether liquid nitrogen cryotherapy ("burning it off") or common duct tape would be a more effective treatment for kids with warts. The researchers found that 22 of 26 patients treated with duct tape saw complete disappearance of their warts, compared to 15 of 25 patients in the cryotherapy group.
-Which would be an appropriate graph for comparing responses of these two groups - a dotplot or a bar graph? Explain why.
-Which would be an appropriate graph for comparing responses of these two groups - a dotplot or a bar graph? Explain why.
Unlock Deck
Unlock for access to all 60 flashcards in this deck.
Unlock Deck
k this deck
18
In a study reported in the Archives of Pediatric and Adolescent Medicine in October 2002 on treating warts, researchers investigated whether liquid nitrogen cryotherapy ("burning it off") or common duct tape would be a more effective treatment for kids with warts. The researchers found that 22 of 26 patients treated with duct tape saw complete disappearance of their warts, compared to 15 of 25 patients in the cryotherapy group.
-Draw the appropriate graph to compare the responses of these two groups. Be sure to label the horizontal axis.
-Draw the appropriate graph to compare the responses of these two groups. Be sure to label the horizontal axis.
Unlock Deck
Unlock for access to all 60 flashcards in this deck.
Unlock Deck
k this deck
19
In a study reported in the Archives of Pediatric and Adolescent Medicine in October 2002 on treating warts, researchers investigated whether liquid nitrogen cryotherapy ("burning it off") or common duct tape would be a more effective treatment for kids with warts. The researchers found that 22 of 26 patients treated with duct tape saw complete disappearance of their warts, compared to 15 of 25 patients in the cryotherapy group.
-Comment on what the graph reveals about the comparative effectiveness of these two treatments.
-Comment on what the graph reveals about the comparative effectiveness of these two treatments.
Unlock Deck
Unlock for access to all 60 flashcards in this deck.
Unlock Deck
k this deck
20
You want to investigate whether teenagers in England tend to read more Harry Potter books than teenagers in the United States.
-Identify the populations in this study.
-Identify the populations in this study.
Unlock Deck
Unlock for access to all 60 flashcards in this deck.
Unlock Deck
k this deck
21
You want to investigate whether teenagers in England tend to read more Harry Potter books than teenagers in the United States.
-Identify the explanatory variable, and classify it as categorical or quantitative.
-Identify the explanatory variable, and classify it as categorical or quantitative.
Unlock Deck
Unlock for access to all 60 flashcards in this deck.
Unlock Deck
k this deck
22
You want to investigate whether teenagers in England tend to read more Harry Potter books than teenagers in the United States.
-Identify the response variable, and classify it as categorical or quantitative.
If you read a report that Hospital A has a higher mortality (death) rate than Hospital B when treating heart attack patients, it's possible that the severity of the patient's condition is a confounding variable.
-Identify the response variable, and classify it as categorical or quantitative.
If you read a report that Hospital A has a higher mortality (death) rate than Hospital B when treating heart attack patients, it's possible that the severity of the patient's condition is a confounding variable.
Unlock Deck
Unlock for access to all 60 flashcards in this deck.
Unlock Deck
k this deck
23
You want to investigate whether teenagers in England tend to read more Harry Potter books than teenagers in the United States.
-Describe what it means for patient's condition to be a confounding variable in this context. Be sure to indicate how this potential confounding variable could be related both to the explanatory and the response variable.
-Describe what it means for patient's condition to be a confounding variable in this context. Be sure to indicate how this potential confounding variable could be related both to the explanatory and the response variable.
Unlock Deck
Unlock for access to all 60 flashcards in this deck.
Unlock Deck
k this deck
24
A university wants to know the average yearly salary of its alumni ten years after graduation. It has a list of all alumni who graduated ten years ago and writes to each one, asking for information about annual salary. Suppose that of the alumni respond to this invitation.
-Describe (in words) the parameter of interest.
-Describe (in words) the parameter of interest.
Unlock Deck
Unlock for access to all 60 flashcards in this deck.
Unlock Deck
k this deck
25
A university wants to know the average yearly salary of its alumni ten years after graduation. It has a list of all alumni who graduated ten years ago and writes to each one, asking for information about annual salary. Suppose that of the alumni respond to this invitation.
-Describe (in words) the statistic of interest.
-Describe (in words) the statistic of interest.
Unlock Deck
Unlock for access to all 60 flashcards in this deck.
Unlock Deck
k this deck
26
A university wants to know the average yearly salary of its alumni ten years after graduation. It has a list of all alumni who graduated ten years ago and writes to each one, asking for information about annual salary. Suppose that of the alumni respond to this invitation.
-Would you consider the sample to be representative of the population, or is this sampling method biased? Explain.
A national survey of 12- to 17 -year-olds conducted in 2011 found that teens who spend time on a social networking site in a typical day are three times more likely to use alcohol than teens who do not spend time on a social networking site in a typical day. Headlines proclaimed that social networking causes drinking. A blogger responded that this conclusion is not justified and that age is a confounding variable.
Unlock Deck
Unlock for access to all 60 flashcards in this deck.
Unlock Deck
k this deck
27
A university wants to know the average yearly salary of its alumni ten years after graduation. It has a list of all alumni who graduated ten years ago and writes to each one, asking for information about annual salary. Suppose that of the alumni respond to this invitation.
-Describe what it means for age to be a confounding variable in this context. Be sure to indicate how this potential confounding variable could be related both to the explanatory and the response variables.
-Describe what it means for age to be a confounding variable in this context. Be sure to indicate how this potential confounding variable could be related both to the explanatory and the response variables.
Unlock Deck
Unlock for access to all 60 flashcards in this deck.
Unlock Deck
k this deck
28
An organization called The Knot Inc. hosts two popular wedding websites and conducted a national (U.S.) survey of nearly 19,000 couples who were married in the year 2010 . The organization reported that the average amount spent on a wedding, excluding honeymoon, was and that of the ceremonies were held outdoors.
-Identify the population of interest in this survey.
-Identify the population of interest in this survey.
Unlock Deck
Unlock for access to all 60 flashcards in this deck.
Unlock Deck
k this deck
29
An organization called The Knot Inc. hosts two popular wedding websites and conducted a national (U.S.) survey of nearly 19,000 couples who were married in the year 2010 . The organization reported that the average amount spent on a wedding, excluding honeymoon, was and that of the ceremonies were held outdoors.
-Identify the sample and the sample size.
-Identify the sample and the sample size.
Unlock Deck
Unlock for access to all 60 flashcards in this deck.
Unlock Deck
k this deck
30
An organization called The Knot Inc. hosts two popular wedding websites and conducted a national (U.S.) survey of nearly 19,000 couples who were married in the year 2010 . The organization reported that the average amount spent on a wedding, excluding honeymoon, was and that of the ceremonies were held outdoors.
-Are the values listed parameters or statistics? Explain.
-Are the values listed parameters or statistics? Explain.
Unlock Deck
Unlock for access to all 60 flashcards in this deck.
Unlock Deck
k this deck
31
An organization called The Knot Inc. hosts two popular wedding websites and conducted a national (U.S.) survey of nearly 19,000 couples who were married in the year 2010 . The organization reported that the average amount spent on a wedding, excluding honeymoon, was and that of the ceremonies were held outdoors.
-Identify (in words) the parameters of interest in this study.
-Identify (in words) the parameters of interest in this study.
Unlock Deck
Unlock for access to all 60 flashcards in this deck.
Unlock Deck
k this deck
32
An organization called The Knot Inc. hosts two popular wedding websites and conducted a national (U.S.) survey of nearly 19,000 couples who were married in the year 2010 . The organization reported that the average amount spent on a wedding, excluding honeymoon, was and that of the ceremonies were held outdoors.
-The press release describing this survey did not say how the 19,000 couples were selected. Explain why knowing this missing information is important.
-The press release describing this survey did not say how the 19,000 couples were selected. Explain why knowing this missing information is important.
Unlock Deck
Unlock for access to all 60 flashcards in this deck.
Unlock Deck
k this deck
33
Suppose you want to estimate the average waiting time at the coffee bar on campus. You decide to choose five days of the semester at random and then visit the coffee bar at four randomly chosen times on those days. You will record the waiting time for the customers who you find in line at those times and then calculate the average of these times.
-Identify the population in this study.
-Identify the population in this study.
Unlock Deck
Unlock for access to all 60 flashcards in this deck.
Unlock Deck
k this deck
34
Suppose you want to estimate the average waiting time at the coffee bar on campus. You decide to choose five days of the semester at random and then visit the coffee bar at four randomly chosen times on those days. You will record the waiting time for the customers who you find in line at those times and then calculate the average of these times.
-Identify the sample in this study.
-Identify the sample in this study.
Unlock Deck
Unlock for access to all 60 flashcards in this deck.
Unlock Deck
k this deck
35
Suppose you want to estimate the average waiting time at the coffee bar on campus. You decide to choose five days of the semester at random and then visit the coffee bar at four randomly chosen times on those days. You will record the waiting time for the customers who you find in line at those times and then calculate the average of these times.
-Is the number that you are trying to estimate a parameter or a statistic? Explain.
-Is the number that you are trying to estimate a parameter or a statistic? Explain.
Unlock Deck
Unlock for access to all 60 flashcards in this deck.
Unlock Deck
k this deck
36
Suppose you want to estimate the average waiting time at the coffee bar on campus. You decide to choose five days of the semester at random and then visit the coffee bar at four randomly chosen times on those days. You will record the waiting time for the customers who you find in line at those times and then calculate the average of these times.
-Is the average that you calculate a parameter or a statistic? Explain.
-Is the average that you calculate a parameter or a statistic? Explain.
Unlock Deck
Unlock for access to all 60 flashcards in this deck.
Unlock Deck
k this deck
37
Suppose you want to estimate the average waiting time at the coffee bar on campus. You decide to choose five days of the semester at random and then visit the coffee bar at four randomly chosen times on those days. You will record the waiting time for the customers who you find in line at those times and then calculate the average of these times.
-Even though your sampling process involves multiple stages of randomness, it is still biased. Explain why and in which direction.
-Even though your sampling process involves multiple stages of randomness, it is still biased. Explain why and in which direction.
Unlock Deck
Unlock for access to all 60 flashcards in this deck.
Unlock Deck
k this deck
38
In a study published in the July 4, 2007, issue of the Journal of the American Medical Association, researchers investigated whether small doses of dark chocolate can reduce blood pressure for people who suffer from mild cases of high blood pressure. They recruited 44 German adults who were otherwise healthy except for mild cases of high blood pressure. These subjects were randomly assigned to either a dark chocolate group or a white chocolate group, and all subjects were instructed to eat one square portion of a chocolate bar (containing about 30 calories) every day for 18 weeks. They were also instructed not to eat any other cocoa products. Each subject had his/her blood pressure recorded at the beginning and end of the study, with the reduction in blood pressure calculated. It turned out that those in the dark chocolate group had an average reduction of about 3 points in systolic blood pressure, compared to a 0 point reduction on average in the white chocolate group.
-Identify the explanatory variable in this study, and classify it as categorical or quantitative.
-Identify the explanatory variable in this study, and classify it as categorical or quantitative.
Unlock Deck
Unlock for access to all 60 flashcards in this deck.
Unlock Deck
k this deck
39
In a study published in the July 4, 2007, issue of the Journal of the American Medical Association, researchers investigated whether small doses of dark chocolate can reduce blood pressure for people who suffer from mild cases of high blood pressure. They recruited 44 German adults who were otherwise healthy except for mild cases of high blood pressure. These subjects were randomly assigned to either a dark chocolate group or a white chocolate group, and all subjects were instructed to eat one square portion of a chocolate bar (containing about 30 calories) every day for 18 weeks. They were also instructed not to eat any other cocoa products. Each subject had his/her blood pressure recorded at the beginning and end of the study, with the reduction in blood pressure calculated. It turned out that those in the dark chocolate group had an average reduction of about 3 points in systolic blood pressure, compared to a 0 point reduction on average in the white chocolate group.
-Identify the response variable in this study, and classify it as categorical or quantitative.
-Identify the response variable in this study, and classify it as categorical or quantitative.
Unlock Deck
Unlock for access to all 60 flashcards in this deck.
Unlock Deck
k this deck
40
In a study published in the July 4, 2007, issue of the Journal of the American Medical Association, researchers investigated whether small doses of dark chocolate can reduce blood pressure for people who suffer from mild cases of high blood pressure. They recruited 44 German adults who were otherwise healthy except for mild cases of high blood pressure. These subjects were randomly assigned to either a dark chocolate group or a white chocolate group, and all subjects were instructed to eat one square portion of a chocolate bar (containing about 30 calories) every day for 18 weeks. They were also instructed not to eat any other cocoa products. Each subject had his/her blood pressure recorded at the beginning and end of the study, with the reduction in blood pressure calculated. It turned out that those in the dark chocolate group had an average reduction of about 3 points in systolic blood pressure, compared to a 0 point reduction on average in the white chocolate group.
-Is this an experiment or an observational study? Explain how you know.
-Is this an experiment or an observational study? Explain how you know.
Unlock Deck
Unlock for access to all 60 flashcards in this deck.
Unlock Deck
k this deck
41
In a study published in the July 4, 2007, issue of the Journal of the American Medical Association, researchers investigated whether small doses of dark chocolate can reduce blood pressure for people who suffer from mild cases of high blood pressure. They recruited 44 German adults who were otherwise healthy except for mild cases of high blood pressure. These subjects were randomly assigned to either a dark chocolate group or a white chocolate group, and all subjects were instructed to eat one square portion of a chocolate bar (containing about 30 calories) every day for 18 weeks. They were also instructed not to eat any other cocoa products. Each subject had his/her blood pressure recorded at the beginning and end of the study, with the reduction in blood pressure calculated. It turned out that those in the dark chocolate group had an average reduction of about 3 points in systolic blood pressure, compared to a 0 point reduction on average in the white chocolate group.
-Does the design of the study (the way the data were collected) allow for concluding that eating dark chocolate causes a reduction in blood pressure? Explain briefly.
-Does the design of the study (the way the data were collected) allow for concluding that eating dark chocolate causes a reduction in blood pressure? Explain briefly.
Unlock Deck
Unlock for access to all 60 flashcards in this deck.
Unlock Deck
k this deck
42
In a study published in the July 4, 2007, issue of the Journal of the American Medical Association, researchers investigated whether small doses of dark chocolate can reduce blood pressure for people who suffer from mild cases of high blood pressure. They recruited 44 German adults who were otherwise healthy except for mild cases of high blood pressure. These subjects were randomly assigned to either a dark chocolate group or a white chocolate group, and all subjects were instructed to eat one square portion of a chocolate bar (containing about 30 calories) every day for 18 weeks. They were also instructed not to eat any other cocoa products. Each subject had his/her blood pressure recorded at the beginning and end of the study, with the reduction in blood pressure calculated. It turned out that those in the dark chocolate group had an average reduction of about 3 points in systolic blood pressure, compared to a 0 point reduction on average in the white chocolate group.
-Does the design of the study (the way the data were collected) allow for generalizing the results to the population of all people who suffer from a mild case of high blood pressure? Explain briefly.
-Does the design of the study (the way the data were collected) allow for generalizing the results to the population of all people who suffer from a mild case of high blood pressure? Explain briefly.
Unlock Deck
Unlock for access to all 60 flashcards in this deck.
Unlock Deck
k this deck
43
Classify each of the following statements as true or false:
-Random assignment guarantees that all variables will be perfectly balanced out between the treatment groups.
-Random assignment guarantees that all variables will be perfectly balanced out between the treatment groups.
Unlock Deck
Unlock for access to all 60 flashcards in this deck.
Unlock Deck
k this deck
44
Classify each of the following statements as true or false:
-Random assignment is not applicable for experiments with several treatment groups to be compared.
-Random assignment is not applicable for experiments with several treatment groups to be compared.
Unlock Deck
Unlock for access to all 60 flashcards in this deck.
Unlock Deck
k this deck
45
Classify each of the following statements as true or false:
-Random assignment tends to balance out variables that a researcher might not think about in advance, as well as variables that she does think about in advance.
-Random assignment tends to balance out variables that a researcher might not think about in advance, as well as variables that she does think about in advance.
Unlock Deck
Unlock for access to all 60 flashcards in this deck.
Unlock Deck
k this deck
46
Classify each of the following statements as true or false:
-When subjects are randomly assigned in an experiment that compares a new treatment to a standard treatment, the subjects receiving the new treatment are guaranteed to perform better than subjects receiving the standard treatment.
-When subjects are randomly assigned in an experiment that compares a new treatment to a standard treatment, the subjects receiving the new treatment are guaranteed to perform better than subjects receiving the standard treatment.
Unlock Deck
Unlock for access to all 60 flashcards in this deck.
Unlock Deck
k this deck
47
Classify each of the following statements as true or false:
-Double-blind experiments are only necessary when the experimenters cannot be trusted to act ethically.
-Double-blind experiments are only necessary when the experimenters cannot be trusted to act ethically.
Unlock Deck
Unlock for access to all 60 flashcards in this deck.
Unlock Deck
k this deck
48
Suppose that the observational units in a study are the 23 campuses in the California State University system (e.g., Cal Poly, Long Beach State, Fresno State, Cal State Northridge, . . .).
a. State a quantitative variable that you could record on these observational units.
b. State a categorical variable that you could record on these observational units.
a. State a quantitative variable that you could record on these observational units.
b. State a categorical variable that you could record on these observational units.
Unlock Deck
Unlock for access to all 60 flashcards in this deck.
Unlock Deck
k this deck
49
In the August 12, 2007, issue of Parade magazine (which comes with the Sunday newspaper for millions of Americans), readers were asked to go online and vote on the question: Should the drinking age be lowered? The results were published in the October 7 issue: More than 14,000 readers voted, and 48% said "yes."
a. Is this number (48%) a parameter or a statistic? Explain (in one sentence or less) how you know.
b. Do you trust this sample to be representative of the population of all American adults? Explain.
c. How would you respond to someone who says, "Even if this had been a random sample, there's no way that a sample of 14,000 people could be representative of an entire country of 300 million people."
Unlock Deck
Unlock for access to all 60 flashcards in this deck.
Unlock Deck
k this deck
50
Another article in the October 7, 2007, issue of Parade magazine claimed that one-third of all homicides in the United States remain unsolved.
a. Is this number (one-third) a parameter or a statistic? (No explanation is needed.)
b. What are the observational units?
c. If a researcher studies a random sample of 150 homicides from around the United Sates, will he/she necessarily find that one-third of them remain unsolved? Explain briefly.
a. Is this number (one-third) a parameter or a statistic? (No explanation is needed.)
b. What are the observational units?
c. If a researcher studies a random sample of 150 homicides from around the United Sates, will he/she necessarily find that one-third of them remain unsolved? Explain briefly.
Unlock Deck
Unlock for access to all 60 flashcards in this deck.
Unlock Deck
k this deck
51
In a recent study, researchers followed 104,000 U.S. veterans who had served in the armed forces and a comparison group of 216,000 nonveterans. Over a period of 12 years, they found that 197 veterans and 311 nonveterans committed suicide.
a. Identify the explanatory and response variables in this study.
Explanatory:
Response:
b. Is this an observational study or an experiment? Explain briefly.
c. Calculate the proportion who committed suicide in the veterans group. Then do the same for the nonveterans group.
Veterans group:
Nonveterans group:
d. The study also found that overweight people were much less likely to commit suicide than underweight people. Would you conclude that weight gain causes a lower risk of suicide? Explain briefly.
e. Following the point about overweight people being less likely to commit suicide, the researchers said that smoking may be a confounding variable, however. Explain what this statement means in the context of this issue.
Unlock Deck
Unlock for access to all 60 flashcards in this deck.
Unlock Deck
k this deck
52
Consider the following dotplots of (hypothetical) ages for three groups of people:
a. Which group tends to have the oldest ages? (No explanation or calculation is needed.)
b. Which group tends to have the youngest ages? (No explanation or calculation is needed.)
c. Which group has the most consistency in ages? (No explanation or calculation is needed.)
d. Which group has the least consistency in ages? (No explanation or calculation is needed.)
a. Which group tends to have the oldest ages? (No explanation or calculation is needed.)b. Which group tends to have the youngest ages? (No explanation or calculation is needed.)
c. Which group has the most consistency in ages? (No explanation or calculation is needed.)
d. Which group has the least consistency in ages? (No explanation or calculation is needed.)
Unlock Deck
Unlock for access to all 60 flashcards in this deck.
Unlock Deck
k this deck
53
Suppose an instructor wants to investigate whether statistics students who are taught using an online format learn just as much as students taught using a face-to-face format.
a. Identify the explanatory variable in this study.
b. Suggest a reasonable response variable for this study.
c. Suppose students are given the option of signing up for their choice of the online or face-to-face format class. Then, if the online students perform significantly better than the face-to-face students, could the instructor reasonably conclude that the online format has beneficial effects? Explain the reasoning behind your answer.
Unlock Deck
Unlock for access to all 60 flashcards in this deck.
Unlock Deck
k this deck
54
An April 9, 2002, news release from the National Institutes of Health describes a study that investigated whether the herb St. John's wort is effective for treating depression. An excerpt from this press release follows:
An extract of the herb St. John's wort was no more effective for treating major depression of moderate severity than placebo, according to research published in the April 10 issue of the Journal of the American Medical Association. The randomized, double-blind trial compared the use of a standardized extract of St. John's wort (Hypericum perforatum) to a placebo for treating major depression of moderate severity. The multi-site trial, involving 340 participants, also compared the FDA-approved antidepressant drug sertraline to placebo as a way to measure how sensitive the trial was to detecting antidepressant effects.
a. Is this an experiment or an observational study? (Do not bother to explain.)
b. Explain what it means for this study to be "double-blind" and also why this is an important component of the study design.
Unlock Deck
Unlock for access to all 60 flashcards in this deck.
Unlock Deck
k this deck
55
In a study reported in the September 24, 2007, issue of the Archives of Internal Medicine, German researchers described a study conducted on 1162 German adults suffering from chronic low-back pain. These subjects were randomly assigned to one of three groups: real acupuncture, sham acupuncture, and conventional therapy. Researchers found that of subjects in the real acupuncture group improved, compared to in the sham acupuncture group and in the conventional therapy group.
a. Identify the observational units in this study.
b. Identify the explanatory variable. Also classify it as categorical or quantitative.
If it is categorical, indicate whether it is binary.
c. Identify the response variable.
d. Is this an observational study or an experiment? Explain briefly.
e. Did this study make use of random assignment or random sampling, or both, or neither? Explain briefly.
f. Construct an appropriate graph to display the results.
g. Comment on what the graph reveals.
h. If the researchers find that the difference in improvement percentages between the real acupuncture group and the conventional therapy group is significant, would it be appropriate to conclude that real acupuncture causes a higher improvement rate than conventional therapy? Explain.
Unlock Deck
Unlock for access to all 60 flashcards in this deck.
Unlock Deck
k this deck
56
Suppose the observational units in a study are customers arriving at a post office. For each of the following, identify whether it is a variable that can be recorded on these observational units. (No explanations are required; simply answer "yes" or "no.")
a. Gender
b. Total time spent waiting in line and being served
c. Number of customers who arrive before noon
d. Total amount of money spent
e. Whether men or women spend more money on average
a. Gender
b. Total time spent waiting in line and being served
c. Number of customers who arrive before noon
d. Total amount of money spent
e. Whether men or women spend more money on average
Unlock Deck
Unlock for access to all 60 flashcards in this deck.
Unlock Deck
k this deck
57
On June 4-24, 2007, the Gallup Poll asked a nationwide sample of adult Americans about their attitude toward interracial marriage. Of the 2388 adults interviewed, said that they approve of marriage between whites and blacks.
a. Is this number a parameter or a statistic? Explain briefly.
b. What kind of graph would be appropriate for displaying the results of this survey - a dotplot or a bar graph? Explain briefly. (Do not create the graph.)
c. Identify the sample size in this survey.
d. How would you respond to a person who argued that this sample cannot possibly be representative of the population of all American adults, because there are more than 200 million American adults but fewer than 3000 in this sample?
Unlock Deck
Unlock for access to all 60 flashcards in this deck.
Unlock Deck
k this deck
58
Consider the following dotplots of bowling scores for 15 games by three different bowlers:
a. Which bowler tends to have the highest scores? (Do not provide explanations or calculations.)
b. Which bowler tends to have the lowest scores? (Do not provide explanations or calculations.)
c. Which bowler has the most consistency in his or her scores? (Do not provide explanations or calculations.)
d. Which bowler has the least consistency in his or her scores? (Do not provide explanations or calculations.)
a. Which bowler tends to have the highest scores? (Do not provide explanations or calculations.)b. Which bowler tends to have the lowest scores? (Do not provide explanations or calculations.)
c. Which bowler has the most consistency in his or her scores? (Do not provide explanations or calculations.)
d. Which bowler has the least consistency in his or her scores? (Do not provide explanations or calculations.)
Unlock Deck
Unlock for access to all 60 flashcards in this deck.
Unlock Deck
k this deck
59
Studies conducted at elementary schools have shown that children with longer feet tend to score higher on reading tests than children with shorter feet.
a. Are these studies observational or experimental? Explain briefly.
b. Suggest a potential confounding variable that could explain the observed phenomenon that children with longer feet tend to score higher on reading tests than children with shorter feet. Describe what makes this a confounding variable.
Unlock Deck
Unlock for access to all 60 flashcards in this deck.
Unlock Deck
k this deck
60
a. Does taking a larger sample help to reduce the bias of a sampling method? Explain.
b. Does taking a larger sample help to reduce the sampling variability of a sampling method? Explain.
b. Does taking a larger sample help to reduce the sampling variability of a sampling method? Explain.
Unlock Deck
Unlock for access to all 60 flashcards in this deck.
Unlock Deck
k this deck
Unlock Deck
Unlock for access to all 60 flashcards in this deck.


