Deck 5: Variability and Standard Z Scores
Full screen (f)
Question
Question
Question
Question
The scores of two groups of chimpanzees on a special problem-solving task are as follows. Group 1: 2, 7, 5, 2, 3, 8, 3. Group 2: 5, 9, 8, 5, 3. (a)Compute the standard deviations of both sets of scores, directly from deviation scores. Carry any remainders to two decimal places. (b)Compute the standard deviations of both sets of scores, using the raw score formula to obtain

Question
Question
Question
Professor Jones gives a quiz in her statistics course and obtains the following 20 scores:

Calculate the variance and standard deviation by
(a) the deviation-score method, and
(b) the raw-score method.
Calculate the variance and standard deviation by
(a) the deviation-score method, and
(b) the raw-score method.
Question
Question
Question
Question
Question
Q is equal to
A) ( )/2
)/2
B) ( )/
)/

C) ( )/2
)/2
D) the median
A) (
)/2B) (
)/C) (
)/2D) the median
Question
For the frequency distribution of GPA's of a group of freshmen, 
and

. 75% of the freshmen's GPA's fall below
A) 3.25
B) 3.35
C) 3.45
D) can't tell unless the distribution is symmetric
and
. 75% of the freshmen's GPA's fall below
A) 3.25
B) 3.35
C) 3.45
D) can't tell unless the distribution is symmetric
Question
Question

is
A) the average deviation
B) the standard deviation
C) the variance
D) none of the above
Question
For the two scores 4 and 8, 
is
A) 8
B) 4
C) 0
D) -2
is
A) 8
B) 4
C) 0
D) -2
Question
The standard deviation of a population is
A)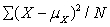
B)
C)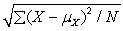
D)
A)
B)
C)
D)
Question
Question
We calculate SX to be -6. We know
A)
B) = 6
= 6
C) we have made an error in computation
D)
A)
B)
= 6C) we have made an error in computation
D)
Question
For the two scores 1 and 5, compute SX
A) 2
B) 22
C)
D)
A) 2
B) 22
C)
D)
Question
Question
Question
Question
Question
Question
Question
Question
Question
Question
Question
Question
Question
Question
Question
Question
In a normal distribution, the interscore distance would be
A) greatest for the interval
B) greatest for the interval
C) greatest for the interval
D) the same for all of the above intervals
A) greatest for the interval
B) greatest for the interval
C) greatest for the interval
D) the same for all of the above intervals
Question

Unlock Deck
Sign up to unlock the cards in this deck!
Unlock Deck
Unlock Deck
1/37
Play
Full screen (f)
Deck 5: Variability and Standard Z Scores
1
For a distribution of math test scores,
This tells us something about 50% of the cases. Which 50%? What does it tell us about that 50%?
This tells us something about 50% of the cases. Which 50%? What does it tell us about that 50%?
The middle 50%; their scores range over (2) (8.3) = 16.6 points; we do not know the values of and because the distribution may be skewed.
2
Each score in a sample of five raw scores is converted to a deviation score. The following are the values for four of the deviation scores: -4, +2, +3, -6. What is the value of the remaining deviation score?
+5
3
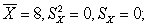
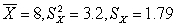
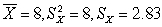
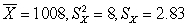
Consider the following sets of scores: (1) 8, 8, 8, 8, 8;(2)6, 6, 8, 10, 10; (3)4, 6, 8, 10, 12; (4)1004, 1006, 1008, 1010, 1012.
(a)Upon inspection, which show(s) the least variability? The most variability?
(b)For each set, compute the mean, and compute the variance and standard deviation directly from deviation scores.
(c)What do the results of (b) suggest about the relationship between central tendency and variability?
(a)Upon inspection, which show(s) the least variability? The most variability?
(b)For each set, compute the mean, and compute the variance and standard deviation directly from deviation scores.
(c)What do the results of (b) suggest about the relationship between central tendency and variability?
(a) (1) shows the least; (3) and (4) show the most
(b)for (1)
for (2)
for (3)
for (4)
(c)samples may have the same mean but show different degrees of variability or samples may have very different means but show the same degree of variability.
(b)for (1)
for (2)
for (3)
for (4)
(c)samples may have the same mean but show different degrees of variability or samples may have very different means but show the same degree of variability.
4
The scores of two groups of chimpanzees on a special problem-solving task are as follows. Group 1: 2, 7, 5, 2, 3, 8, 3. Group 2: 5, 9, 8, 5, 3. (a)Compute the standard deviations of both sets of scores, directly from deviation scores. Carry any remainders to two decimal places. (b)Compute the standard deviations of both sets of scores, using the raw score formula to obtain
Unlock Deck
Unlock for access to all 37 flashcards in this deck.
Unlock Deck
k this deck
5
(a) After the mean, median, range, Q, and SX of a set of 40 scores are computed, the researcher finds that the highest score is in error and should be even higher. Which of the above statistics will be affected by the correction? Explain.(b)He also learns that one of the scores just below the median should be slightly lower. Which of the above statistics would be affected by this correction? Explain.
Unlock Deck
Unlock for access to all 37 flashcards in this deck.
Unlock Deck
k this deck
6
The mean for a large group of ninth graders on a standard social studies test is 87.2. Jane obtains a score of 93.(a)How would you describe her performance?(b)Suppose SX = 25.1. Now how would you describe her performance?(c)Suppose SX = 2.1. Now how would you describe her performance?
Unlock Deck
Unlock for access to all 37 flashcards in this deck.
Unlock Deck
k this deck
7
Professor Jones gives a quiz in her statistics course and obtains the following 20 scores:
Calculate the variance and standard deviation by
(a) the deviation-score method, and
(b) the raw-score method.
Calculate the variance and standard deviation by
(a) the deviation-score method, and
(b) the raw-score method.
Unlock Deck
Unlock for access to all 37 flashcards in this deck.
Unlock Deck
k this deck
8
For the distribution of scores on a test of introversion-extroversion administered to a large group of college students, and
(high scores are in the direction of introversion). For each of the following students, convert the raw score to a z score:
(a)John, 88;
(b)George, 96;
(c)Mary, 72;
(d)Alfred, 64.
(high scores are in the direction of introversion). For each of the following students, convert the raw score to a z score:
(a)John, 88;
(b)George, 96;
(c)Mary, 72;
(d)Alfred, 64.
Unlock Deck
Unlock for access to all 37 flashcards in this deck.
Unlock Deck
k this deck
9
Use the basic definition of z scores to convert each of the following z scores back to introversion-extroversion scores from the distribution of Problem 8 (round answers to the nearest whole number):
(a)0;
(b)-2.10;
(c)1.82;
(d)-.75;
(e).25;
(f)3.10.
(a)0;
(b)-2.10;
(c)1.82;
(d)-.75;
(e).25;
(f)3.10.
Unlock Deck
Unlock for access to all 37 flashcards in this deck.
Unlock Deck
k this deck
10
If the lowest score is 51 and the highest score is 92, the range is
A) 41
B) 42
C) 40.5
D) 41.1
A) 41
B) 42
C) 40.5
D) 41.1
Unlock Deck
Unlock for access to all 37 flashcards in this deck.
Unlock Deck
k this deck
11
Q1 means the same as
A) P75
B) P50
C) P25
D) P
A) P75
B) P50
C) P25
D) P
Unlock Deck
Unlock for access to all 37 flashcards in this deck.
Unlock Deck
k this deck
12
Q is equal to
A) ( )/2
B) ( )/
C) ( )/2
D) the median
A) (
)/2B) (
)/C) (
)/2D) the median
Unlock Deck
Unlock for access to all 37 flashcards in this deck.
Unlock Deck
k this deck
13
For the frequency distribution of GPA's of a group of freshmen,
and
. 75% of the freshmen's GPA's fall below
A) 3.25
B) 3.35
C) 3.45
D) can't tell unless the distribution is symmetric
and
. 75% of the freshmen's GPA's fall below
A) 3.25
B) 3.35
C) 3.45
D) can't tell unless the distribution is symmetric
Unlock Deck
Unlock for access to all 37 flashcards in this deck.
Unlock Deck
k this deck
14
The values of three out of a sample of four deviation scores are: -5, +2, and -3. The value of the fourth deviation score is
A) 0
B) +6
C) +3
D) +8
A) 0
B) +6
C) +3
D) +8
Unlock Deck
Unlock for access to all 37 flashcards in this deck.
Unlock Deck
k this deck
15
is
A) the average deviation
B) the standard deviation
C) the variance
D) none of the above
Unlock Deck
Unlock for access to all 37 flashcards in this deck.
Unlock Deck
k this deck
16
For the two scores 4 and 8,
is
A) 8
B) 4
C) 0
D) -2
is
A) 8
B) 4
C) 0
D) -2
Unlock Deck
Unlock for access to all 37 flashcards in this deck.
Unlock Deck
k this deck
17
The standard deviation of a population is
A)
B)
C)
D)
A)
B)
C)
D)
Unlock Deck
Unlock for access to all 37 flashcards in this deck.
Unlock Deck
k this deck
18
For the two scores 2 and 4, ( X)2
A) 2
B) 6
C) 20
D) 36
A) 2
B) 6
C) 20
D) 36
Unlock Deck
Unlock for access to all 37 flashcards in this deck.
Unlock Deck
k this deck
19
We calculate SX to be -6. We know
A)
B) = 6
C) we have made an error in computation
D)
A)
B)
= 6C) we have made an error in computation
D)
Unlock Deck
Unlock for access to all 37 flashcards in this deck.
Unlock Deck
k this deck
20
For the two scores 1 and 5, compute SX
A) 2
B) 22
C)
D)
A) 2
B) 22
C)
D)
Unlock Deck
Unlock for access to all 37 flashcards in this deck.
Unlock Deck
k this deck
21
The mean score on a quiz is 7 and the standard deviation is 0. This shows that
A) the range is 7
B) the distribution is normal
C) the variance is also 7
D) all persons scored 7
A) the range is 7
B) the distribution is normal
C) the variance is also 7
D) all persons scored 7
Unlock Deck
Unlock for access to all 37 flashcards in this deck.
Unlock Deck
k this deck
22
The semi-interquartile range is most closely related to the
A) mean
B) median
C) mode
D) midrange
A) mean
B) median
C) mode
D) midrange
Unlock Deck
Unlock for access to all 37 flashcards in this deck.
Unlock Deck
k this deck
23
Which measure is not dependent on the value of each score?
A) standard deviation
B) semi-interquartile range
C) deviation scores formula for the variance
D) raw scores formula for the variance
A) standard deviation
B) semi-interquartile range
C) deviation scores formula for the variance
D) raw scores formula for the variance
Unlock Deck
Unlock for access to all 37 flashcards in this deck.
Unlock Deck
k this deck
24
The sum of squares of the deviation scores is least when deviations are taken from
A) the mean
B) the median
C) the lowest score
D) one or the other of the above measures depending on the shape of the distribution
A) the mean
B) the median
C) the lowest score
D) one or the other of the above measures depending on the shape of the distribution
Unlock Deck
Unlock for access to all 37 flashcards in this deck.
Unlock Deck
k this deck
25
The properties of the standard deviation are most closely related to those of the
A) mean
B) median
C) mode
D) mean or median, depending on the shape of the distribution
A) mean
B) median
C) mode
D) mean or median, depending on the shape of the distribution
Unlock Deck
Unlock for access to all 37 flashcards in this deck.
Unlock Deck
k this deck
26
Eliminating some scores from a point near the mean will
A) not affect the standard deviation
B) increase the standard deviation
C) decrease the standard deviation
D) affect the standard deviation in an unpredictable way
A) not affect the standard deviation
B) increase the standard deviation
C) decrease the standard deviation
D) affect the standard deviation in an unpredictable way
Unlock Deck
Unlock for access to all 37 flashcards in this deck.
Unlock Deck
k this deck
27
If one score in a distribution is changed to another value, it is certain that
A) the range has changed
B) the semi-interquartile range has changed
C) the standard deviation has changed
D) both standard deviation and semi-interquartile range have changed
A) the range has changed
B) the semi-interquartile range has changed
C) the standard deviation has changed
D) both standard deviation and semi-interquartile range have changed
Unlock Deck
Unlock for access to all 37 flashcards in this deck.
Unlock Deck
k this deck
28
A set of scores has a standard deviation of 20. If 4 points were added to each score, the standard deviation would be
A) 36
B) 24
C) 22
D) 20
A) 36
B) 24
C) 22
D) 20
Unlock Deck
Unlock for access to all 37 flashcards in this deck.
Unlock Deck
k this deck
29
A z score in a given distribution is -2. If the mean of the distribution is 40, the equivalent raw score
A) is 38
B) is 20
C) lies above 40
D) cannot be determined without further information
A) is 38
B) is 20
C) lies above 40
D) cannot be determined without further information
Unlock Deck
Unlock for access to all 37 flashcards in this deck.
Unlock Deck
k this deck
30
A distribution has a mean of 60 and a standard deviation of 8. For a score of 72, the equivalent z score
A) is +12
B) is -12
C) is +1.5
D) is -1.5
A) is +12
B) is -12
C) is +1.5
D) is -1.5
Unlock Deck
Unlock for access to all 37 flashcards in this deck.
Unlock Deck
k this deck
31
A z score in a given distribution is -.5. If the mean of this distribution is 130 and the standard deviation is 20, the equivalent raw score in that distribution is
A) 129.5
B) 120
C) 110
D) 140
A) 129.5
B) 120
C) 110
D) 140
Unlock Deck
Unlock for access to all 37 flashcards in this deck.
Unlock Deck
k this deck
32
The mean of a set of z scores is
A) 1
B) 0
C) indeterminate
D) the same as the mean of raw scores from which the z scores were derived
A) 1
B) 0
C) indeterminate
D) the same as the mean of raw scores from which the z scores were derived
Unlock Deck
Unlock for access to all 37 flashcards in this deck.
Unlock Deck
k this deck
33
Three scores in a distribution are 20, 25, and 35. The z-score equivalents of the first two are, respectively, -1 and -1/2. The z-score equivalent of the third score
A) is 0
B) is -1/2
C) is +1
D) cannot be determined from the above information
A) is 0
B) is -1/2
C) is +1
D) cannot be determined from the above information
Unlock Deck
Unlock for access to all 37 flashcards in this deck.
Unlock Deck
k this deck
34
If a set of raw scores is positively skewed, the set of z scores derived from them will be
A) positively skewed
B) very close to a normal distribution, but slightly positively skewed
C) symmetrical, but not normal
D) normally distributed
A) positively skewed
B) very close to a normal distribution, but slightly positively skewed
C) symmetrical, but not normal
D) normally distributed
Unlock Deck
Unlock for access to all 37 flashcards in this deck.
Unlock Deck
k this deck
35
The major disadvantage of percentile ranks as a kind of derived score is that
A) they are not readily intelligible to the public
B) they cannot be determined accurately
C) they are suitable only when distribution is normal
D) changes in raw scores are not necessarily reflected by proportionate changes in percentile ranks
A) they are not readily intelligible to the public
B) they cannot be determined accurately
C) they are suitable only when distribution is normal
D) changes in raw scores are not necessarily reflected by proportionate changes in percentile ranks
Unlock Deck
Unlock for access to all 37 flashcards in this deck.
Unlock Deck
k this deck
36
In a normal distribution, the interscore distance would be
A) greatest for the interval
B) greatest for the interval
C) greatest for the interval
D) the same for all of the above intervals
A) greatest for the interval
B) greatest for the interval
C) greatest for the interval
D) the same for all of the above intervals
Unlock Deck
Unlock for access to all 37 flashcards in this deck.
Unlock Deck
k this deck
37
z scores from two different score distributions are comparable only if
A) the means and standard deviations are equal
B) the numbers of cases are approximately the same
C) the reference groups are equivalent
D) all of the above
A) the means and standard deviations are equal
B) the numbers of cases are approximately the same
C) the reference groups are equivalent
D) all of the above
Unlock Deck
Unlock for access to all 37 flashcards in this deck.
Unlock Deck
k this deck
Unlock Deck
Unlock for access to all 37 flashcards in this deck.


