Deck 54: Populations
Full screen (f)
Question
Question
Question
Question
Question
Question
Question
Question
Question
Question
Question
Question
Question
Question
Question
Question
Question
Question
Question
Question
Question
Question
Question
Question
Question
Question
Question
Question
Refer to the equations shown. 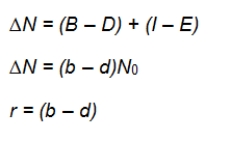 A starting population has 150 animals.During the year, 50 animals are born and 30 die.Ten animals immigrate into the population, and 5 emigrate.At the end of the year, what is the per capita growth rate for this population?
A) r = 0.13
B) r = 0.33
C) ∆N = 20
D) ∆N = 25
E) ∆N = 50
A starting population has 150 animals.During the year, 50 animals are born and 30 die.Ten animals immigrate into the population, and 5 emigrate.At the end of the year, what is the per capita growth rate for this population?A) r = 0.13
B) r = 0.33
C) ∆N = 20
D) ∆N = 25
E) ∆N = 50
Question
Question
Question
Question
Question
Question
Question
Refer to the equations shown.  A starting population has 150 animals.During the year, 50 animals are born and 30 die.Ten animals immigrate into the population, and 5 emigrate.Which represents the change in population size at the end of the year?
A) r = 0.13
B) r = 0.33
C) ∆N = 20
D) ∆N = 25
E) ∆N = 50
A starting population has 150 animals.During the year, 50 animals are born and 30 die.Ten animals immigrate into the population, and 5 emigrate.Which represents the change in population size at the end of the year?A) r = 0.13
B) r = 0.33
C) ∆N = 20
D) ∆N = 25
E) ∆N = 50
Question
Question
Question
Question
Question
Question
Question
Question
Question
Question
Question
Refer to the graph below. 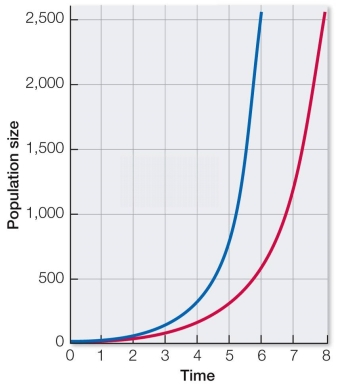 In the graph shown, what factor causes the difference in placement between the left and right growth curves?
A) The left curve has a greater per capita growth rate, or r.
B) The right curve has a greater per capita growth rate, or r.
C) The left curve has a larger starting population, or N0.
D) The right curve has a larger starting population, or N0.
E) The left curve changes by a constant number, the right by a constant proportion.
In the graph shown, what factor causes the difference in placement between the left and right growth curves?A) The left curve has a greater per capita growth rate, or r.
B) The right curve has a greater per capita growth rate, or r.
C) The left curve has a larger starting population, or N0.
D) The right curve has a larger starting population, or N0.
E) The left curve changes by a constant number, the right by a constant proportion.
Question
In the logistic population growth curve shown here, the rate of growth is greatest at which point? 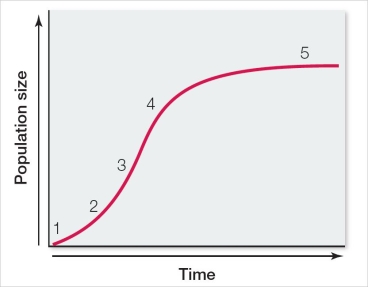
A) 1
B) 2
C) 3
D) 4
E) 5
A) 1
B) 2
C) 3
D) 4
E) 5
Question
Question
Question
Question
Refer to the graph below. 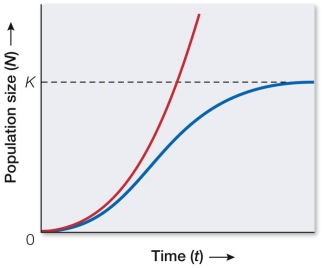 The size of a deer population in an enclosed, protected area was measured over several years and found to be following the red (left) growth curve shown.After several years of drought, its population size more closely followed the blue (right) curve.What factor probably caused the change in the deer's population growth?
A) Emigration
B) Immigration
C) Genetic alterations
D) Food or water limitations
E) A flood or hurricane
The size of a deer population in an enclosed, protected area was measured over several years and found to be following the red (left) growth curve shown.After several years of drought, its population size more closely followed the blue (right) curve.What factor probably caused the change in the deer's population growth?A) Emigration
B) Immigration
C) Genetic alterations
D) Food or water limitations
E) A flood or hurricane
Question
Question
Consider the logistic growth equation shown: 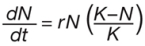 If the value for
  in this equation increased, the graph would change by
A) leveling off at a lower population size.
B) leveling off at a higher population size.
C) crashing to a population size near zero.
D) returning to an exponential curve.
E) changing from an exponential to a linear curve.
If the value for in this equation increased, the graph would change byA) leveling off at a lower population size.
B) leveling off at a higher population size.
C) crashing to a population size near zero.
D) returning to an exponential curve.
E) changing from an exponential to a linear curve.
Question
Question
Question
Question
Question
Question
Question
Question
Question
Question
Question
Refer to the table below, which shows hypothetical data for a cohort of robins. 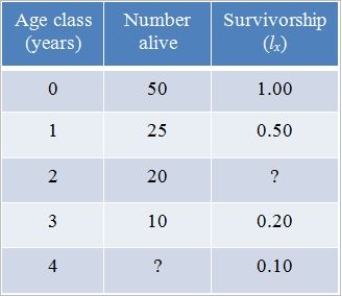 The best explanation of survivorship (lx) is that it is
A) the number of organisms remaining alive at any given time.
B) the number of organisms dying within any given time period.
C) the percentage of organisms dying within any given time period.
D) calculated by dividing Nx by N0, or the number of individuals surviving by the starting number.
E) calculated by dividing N0 by Nx, or the starting number of individuals by the number surviving.
The best explanation of survivorship (lx) is that it isA) the number of organisms remaining alive at any given time.
B) the number of organisms dying within any given time period.
C) the percentage of organisms dying within any given time period.
D) calculated by dividing Nx by N0, or the number of individuals surviving by the starting number.
E) calculated by dividing N0 by Nx, or the starting number of individuals by the number surviving.
Question
Question
Question
Question
Refer to the graph shown.  The cactus finch has high mortality rates during the juvenile stage, an adult stage with low mortality rates, and an "old age" with high mortality rates.This life history would result in a survivorship curve that is
A) most like curve A.
B) most like curve B.
C) most like curve C.
D) a combination of curves A and B.
E) a combination of curves A and C.
The cactus finch has high mortality rates during the juvenile stage, an adult stage with low mortality rates, and an "old age" with high mortality rates.This life history would result in a survivorship curve that isA) most like curve A.
B) most like curve B.
C) most like curve C.
D) a combination of curves A and B.
E) a combination of curves A and C.
Question
Question
Question
Question
Refer to the table below, which shows hypothetical data for a cohort of robins.  What is the survivorship value for the age class of 2 years?
A) 0.50
B) 0.40
C) 0.30
D) 0.20
E) 0.10
What is the survivorship value for the age class of 2 years?A) 0.50
B) 0.40
C) 0.30
D) 0.20
E) 0.10
Question
Question
Question
Question
Refer to the table below, which shows hypothetical data for a cohort of robins.  For the age class of 4 years, how many robins are alive?
A) 8
B) 7
C) 5
D) 4
E) 2
For the age class of 4 years, how many robins are alive?A) 8
B) 7
C) 5
D) 4
E) 2
Question
Question
Question
Refer to the graph shown. 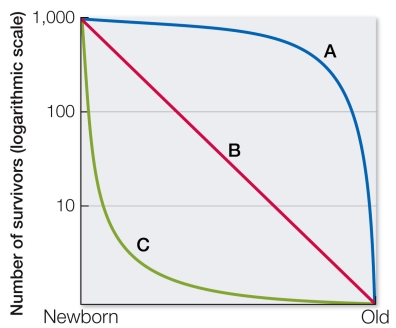 A species shows a survivorship curve similar to curve C.A biologist viewing this curve can deduce that this species likely has which characteristic?
A) Large size
B) Long life span
C) Maternal care
D) High mortality rate of young
E) Constant risk of mortality through life
A species shows a survivorship curve similar to curve C.A biologist viewing this curve can deduce that this species likely has which characteristic?A) Large size
B) Long life span
C) Maternal care
D) High mortality rate of young
E) Constant risk of mortality through life
Question

Unlock Deck
Sign up to unlock the cards in this deck!
Unlock Deck
Unlock Deck
1/259
Play
Full screen (f)
Deck 54: Populations
1
A dog has a very large population of intestinal roundworms.As the population of roundworms increases, the parasites begin to produce fewer eggs.This is an example of population control by
A) dispersal.
B) predation.
C) parasitism.
D) a biological interaction.
E) the physical environment.
A) dispersal.
B) predation.
C) parasitism.
D) a biological interaction.
E) the physical environment.
D
2
In the early twentieth century, a plant species was widely distributed in large grasslands across the Midwest.As agriculture advanced, the grasslands were fragmented, forming much smaller habitats.Because the plant's seeds were dispersed by wind, many of the smaller fragments were able to receive seeds from nearby fragments.The change in the spatial distribution of this species can be described in all of these ways except as a
A) decrease in geographic range.
B) decrease in metapopulation size.
C) change from random to clumped dispersion.
D) change from a population to a metapopulation.
E) change from a metapopulation to a population.
A) decrease in geographic range.
B) decrease in metapopulation size.
C) change from random to clumped dispersion.
D) change from a population to a metapopulation.
E) change from a metapopulation to a population.
E
3
Which pattern of survivorship is most likely for an organism such as the sea urchin, which produces large numbers of very small offspring and provides no parental care?
A) Survivorship is high early in life and declines slowly.
B) The probability of death is equally low throughout the life span.
C) The probability of death is equally high throughout the potential life span.
D) Most offspring survive for most of their potential life span and die at the same time.
E) Young individuals have a high probability of death; older individuals have a relatively low probability of death.
E
4
Kangaroos of the genus Macropus live in specific regions of Australia.M.giganteus is found on the eastern one-third of the continent, M.fuliginosus in the southern and western part, and M.rufus in the semiarid interior.This suggests that the range of these kangaroos is controlled by
A) dispersal.
B) predation.
C) biological interactions.
D) the physical environment.
E) distribution along a temperature gradient.
A) dispersal.
B) predation.
C) biological interactions.
D) the physical environment.
E) distribution along a temperature gradient.
Unlock Deck
Unlock for access to all 259 flashcards in this deck.
Unlock Deck
k this deck
5
If 2,400 oak trees are counted in a 6 km × 2 km rectangular patch of land, the density of the oak trees is
A) 24 per square km.
B) 48 per square km.
C) 96 per square km.
D) 120 per square km.
E) 200 per square km.
A) 24 per square km.
B) 48 per square km.
C) 96 per square km.
D) 120 per square km.
E) 200 per square km.
Unlock Deck
Unlock for access to all 259 flashcards in this deck.
Unlock Deck
k this deck
6
If 400 robins are found in a ten-hectare plot, the density of robins in that plot is
A) 1 robin/ha.
B) 4 robins/ha.
C) 40 robins/ha.
D) 400 robins/ha.
E) 4,000 robins/ha.
A) 1 robin/ha.
B) 4 robins/ha.
C) 40 robins/ha.
D) 400 robins/ha.
E) 4,000 robins/ha.
Unlock Deck
Unlock for access to all 259 flashcards in this deck.
Unlock Deck
k this deck
7
In which animal population would migration be least effective or necessary as an adaptation for maintaining a population throughout the year?
A) Salmon, which live in salt water, but breed in fresh water
B) Blackbirds, which easily adapt to new food sources, regardless of weather
C) Elephants on the African savanna, where there is a pronounced dry season
D) Hummingbirds, who cannot survive in cold weather and migrate south in the winter
E) Humpback whales in the Pacific Ocean, where seasonal food supplies vary by latitude
Unlock Deck
Unlock for access to all 259 flashcards in this deck.
Unlock Deck
k this deck
8
The human population growth rate has slowed since reaching its maximum rate in the 1960s.A decrease in which factor is most likely responsible for slowing the growth rate?
A) Food supply
B) Base population
C) Average level of health care
D) Number of children per female
E) Average age of women having their first child
A) Food supply
B) Base population
C) Average level of health care
D) Number of children per female
E) Average age of women having their first child
Unlock Deck
Unlock for access to all 259 flashcards in this deck.
Unlock Deck
k this deck
9
The patterns and processes of changes in populations are called population
A) structure.
B) density.
C) dynamics.
D) dispersion.
E) demography.
A) structure.
B) density.
C) dynamics.
D) dispersion.
E) demography.
Unlock Deck
Unlock for access to all 259 flashcards in this deck.
Unlock Deck
k this deck
10
Sponges, sea anemones, corals, and other marine organisms are sessile as adults but have planktonic (floating) larval stages.As the oceans warm due to climate change, many of these organisms are increasingly unable to live in the ranges they now occupy.How might their larval stages enable them to survive climate change?
A) They may be less subject to predation.
B) They may be able to disperse to new locations.
C) They may interact more readily with other species.
D) They may be able to adapt to higher temperatures.
E) They may be less affected by the physical environment.
A) They may be less subject to predation.
B) They may be able to disperse to new locations.
C) They may interact more readily with other species.
D) They may be able to adapt to higher temperatures.
E) They may be less affected by the physical environment.
Unlock Deck
Unlock for access to all 259 flashcards in this deck.
Unlock Deck
k this deck
11
Since Malthus's time, the carrying capacity of the human population has greatly increased, but most ecologists do not think this increase can be sustained.If the human carrying capacity levels off or declines, this change will most likely occur because humans have
A) used up all the living space available on Earth.
B) seriously degraded Earth's life-support systems.
C) reached a genetic maximum in population growth rate.
D) lost the intellectual ability to make technological advances.
E) failed to provide housing and health care for the existing population.
A) used up all the living space available on Earth.
B) seriously degraded Earth's life-support systems.
C) reached a genetic maximum in population growth rate.
D) lost the intellectual ability to make technological advances.
E) failed to provide housing and health care for the existing population.
Unlock Deck
Unlock for access to all 259 flashcards in this deck.
Unlock Deck
k this deck
12
The peregrine falcon is widely distributed over all continents except Antarctica, due to its ability to survive a wide range of climatic conditions.This statement describes the peregrine falcon's
A) habitat.
B) home range.
C) population.
D) metapopulation.
E) geographic range.
A) habitat.
B) home range.
C) population.
D) metapopulation.
E) geographic range.
Unlock Deck
Unlock for access to all 259 flashcards in this deck.
Unlock Deck
k this deck
13
The sage plant secretes toxins that kill off surrounding plants in a circle around each plant.This results in which type of dispersion pattern?
A) Dense
B) Regular
C) Random
D) Clumped
E) Irregular
A) Dense
B) Regular
C) Random
D) Clumped
E) Irregular
Unlock Deck
Unlock for access to all 259 flashcards in this deck.
Unlock Deck
k this deck
14
In terms of relative size, what is the most likely relationship between populations, metapopulations, and geographic ranges of a single species of organism?
A) Geographic range > metapopulation > population
B) Geographic range > population > metapopulation
C) Metapopulation > population > geographic range
D) Metapopulation > geographic range > population
E) Population > metapopulation > geographic range
A) Geographic range > metapopulation > population
B) Geographic range > population > metapopulation
C) Metapopulation > population > geographic range
D) Metapopulation > geographic range > population
E) Population > metapopulation > geographic range
Unlock Deck
Unlock for access to all 259 flashcards in this deck.
Unlock Deck
k this deck
15
When white pine seeds are blown by wind into an open field, young pine trees grow wherever the seeds land.As the pine trees get larger, they begin crowding each other and competing for space and light.Many pine trees die, and those that live are each located at a distance from their nearest neighbors.Which statement is the best description of the dispersion pattern of a white pine population over time?
A) The trees will be clumped at all ages.
B) The trees will be regularly spaced at all ages.
C) The trees will be clumped when young and randomly spaced when older.
D) The trees will be randomly spaced when young and clumped when older.
E) The trees will be randomly spaced when young and regularly spaced when older.
Unlock Deck
Unlock for access to all 259 flashcards in this deck.
Unlock Deck
k this deck
16
The Rocky Mountain Parnassian butterfly lives on separate meadows in Alberta, Canada.Individuals live in a single meadow but can fly among meadows.This arrangement would best be classified as a
A) niche.
B) territory.
C) population.
D) metapopulation.
E) geographic range.
A) niche.
B) territory.
C) population.
D) metapopulation.
E) geographic range.
Unlock Deck
Unlock for access to all 259 flashcards in this deck.
Unlock Deck
k this deck
17
Thousands of grasshoppers of the same species live on a single plot of land.They feed on plants in the fields and gardens and reproduce within their own group.This group of grasshoppers represents a
A) guild.
B) class.
C) population.
D) community.
E) metapopulation.
A) guild.
B) class.
C) population.
D) community.
E) metapopulation.
Unlock Deck
Unlock for access to all 259 flashcards in this deck.
Unlock Deck
k this deck
18
A group of scientists is studying a population, or pod, of dolphins.They gather information about individual dolphins to determine population characteristics, migration patterns, and other factors.They identify each dolphin by photographing its dorsal fins, providing a photo-ID similar to a fingerprint.Scientists in this study are using which method of studying populations?
A) Quadrat
B) Transect
C) Full census
D) Mark-recapture
E) Fingerprint analysis
A) Quadrat
B) Transect
C) Full census
D) Mark-recapture
E) Fingerprint analysis
Unlock Deck
Unlock for access to all 259 flashcards in this deck.
Unlock Deck
k this deck
19
In the spring, each male redwing blackbird establishes a breeding territory and prevents other males in its population from entering.The distribution pattern of these male redwing blackbirds is
A) random.
B) regular.
C) clumped.
D) irregular.
E) logistic.
A) random.
B) regular.
C) clumped.
D) irregular.
E) logistic.
Unlock Deck
Unlock for access to all 259 flashcards in this deck.
Unlock Deck
k this deck
20
For which of the following populations would biologists most likely use number of individuals per unit of volume, rather than number of individuals per unit of area, in measuring population density?
A) Guppies in a lake
B) Pine trees in a forest
C) Squirrels on a campus
D) Mice in a patch of grassland
E) Oak seedlings in a backyard
A) Guppies in a lake
B) Pine trees in a forest
C) Squirrels on a campus
D) Mice in a patch of grassland
E) Oak seedlings in a backyard
Unlock Deck
Unlock for access to all 259 flashcards in this deck.
Unlock Deck
k this deck
21
In a study of the population density of apple maggot flies, 150 flies are captured and marked in the first sampling.Two days later, 300 flies are captured, 15 of which have marks.Based on these results, the estimated number of apple maggot flies in this population would be
A) 300.
B) 600.
C) 1,500.
D) 3,000.
E) 6,000.
A) 300.
B) 600.
C) 1,500.
D) 3,000.
E) 6,000.
Unlock Deck
Unlock for access to all 259 flashcards in this deck.
Unlock Deck
k this deck
22
Under ideal conditions, the per capita birth rate in a population of isopods is 0.12 offspring per day, and the per capita death rate is 0.04 offspring per day.If there are 700 individuals in the population, the population will produce how many isopods per day?
A) 8
B) 28
C) 56
D) 70
E) 84
A) 8
B) 28
C) 56
D) 70
E) 84
Unlock Deck
Unlock for access to all 259 flashcards in this deck.
Unlock Deck
k this deck
23
For a population of bears, birth and death rates are equal during one year.According to the population growth equation, any change in population size will be determined by
A) the birth rate only.
B) the emigration rate only.
C) the immigration rate only.
D) the birth and immigration rates.
E) the immigration and emigration rates.
A) the birth rate only.
B) the emigration rate only.
C) the immigration rate only.
D) the birth and immigration rates.
E) the immigration and emigration rates.
Unlock Deck
Unlock for access to all 259 flashcards in this deck.
Unlock Deck
k this deck
24
Two populations are growing exponentially.At the end of one year, Population X has added 10 individuals and its final Nt = 1,010, while Population Y has added 100 individuals, and its final Nt = 10,100.What factor is likely different in the two populations?
A) Population X has a higher growth rate.
B) Population Y has a higher growth rate.
C) Population X has a higher starting population size.
D) Population Y has a higher starting population size.
E) Population Y has both a higher growth rate and a higher starting population size.
A) Population X has a higher growth rate.
B) Population Y has a higher growth rate.
C) Population X has a higher starting population size.
D) Population Y has a higher starting population size.
E) Population Y has both a higher growth rate and a higher starting population size.
Unlock Deck
Unlock for access to all 259 flashcards in this deck.
Unlock Deck
k this deck
25
At the beginning of 2017, a song sparrow population had 131 members.In the previous year, 21 birds were born and 32 birds died.Also in the previous year, 5 birds immigrated into the population and 9 birds emigrated from it.Which solution to the population growth equation, Nt = N0 + (B - D) + (I - E), is correct for this set of data?
A) Nt = 131 + (21 - 5) + (32 - 9) Nt = 170
B) Nt = 131 + (32 - 5) + (21 - 9) Nt = 170
C) 131 = N0 + (21 - 32) + (5 - 9) N0 = 146
D) Nt = 131 + (21 - 32) + (5 - 9) Nt = 116
E) 131 = N0 + (21 - 5) + (32 - 9) N0 = 92
A) Nt = 131 + (21 - 5) + (32 - 9) Nt = 170
B) Nt = 131 + (32 - 5) + (21 - 9) Nt = 170
C) 131 = N0 + (21 - 32) + (5 - 9) N0 = 146
D) Nt = 131 + (21 - 32) + (5 - 9) Nt = 116
E) 131 = N0 + (21 - 5) + (32 - 9) N0 = 92
Unlock Deck
Unlock for access to all 259 flashcards in this deck.
Unlock Deck
k this deck
26
Which change in the demographics of the United States is least likely to have an effect on the national rate of population growth?
A) The increasing average age of first-time mothers
B) The tendency of individual women to have fewer children
C) The increasing incidence of multiple births (twins and triplets)
D) The increased likelihood of women having children with different fathers
E) The tendency of infertile women to use in vitro fertilization to get pregnant
Unlock Deck
Unlock for access to all 259 flashcards in this deck.
Unlock Deck
k this deck
27
At the beginning of May, 259 butterflies are found in a certain locality.During the month, 45 butterflies emigrate, 10 die, and 67 immigrate into the area.No butterflies hatch.What is the population size at the end of the month?
A) 192
B) 249
C) 271
D) 281
E) 346
A) 192
B) 249
C) 271
D) 281
E) 346
Unlock Deck
Unlock for access to all 259 flashcards in this deck.
Unlock Deck
k this deck
28
Refer to the equations shown. A starting population has 150 animals.During the year, 50 animals are born and 30 die.Ten animals immigrate into the population, and 5 emigrate.At the end of the year, what is the per capita growth rate for this population?
A) r = 0.13
B) r = 0.33
C) ∆N = 20
D) ∆N = 25
E) ∆N = 50
A starting population has 150 animals.During the year, 50 animals are born and 30 die.Ten animals immigrate into the population, and 5 emigrate.At the end of the year, what is the per capita growth rate for this population?A) r = 0.13
B) r = 0.33
C) ∆N = 20
D) ∆N = 25
E) ∆N = 50
Unlock Deck
Unlock for access to all 259 flashcards in this deck.
Unlock Deck
k this deck
29
The mark-recapture method of estimating population size is most appropriate for use in populations that are
A) sessile.
B) mobile.
C) prey species.
D) predator species.
E) oceanic species.
A) sessile.
B) mobile.
C) prey species.
D) predator species.
E) oceanic species.
Unlock Deck
Unlock for access to all 259 flashcards in this deck.
Unlock Deck
k this deck
30
In a study of the population density of bullfrogs in a lake, 25 frogs are captured and marked in the first sampling.Five days later, 30 frogs are captured, 10 of which have marks.Based on these results, the estimated number of bullfrogs in this population is
A) 40.
B) 55.
C) 65.
D) 75.
E) 250.
A) 40.
B) 55.
C) 65.
D) 75.
E) 250.
Unlock Deck
Unlock for access to all 259 flashcards in this deck.
Unlock Deck
k this deck
31
A laboratory population of fruit flies in ideal environmental conditions begins with 100 flies and quickly increases to 124 flies.What is the value of r for this time period?
A) 0.024
B) 0.24
C) 2.4
D) 24
E) 124
A) 0.024
B) 0.24
C) 2.4
D) 24
E) 124
Unlock Deck
Unlock for access to all 259 flashcards in this deck.
Unlock Deck
k this deck
32
A population grows exponentially from a starting number of 100 individuals, with per capita monthly growth rate (r) equal to 0.2.What will be the sizes of the population at the end of each of the next three months?
A) 102, 104, 106
B) 102, 112, 122
C) 120, 140, 160
D) 120, 144, 173
E) 200, 400, 800
A) 102, 104, 106
B) 102, 112, 122
C) 120, 140, 160
D) 120, 144, 173
E) 200, 400, 800
Unlock Deck
Unlock for access to all 259 flashcards in this deck.
Unlock Deck
k this deck
33
A gardener decides to estimate the population of cabbage butterflies in her garden.She captures and marks 80 butterflies with a dot of red nail polish.She sets traps, and over the next three weeks captures 250 butterflies.Of these, 50 have red dots.What is the estimated population of cabbage butterflies in this garden?
A) 250
B) 300
C) 330
D) 400
E) 4,000
A) 250
B) 300
C) 330
D) 400
E) 4,000
Unlock Deck
Unlock for access to all 259 flashcards in this deck.
Unlock Deck
k this deck
34
Eighty-one pocket gophers were present in Maddox Field at the start of 2015.During that year, 24 individuals were born and 19 died.Twelve individuals immigrated, and 10 emigrated.How many pocket gophers were present in Maddox Field at the start of 2016?
A) 76
B) 81
C) 86
D) 88
E) 146
A) 76
B) 81
C) 86
D) 88
E) 146
Unlock Deck
Unlock for access to all 259 flashcards in this deck.
Unlock Deck
k this deck
35
Refer to the equations shown. A starting population has 150 animals.During the year, 50 animals are born and 30 die.Ten animals immigrate into the population, and 5 emigrate.Which represents the change in population size at the end of the year?
A) r = 0.13
B) r = 0.33
C) ∆N = 20
D) ∆N = 25
E) ∆N = 50
A starting population has 150 animals.During the year, 50 animals are born and 30 die.Ten animals immigrate into the population, and 5 emigrate.Which represents the change in population size at the end of the year?A) r = 0.13
B) r = 0.33
C) ∆N = 20
D) ∆N = 25
E) ∆N = 50
Unlock Deck
Unlock for access to all 259 flashcards in this deck.
Unlock Deck
k this deck
36
The quadrat method of estimating population size would likely be most appropriate for a population of
A) frogs in a lake.
B) mice in a field.
C) warblers in a forest.
D) plankton in a pond.
E) dandelions in a lawn.
A) frogs in a lake.
B) mice in a field.
C) warblers in a forest.
D) plankton in a pond.
E) dandelions in a lawn.
Unlock Deck
Unlock for access to all 259 flashcards in this deck.
Unlock Deck
k this deck
37
If the birth rate is 0.05 and the death rate is 0.02, the per capita growth rate (r) in a population (assuming that there is no immigration or emigration) is
A) -0.03.
B) 0.02.
C) 0.03.
D) 0.05.
E) 0.07.
A) -0.03.
B) 0.02.
C) 0.03.
D) 0.05.
E) 0.07.
Unlock Deck
Unlock for access to all 259 flashcards in this deck.
Unlock Deck
k this deck
38
Researchers are beginning a study of a field mouse population.To determine the best procedures to use for the mark-recapture method, they try different traps, baits, marking methods, and time intervals between first and second captures.In the first five trials, they have calculated these estimates of population size: 96, 172, 169, 168, and 174 mice.Which trial condition might account for the low estimate of 96 mice in the first trial?
A) Marked mice avoided being captured a second time.
B) Marked mice were unable to feed as well as unmarked mice.
C) Predators targeted the marked mice more than the unmarked mice.
D) The second capture took place before marked mice had completely mixed in.
E) Many mice were able to enter and leave traps without being captured.
Unlock Deck
Unlock for access to all 259 flashcards in this deck.
Unlock Deck
k this deck
39
Which condition would not bias an estimate made from a mark-recapture study?
A) Marked individuals' preference for traps
B) Movement of individuals away from the study site
C) Free mixing of marked and unmarked individuals
D) Inability of trappers to capture marked individuals
E) Greater susceptibility of marked individuals to predation
A) Marked individuals' preference for traps
B) Movement of individuals away from the study site
C) Free mixing of marked and unmarked individuals
D) Inability of trappers to capture marked individuals
E) Greater susceptibility of marked individuals to predation
Unlock Deck
Unlock for access to all 259 flashcards in this deck.
Unlock Deck
k this deck
40
If the birth rate is 0.07 and the death rate is 0.14, then the per capita growth rate (r) in a population (assuming that there is no immigration or emigration) is
A) -0.14.
B) -0.07.
C) 0.07.
D) 0.14.
E) 0.21.
A) -0.14.
B) -0.07.
C) 0.07.
D) 0.14.
E) 0.21.
Unlock Deck
Unlock for access to all 259 flashcards in this deck.
Unlock Deck
k this deck
41
Which situation is an example of density-independent population regulation?
A) An early cold spell kills 80 percent of the sparrows in a particular area.
B) When lemmings are abundant, arctic foxes switch their primary diet from mice to lemmings.
C) Lemming predators search widely for places where lemmings are abundant and concentrate their hunting in those areas.
D) A contagious disease sweeps through a dense population of squirrels but leaves a less-dense population relatively untouched.
E) An outbreak of an insect species depletes their food supply; the next generation of insects is underfed and produces few offspring.
Unlock Deck
Unlock for access to all 259 flashcards in this deck.
Unlock Deck
k this deck
42
A young hen is removed from an uncrowded cage and placed in a small space with many other hens.Which factor is most likely to increase in the hen's new environment?
A) Life span
B) Availability of food
C) Number of eggs laid
D) Risk of exposure to pathogens
E) Protection from extreme weather
A) Life span
B) Availability of food
C) Number of eggs laid
D) Risk of exposure to pathogens
E) Protection from extreme weather
Unlock Deck
Unlock for access to all 259 flashcards in this deck.
Unlock Deck
k this deck
43
In a goldfish population, the fitness of the population is greater (that is, survival rate is higher) when the school of goldfish is larger.This is evidence of a(n)
A) Allee effect, in which larger numbers attract more predators.
B) Allee effect, in which larger numbers enable better group protection.
C) density-dependent effect, in which larger numbers result in greatly limited resources.
D) density-dependent effect, in which goldfish are responding to interspecific competition.
E) density-independent effect, in which goldfish are responding to an environmental factor.
Unlock Deck
Unlock for access to all 259 flashcards in this deck.
Unlock Deck
k this deck
44
Which assumption is not made in the development of the logistic growth equation?
A) Resources in the environment are limited.
B) Each individual depresses population growth equally.
C) Each individual produces equal effects throughout its life cycle.
D) An individual exerts its effects on resources immediately at birth.
E) There is a substantial time lag between gathering resources and reproduction.
Unlock Deck
Unlock for access to all 259 flashcards in this deck.
Unlock Deck
k this deck
45
When the per capita growth rate of a population is zero , the population is
A) stable.
B) extinct.
C) increasing.
D) decreasing.
E) endangered.
A) stable.
B) extinct.
C) increasing.
D) decreasing.
E) endangered.
Unlock Deck
Unlock for access to all 259 flashcards in this deck.
Unlock Deck
k this deck
46
Refer to the graph below. In the graph shown, what factor causes the difference in placement between the left and right growth curves?
A) The left curve has a greater per capita growth rate, or r.
B) The right curve has a greater per capita growth rate, or r.
C) The left curve has a larger starting population, or N0.
D) The right curve has a larger starting population, or N0.
E) The left curve changes by a constant number, the right by a constant proportion.
In the graph shown, what factor causes the difference in placement between the left and right growth curves?A) The left curve has a greater per capita growth rate, or r.
B) The right curve has a greater per capita growth rate, or r.
C) The left curve has a larger starting population, or N0.
D) The right curve has a larger starting population, or N0.
E) The left curve changes by a constant number, the right by a constant proportion.
Unlock Deck
Unlock for access to all 259 flashcards in this deck.
Unlock Deck
k this deck
47
In the logistic population growth curve shown here, the rate of growth is greatest at which point?
A) 1
B) 2
C) 3
D) 4
E) 5
A) 1
B) 2
C) 3
D) 4
E) 5
Unlock Deck
Unlock for access to all 259 flashcards in this deck.
Unlock Deck
k this deck
48
Refer to the paragraph below.
The African wild dog is highly endangered as a result of habitat fragmentation, hunting pressure, and contagious diseases contracted from domestic dogs as humans encroach on the wild dogs' habitat.Hunting, breeding, and pup and adult survival depend on a large pack size, in which individuals cooperate and help one another.This is particularly important because the dogs are relatively small.Historically, the average pack size was about 60 animals; today it ranges from 10 to 20.
According to the Allee effect, what is the likely effect on the population of this much smaller pack size?
A) Positive, because smaller numbers will decrease competition
B) Positive, because there will be fewer dogs to contract diseases
C) Neutral, because the effects on population size come from outside
D) Negative, because the remaining packs will fit into smaller areas
E) Negative, because fewer individuals will result in less pack cooperation
Unlock Deck
Unlock for access to all 259 flashcards in this deck.
Unlock Deck
k this deck
49
Climate change is altering many aspects of current populations, including the ability to live in their usual habitats; the availability of food, water, and other resources; and even rates of reproduction.The primary type of limitation in this case is
A) density-dependent, because resources are limited.
B) density-dependent, because reproduction is affected.
C) density-dependent, because climate effects are dependent on population size.
D) density-independent, because climate effects are independent of population size.
E) density-independent, because climate affects some populations more than others.
Unlock Deck
Unlock for access to all 259 flashcards in this deck.
Unlock Deck
k this deck
50
All of the populations described below would be expected to be growing at or near their maximum rate except
A) rats introduced to a mammal-free Pacific island where thousands of breeding birds provide food.
B) Burmese pythons introduced to the Florida Everglades, where they have no predators.
C) deer in areas where wolves, their main predator, have been made locally extinct.
D) grizzly bears in an area of Alaska where they have lived historically and food availability is stable.
E) poisonous brown tree snakes introduced to the island of Guam, where they have no predators or competitors.
Unlock Deck
Unlock for access to all 259 flashcards in this deck.
Unlock Deck
k this deck
51
Refer to the graph below. The size of a deer population in an enclosed, protected area was measured over several years and found to be following the red (left) growth curve shown.After several years of drought, its population size more closely followed the blue (right) curve.What factor probably caused the change in the deer's population growth?
A) Emigration
B) Immigration
C) Genetic alterations
D) Food or water limitations
E) A flood or hurricane
The size of a deer population in an enclosed, protected area was measured over several years and found to be following the red (left) growth curve shown.After several years of drought, its population size more closely followed the blue (right) curve.What factor probably caused the change in the deer's population growth?A) Emigration
B) Immigration
C) Genetic alterations
D) Food or water limitations
E) A flood or hurricane
Unlock Deck
Unlock for access to all 259 flashcards in this deck.
Unlock Deck
k this deck
52
The African wild dog is highly endangered as a result of habitat fragmentation, hunting pressure, and contagious diseases contracted from domestic dogs as humans encroach on the wild dogs' habitat.Hunting, breeding, and pup and adult survival depend on a large pack size, in which individuals cooperate and help one another.This is particularly important because the dogs are relatively small.Historically, the average pack size was about 60 animals; today it ranges from 10 to 20.
Which factor would likely not be an advantage of a larger pack size in African wild dogs?
A) Larger packs are more efficient at bringing down prey.
B) Other pack members adopt pups whose mother is killed.
C) Packs may fight, resulting in young dogs leaving the pack.
D) A larger pack deters "bullies" on the savanna from attacking.
E) Pack members care for pups and bring them food from hunts.
Unlock Deck
Unlock for access to all 259 flashcards in this deck.
Unlock Deck
k this deck
53
Consider the logistic growth equation shown: If the value for in this equation increased, the graph would change by
A) leveling off at a lower population size.
B) leveling off at a higher population size.
C) crashing to a population size near zero.
D) returning to an exponential curve.
E) changing from an exponential to a linear curve.
If the value for in this equation increased, the graph would change byA) leveling off at a lower population size.
B) leveling off at a higher population size.
C) crashing to a population size near zero.
D) returning to an exponential curve.
E) changing from an exponential to a linear curve.
Unlock Deck
Unlock for access to all 259 flashcards in this deck.
Unlock Deck
k this deck
54
As populations of giant clams in the Indo-Pacific become sparser, local extinctions of giant clam populations have increased.This situation is likely related to the Allee effect because, in sparser populations, clams
A) reproduce less successfully.
B) are less able to find food resources.
C) have an increased death rate due to disease.
D) are unable to carry out cooperative interactions.
E) have a greater susceptibility to weather changes.
A) reproduce less successfully.
B) are less able to find food resources.
C) have an increased death rate due to disease.
D) are unable to carry out cooperative interactions.
E) have a greater susceptibility to weather changes.
Unlock Deck
Unlock for access to all 259 flashcards in this deck.
Unlock Deck
k this deck
55
The logistic growth equation describes a population that
A) is declining in size.
B) grows without limits.
C) grows rapidly at first but crashes when resources become limiting.
D) rapidly overshoots the carrying capacity and then fluctuates around this number.
E) grows rapidly at first, but slows and eventually stops growing as it reaches the carrying capacity.
Unlock Deck
Unlock for access to all 259 flashcards in this deck.
Unlock Deck
k this deck
56
A population is at its carrying capacity (K) when the
A) birth rate equals zero.
B) birth rate equals the death rate.
C) population is closed to migration.
D) population growth rate is proportional to K.
E) population growth rate is at its highest level.
A) birth rate equals zero.
B) birth rate equals the death rate.
C) population is closed to migration.
D) population growth rate is proportional to K.
E) population growth rate is at its highest level.
Unlock Deck
Unlock for access to all 259 flashcards in this deck.
Unlock Deck
k this deck
57
If r = 1.0 for a given population, then the population is
A) growing slowly.
B) growing rapidly.
C) stable in size.
D) decreasing slowly.
E) decreasing rapidly.
A) growing slowly.
B) growing rapidly.
C) stable in size.
D) decreasing slowly.
E) decreasing rapidly.
Unlock Deck
Unlock for access to all 259 flashcards in this deck.
Unlock Deck
k this deck
58
Which situation is an example of a density-independent limiting effect?
A) The killing of seedlings by drought
B) A limited food supply due to competition
C) A limit of nesting space in an area to 70 nests
D) The tendency of aggregations of guppies to attract predators
E) An increase in the incidence of malaria as populations increase
A) The killing of seedlings by drought
B) A limited food supply due to competition
C) A limit of nesting space in an area to 70 nests
D) The tendency of aggregations of guppies to attract predators
E) An increase in the incidence of malaria as populations increase
Unlock Deck
Unlock for access to all 259 flashcards in this deck.
Unlock Deck
k this deck
59
A population following a logistic growth pattern
A) is not subject to density-dependent factors.
B) is not subject to density-independent factors.
C) grows at the same rate at all population sizes.
D) grows fastest at or near its carrying capacity.
E) grows exponentially at small population sizes.
A) is not subject to density-dependent factors.
B) is not subject to density-independent factors.
C) grows at the same rate at all population sizes.
D) grows fastest at or near its carrying capacity.
E) grows exponentially at small population sizes.
Unlock Deck
Unlock for access to all 259 flashcards in this deck.
Unlock Deck
k this deck
60
A population of aphids is growing logistically.If the carrying capacity is 2,000 and the per capita growth rate is 0.1 per day, at what size will the population be increasing by 50 aphids per day?
A) 1,000
B) 1,500
C) 2,000
D) 3,000
E) 20,000
A) 1,000
B) 1,500
C) 2,000
D) 3,000
E) 20,000
Unlock Deck
Unlock for access to all 259 flashcards in this deck.
Unlock Deck
k this deck
61
Europeans brought domesticated honeybees to North America.The bees escaped to the wild and now live throughout the continent.A single queen lives up to 5 years and is the only reproducing female; she produces thousands of eggs over her lifetime.Workers live only for a summer.When the colony becomes too large, the queen goes on a flight (swarm) with some of the workers to locate a new colony site.A young queen takes over the original hive.Of the following honeybee life history characteristics, which is most likely to have contributed to their dispersal success?
A) Iteroparity
B) Swarming behavior
C) Long life span of queen
D) Short life span of workers
E) Single reproducing female
A) Iteroparity
B) Swarming behavior
C) Long life span of queen
D) Short life span of workers
E) Single reproducing female
Unlock Deck
Unlock for access to all 259 flashcards in this deck.
Unlock Deck
k this deck
62
If 300 mice in a mouse colony are born in January and 150 of them are still alive in September, what is the survivorship rate of these mice from January to September?
A) 0.15
B) 0.30
C) 0.45
D) 0.50
E) 0.60
A) 0.15
B) 0.30
C) 0.45
D) 0.50
E) 0.60
Unlock Deck
Unlock for access to all 259 flashcards in this deck.
Unlock Deck
k this deck
63
Unlike most marine fishes, sharks are K-strategists exhibiting slow growth, delayed maturation, long gestation periods, and production of few young.Sharks have been highly successful for 400 million years, but many are now endangered due to exploitation by human fisheries.In what way is the shark's K-strategy now a detriment, rather than a benefit, to its survival?
A) Sharks now share the role of top predator with humans, and they cannot reproduce rapidly enough to maintain their populations.
B) Sharks evolved to be top predators, but humans have taken over this role, and sharks cannot reproduce rapidly enough to maintain their populations.
C) Sharks evolved their life history strategy 400 million years ago; they can no longer evolve and therefore cannot respond to human predation.
D) K-strategy does not allow for a species to compete with other species, such as humans; thus, sharks can only succeed with an r-strategy.
E) K-strategy is ultimately a dead end in evolution because it does not allow organisms to respond quickly, and they will always die out.
Unlock Deck
Unlock for access to all 259 flashcards in this deck.
Unlock Deck
k this deck
64
Refer to the table below, which shows hypothetical data for a cohort of robins. The best explanation of survivorship (lx) is that it is
A) the number of organisms remaining alive at any given time.
B) the number of organisms dying within any given time period.
C) the percentage of organisms dying within any given time period.
D) calculated by dividing Nx by N0, or the number of individuals surviving by the starting number.
E) calculated by dividing N0 by Nx, or the starting number of individuals by the number surviving.
The best explanation of survivorship (lx) is that it isA) the number of organisms remaining alive at any given time.
B) the number of organisms dying within any given time period.
C) the percentage of organisms dying within any given time period.
D) calculated by dividing Nx by N0, or the number of individuals surviving by the starting number.
E) calculated by dividing N0 by Nx, or the starting number of individuals by the number surviving.
Unlock Deck
Unlock for access to all 259 flashcards in this deck.
Unlock Deck
k this deck
65
In the two species of Lobelia from Mount Kenya discussed in the text, L.telekii, which lives on dry rocky slopes, is semelparous, produces many seeds, and has a short life span.L.keniensis, which lives in moist valleys, is iteroparous, produces fewer large seeds, and lives longer.The differences in these two species suggest that their
A) habitats acted on genetic differences to cause the changes.
B) genetic differences are not related to their different habitats.
C) differences are based on environmental factors other than habitat.
D) differences reflect the plants' range of adaptability, not their genetics.
E) life history variations are part of the species and not subject to change.
Unlock Deck
Unlock for access to all 259 flashcards in this deck.
Unlock Deck
k this deck
66
Of 150 mice alive at the start of September, 120 are still alive at the start of October.What was the mortality rate during the month of September?
A) 0.15
B) 0.20
C) 0.30
D) 0.50
E) 0.80
A) 0.15
B) 0.20
C) 0.30
D) 0.50
E) 0.80
Unlock Deck
Unlock for access to all 259 flashcards in this deck.
Unlock Deck
k this deck
67
A biologist constructs a life table of a population of Thompson gazelles, using data taken during a single sampling.What type of life table is she constructing?
A) Static
B) Cohort
C) Horizontal
D) Iteroparous
E) Stage-dependent
A) Static
B) Cohort
C) Horizontal
D) Iteroparous
E) Stage-dependent
Unlock Deck
Unlock for access to all 259 flashcards in this deck.
Unlock Deck
k this deck
68
Refer to the graph shown. The cactus finch has high mortality rates during the juvenile stage, an adult stage with low mortality rates, and an "old age" with high mortality rates.This life history would result in a survivorship curve that is
A) most like curve A.
B) most like curve B.
C) most like curve C.
D) a combination of curves A and B.
E) a combination of curves A and C.
The cactus finch has high mortality rates during the juvenile stage, an adult stage with low mortality rates, and an "old age" with high mortality rates.This life history would result in a survivorship curve that isA) most like curve A.
B) most like curve B.
C) most like curve C.
D) a combination of curves A and B.
E) a combination of curves A and C.
Unlock Deck
Unlock for access to all 259 flashcards in this deck.
Unlock Deck
k this deck
69
People concerned with calculating Social Security benefits would be most interested in which predictive life table calculation?
A) Total individuals in a population
B) Total babies born during a given year
C) The generation time of the population
D) The per capita growth rate of the population
E) Number and proportion of people in an age group dying during a year
A) Total individuals in a population
B) Total babies born during a given year
C) The generation time of the population
D) The per capita growth rate of the population
E) Number and proportion of people in an age group dying during a year
Unlock Deck
Unlock for access to all 259 flashcards in this deck.
Unlock Deck
k this deck
70
A conservationist trying to manage a population of deer within a national forest looks at past life tables of the deer population.To predict future trends in the deer population, the conservationist would likely be most interested in which aspect of the life table?
A) Length of life span
B) Survivorship per year
C) Net reproductive rate
D) Ratio of males to females
E) Total number of individuals per year
A) Length of life span
B) Survivorship per year
C) Net reproductive rate
D) Ratio of males to females
E) Total number of individuals per year
Unlock Deck
Unlock for access to all 259 flashcards in this deck.
Unlock Deck
k this deck
71
Species that are first to colonize a new habitat (for example, after a disaster such as a fire) are often r-strategists.Characteristics that prepare them to survive in these conditions include all of these except that they
A) reproduce rapidly and only once.
B) can use a wide variety of resources.
C) compete strongly for limited resources.
D) produce large numbers of offspring.
E) are adapted to uncertain environments.
A) reproduce rapidly and only once.
B) can use a wide variety of resources.
C) compete strongly for limited resources.
D) produce large numbers of offspring.
E) are adapted to uncertain environments.
Unlock Deck
Unlock for access to all 259 flashcards in this deck.
Unlock Deck
k this deck
72
Refer to the table below, which shows hypothetical data for a cohort of robins. What is the survivorship value for the age class of 2 years?
A) 0.50
B) 0.40
C) 0.30
D) 0.20
E) 0.10
What is the survivorship value for the age class of 2 years?A) 0.50
B) 0.40
C) 0.30
D) 0.20
E) 0.10
Unlock Deck
Unlock for access to all 259 flashcards in this deck.
Unlock Deck
k this deck
73
American bullfrogs have three life stages: egg, tadpole, and adult.Adults live 6 to 7 years and can reproduce each year.To determine the fecundity schedule of a bullfrog population, one would need to determine
A) the average number of eggs laid per female per mating season.
B) the ratio of adult males to adult females for each year's age class.
C) the average number of eggs produced per female over her lifetime.
D) the survivorship rates from eggs to tadpoles and from tadpoles to adults.
E) the average number of adult offspring produced per female per mating season.
Unlock Deck
Unlock for access to all 259 flashcards in this deck.
Unlock Deck
k this deck
74
In 2010, the United States conducted a census of all residents, from which life tables were constructed for towns, states, and the country.These census-based life tables are examples of what kind of life tables?
A) Static
B) Cohort
C) Horizontal
D) Survivorship
E) Stage-dependent
A) Static
B) Cohort
C) Horizontal
D) Survivorship
E) Stage-dependent
Unlock Deck
Unlock for access to all 259 flashcards in this deck.
Unlock Deck
k this deck
75
Women in the twenty-first century are waiting longer to have children than in past generations.This suggests that they are likely making a life history trade-off; that is, they are maximizing
A) reproductive fitness instead of family size.
B) economic security instead of family size.
C) family size instead of economic security.
D) family size instead of increased life span.
E) increased life span instead of family size.
A) reproductive fitness instead of family size.
B) economic security instead of family size.
C) family size instead of economic security.
D) family size instead of increased life span.
E) increased life span instead of family size.
Unlock Deck
Unlock for access to all 259 flashcards in this deck.
Unlock Deck
k this deck
76
Refer to the table below, which shows hypothetical data for a cohort of robins. For the age class of 4 years, how many robins are alive?
A) 8
B) 7
C) 5
D) 4
E) 2
For the age class of 4 years, how many robins are alive?A) 8
B) 7
C) 5
D) 4
E) 2
Unlock Deck
Unlock for access to all 259 flashcards in this deck.
Unlock Deck
k this deck
77
If a certain age interval in a population contains 10 individuals and has a mortality rate of 1.00, how many individuals are in the next-older age interval?
A) 0
B) 1
C) 5
D) 9
E) 10
A) 0
B) 1
C) 5
D) 9
E) 10
Unlock Deck
Unlock for access to all 259 flashcards in this deck.
Unlock Deck
k this deck
78
Nearly all mammals are iteroparous.This is probably because, in these larger, longer-lived animals,
A) they put most of their available resources into reproduction.
B) many of their offspring die, compared to semelparous species.
C) multiple reproductive events increase chances of reproductive success.
D) adult mortality is very high, making multiple reproductive events necessary.
E) they live in uncertain environments where it is unsafe to have high reproduction.
Unlock Deck
Unlock for access to all 259 flashcards in this deck.
Unlock Deck
k this deck
79
Refer to the graph shown. A species shows a survivorship curve similar to curve C.A biologist viewing this curve can deduce that this species likely has which characteristic?
A) Large size
B) Long life span
C) Maternal care
D) High mortality rate of young
E) Constant risk of mortality through life
A species shows a survivorship curve similar to curve C.A biologist viewing this curve can deduce that this species likely has which characteristic?A) Large size
B) Long life span
C) Maternal care
D) High mortality rate of young
E) Constant risk of mortality through life
Unlock Deck
Unlock for access to all 259 flashcards in this deck.
Unlock Deck
k this deck
80
African elephants take many years to reach sexual maturity.A female usually gives birth to one calf at a time and cares for the calf for several years.The best description for an African elephant population is
A) iteroparous and r-strategist.
B) iteroparous and K-strategist.
C) semelparous and r-strategist.
D) semelparous and K-strategist.
E) exponential and K-strategist.
A) iteroparous and r-strategist.
B) iteroparous and K-strategist.
C) semelparous and r-strategist.
D) semelparous and K-strategist.
E) exponential and K-strategist.
Unlock Deck
Unlock for access to all 259 flashcards in this deck.
Unlock Deck
k this deck
Unlock Deck
Unlock for access to all 259 flashcards in this deck.


