Deck 15: Chi-Square Tests
Full screen (f)
Question
Question
Question
Question
Question
Question
Question
Question
Question
Question
Question
Question
Question
Question
Question
Question
Question
Question
Question
Question
Question
Question
Question
Question
Question
Question
Question
Question
Question
Question
Question
Question
Question
Question
Question
Question
Question
Question
Question
Question
Question
Question
Question
Question
Question
Question
Question
Question
Question
Question
Question
Question
Question
Question
Question
Question
Question
Question
Question
Question
Question
Question
Question
Question
Question
Question
Employees of OxCo Mfg. were surveyed to evaluate the company's pension plan. The table below displays some of the results of the survey. 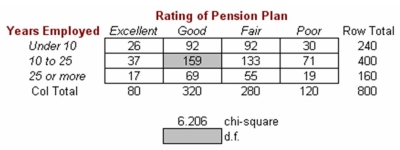 The expected frequency for the shaded cell in the table would be:
A)163.
B)158.
C)165.
D) 160.
The expected frequency for the shaded cell in the table would be:A)163.
B)158.
C)165.
D) 160.
Question
Question
Question
Question
Question
Question
You want to test the hypothesis that the prime rate and inflation are independent. The following table is prepared for the test on the basis of the results of a random sample, collected in various countries and various time periods: 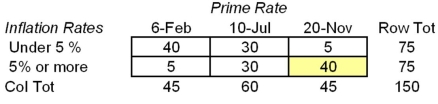 Using α = .05, what is the critical value of the test statistic that you would use?
A)3.841
B)12.59
C)5.991
D)7.815
Using α = .05, what is the critical value of the test statistic that you would use?A)3.841
B)12.59
C)5.991
D)7.815
Question
Question
Question
Employees of OxCo Mfg. were surveyed to evaluate the company's pension plan. The table below displays some of the results of the survey. 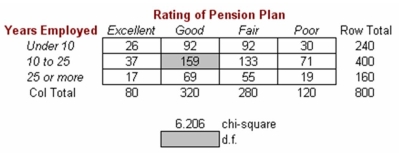 The appropriate conclusion would be:
A)do not reject H0.
B)reject H0 at α = .10.
C)reject H0 at α = .05.
D)reject H0 at α = .01.
The appropriate conclusion would be:A)do not reject H0.
B)reject H0 at α = .10.
C)reject H0 at α = .05.
D)reject H0 at α = .01.
Question
Employees of OxCo Mfg. were surveyed to evaluate the company's pension plan. The table below displays some of the results of the survey.  Degrees of freedom for this test (shaded cell below the table) would be:
A)6.
B)7.
C)799.
D)12.
Degrees of freedom for this test (shaded cell below the table) would be:A)6.
B)7.
C)799.
D)12.
Question
You want to test the hypothesis that the prime rate and inflation are independent. The following table is prepared for the test on the basis of the results of a random sample, collected in various countries and various time periods: 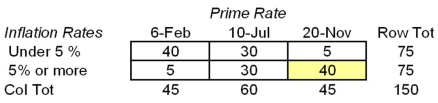 The expected frequency for the shaded cell is:
A)22.5.
B)30.
C)40.
D)40.5.
The expected frequency for the shaded cell is:A)22.5.
B)30.
C)40.
D)40.5.
Question
You want to test the hypothesis that the prime rate and inflation are independent. The following table is prepared for the test on the basis of the results of a random sample, collected in various countries and various time periods: 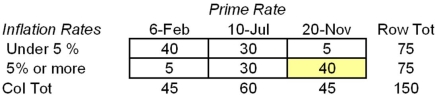 What is the value of the test statistic?
A)306.25
B)0.00
C)54.44
D)13.61
What is the value of the test statistic?A)306.25
B)0.00
C)54.44
D)13.61
Question
Question

Unlock Deck
Sign up to unlock the cards in this deck!
Unlock Deck
Unlock Deck
1/99
Play
Full screen (f)
Deck 15: Chi-Square Tests
1
In a chi-square test of a 5 × 5 contingency table at α = .05, the critical value is 37.65.
False
2
In a chi-square test for independence, observed frequencies must be at least 5 in every cell.
False
3
The chi-square test is based on the analysis of frequencies.
True
4
In a hypothesis test using chi-square, if the null hypothesis is true, the sample value of the sample chi-square test statistic will be exactly zero.
Unlock Deck
Unlock for access to all 99 flashcards in this deck.
Unlock Deck
k this deck
5
The chi-square test can only be used to assess independence between two variables.
Unlock Deck
Unlock for access to all 99 flashcards in this deck.
Unlock Deck
k this deck
6
In samples drawn from a population in which the row and column categories are independent, the value of the chi-square test statistic will be zero.
Unlock Deck
Unlock for access to all 99 flashcards in this deck.
Unlock Deck
k this deck
7
In a chi-square test for independence, expected frequencies must be integers (or rounded to the nearest integer).
Unlock Deck
Unlock for access to all 99 flashcards in this deck.
Unlock Deck
k this deck
8
A chi-square distribution is always skewed right.
Unlock Deck
Unlock for access to all 99 flashcards in this deck.
Unlock Deck
k this deck
9
A large negative chi-square test statistic would indicate that the null hypothesis should be rejected.
Unlock Deck
Unlock for access to all 99 flashcards in this deck.
Unlock Deck
k this deck
10
The chi-square test is unreliable when there are any cells with small observed frequency counts.
Unlock Deck
Unlock for access to all 99 flashcards in this deck.
Unlock Deck
k this deck
11
The chi-square test for independence is a nonparametric test (no parameters are estimated).
Unlock Deck
Unlock for access to all 99 flashcards in this deck.
Unlock Deck
k this deck
12
If two variables are independent, we would anticipate a chi-square test statistic close to zero.
Unlock Deck
Unlock for access to all 99 flashcards in this deck.
Unlock Deck
k this deck
13
In a chi-square test for independence, observed and expected frequencies must sum across to the same row totals and down to the same column totals.
Unlock Deck
Unlock for access to all 99 flashcards in this deck.
Unlock Deck
k this deck
14
Observed frequencies in a chi-square goodness-of-fit test for normality may be less than 5, or even 0, in some cells, as long as the expected frequencies are large enough.
Unlock Deck
Unlock for access to all 99 flashcards in this deck.
Unlock Deck
k this deck
15
A chi-square test for independence is called a distribution-free test since the test is based on categorical data rather than on populations that follow any particular distribution.
Unlock Deck
Unlock for access to all 99 flashcards in this deck.
Unlock Deck
k this deck
16
The shape of the chi-square distribution depends only on its degrees of freedom.
Unlock Deck
Unlock for access to all 99 flashcards in this deck.
Unlock Deck
k this deck
17
Cochran's Rule requires observed frequencies of 5 or more in each cell of a contingency table.
Unlock Deck
Unlock for access to all 99 flashcards in this deck.
Unlock Deck
k this deck
18
The degrees of freedom in a 3 × 4 chi-square contingency table would equal 11.
Unlock Deck
Unlock for access to all 99 flashcards in this deck.
Unlock Deck
k this deck
19
The null hypothesis for a chi-square contingency test of independence for two variables always assumes that the variables are independent.
Unlock Deck
Unlock for access to all 99 flashcards in this deck.
Unlock Deck
k this deck
20
The null hypothesis for a chi-square test on a contingency table is that the variables are dependent.
Unlock Deck
Unlock for access to all 99 flashcards in this deck.
Unlock Deck
k this deck
21
For a chi-square goodness-of-fit test for a uniform distribution with 7 categories, we would use the critical value for 6 degrees of freedom.
Unlock Deck
Unlock for access to all 99 flashcards in this deck.
Unlock Deck
k this deck
22
An attraction of the Kolmogorov-Smirnov test is that it is fairly easy to do without a computer.
Unlock Deck
Unlock for access to all 99 flashcards in this deck.
Unlock Deck
k this deck
23
In a goodness-of-fit test, a linear probability plot suggests that the null hypothesis should be rejected.
Unlock Deck
Unlock for access to all 99 flashcards in this deck.
Unlock Deck
k this deck
24
In an ECDF test for goodness-of-fit, the n observations are grouped into categories rather than being treated individually.
Unlock Deck
Unlock for access to all 99 flashcards in this deck.
Unlock Deck
k this deck
25
The Anderson-Darling test is used to test the assumption of normality.
Unlock Deck
Unlock for access to all 99 flashcards in this deck.
Unlock Deck
k this deck
26
In a chi-square goodness-of-fit test, a small p-value would indicate a good fit to the hypothesized distribution.
Unlock Deck
Unlock for access to all 99 flashcards in this deck.
Unlock Deck
k this deck
27
ECDF tests have an advantage over the chi-square goodness-of-fit test on frequencies because an ECDF test treats observations individually.
Unlock Deck
Unlock for access to all 99 flashcards in this deck.
Unlock Deck
k this deck
28
Probability plots are used to test the assumption of normality.
Unlock Deck
Unlock for access to all 99 flashcards in this deck.
Unlock Deck
k this deck
29
For a chi-square goodness-of-fit test for a normal distribution using 7 categories with estimated mean and standard deviation, we would use the critical value for 4 degrees of freedom.
Unlock Deck
Unlock for access to all 99 flashcards in this deck.
Unlock Deck
k this deck
30
A probability plot usually allows outliers to be detected.
Unlock Deck
Unlock for access to all 99 flashcards in this deck.
Unlock Deck
k this deck
31
For a chi-square goodness-of-fit test for a normal distribution using 8 categories with estimated mean and standard deviation, we would use the critical value for 7 degrees of freedom.
Unlock Deck
Unlock for access to all 99 flashcards in this deck.
Unlock Deck
k this deck
32
The Poisson goodness-of-fit test is inappropriate for continuous data.
Unlock Deck
Unlock for access to all 99 flashcards in this deck.
Unlock Deck
k this deck
33
In a chi-square goodness-of-fit test, we lose one degree of freedom for each parameter estimated.
Unlock Deck
Unlock for access to all 99 flashcards in this deck.
Unlock Deck
k this deck
34
The Kolmogorov-Smirnov and Anderson-Darling tests are based on the ECDF (Empirical Cumulative Distribution Function).
Unlock Deck
Unlock for access to all 99 flashcards in this deck.
Unlock Deck
k this deck
35
When raw data are available, ECDF tests usually surpass the chi-square test in their ability to detect departures from the distribution specified in the null hypothesis.
Unlock Deck
Unlock for access to all 99 flashcards in this deck.
Unlock Deck
k this deck
36
In a chi-square goodness-of-fit test, a sample of n observations has n - 1 degrees of freedom.
Unlock Deck
Unlock for access to all 99 flashcards in this deck.
Unlock Deck
k this deck
37
An attraction of the Anderson-Darling test is that it is fairly easy to do without a computer.
Unlock Deck
Unlock for access to all 99 flashcards in this deck.
Unlock Deck
k this deck
38
Goodness-of-fit tests using the ECDF (Empirical Cumulative Distribution Function) compare the actual cumulative frequencies with expected cumulative frequencies for each observation under the assumption that the data came from the hypothesized distribution.
Unlock Deck
Unlock for access to all 99 flashcards in this deck.
Unlock Deck
k this deck
39
For a chi-square goodness-of-fit test for a uniform distribution with 5 categories, we would use the critical value for 4 degrees of freedom.
Unlock Deck
Unlock for access to all 99 flashcards in this deck.
Unlock Deck
k this deck
40
In a chi-square goodness-of-fit test, we gain one degree of freedom if n increases by 1.
Unlock Deck
Unlock for access to all 99 flashcards in this deck.
Unlock Deck
k this deck
41
If samples are drawn from a population that is normal, a goodness-of-fit test for normality could yield:
A)Type I error but not Type II error.
B)Type II error but not Type I error.
C)Either Type I error or Type II error.
D)Both Type I and Type II errors.
A)Type I error but not Type II error.
B)Type II error but not Type I error.
C)Either Type I error or Type II error.
D)Both Type I and Type II errors.
Unlock Deck
Unlock for access to all 99 flashcards in this deck.
Unlock Deck
k this deck
42
A chi-square test of independence is a one-tailed test. The reason is that:
A)we are testing whether the frequencies exceed their expected values.
B)we square the deviations, so the test statistic lies at or above zero.
C)hypothesis tests are one-tailed tests when dealing with sample data.
D)the chi-square distribution is positively skewed.
A)we are testing whether the frequencies exceed their expected values.
B)we square the deviations, so the test statistic lies at or above zero.
C)hypothesis tests are one-tailed tests when dealing with sample data.
D)the chi-square distribution is positively skewed.
Unlock Deck
Unlock for access to all 99 flashcards in this deck.
Unlock Deck
k this deck
43
In a chi-square test of independence, the number of degrees of freedom equals the:
A)number of observations minus one.
B)number of categories minus one.
C)number of rows minus one times the number of columns minus one.
D)number of sample observations minus the missing observations.
A)number of observations minus one.
B)number of categories minus one.
C)number of rows minus one times the number of columns minus one.
D)number of sample observations minus the missing observations.
Unlock Deck
Unlock for access to all 99 flashcards in this deck.
Unlock Deck
k this deck
44
To determine how well an observed set of frequencies fits an expected set of frequencies from a Poisson distribution, we must estimate:
A)no parameters.
B)one parameter (λ).
C)two parameters (μ, σ).
D)three parameters (μ, σ, n).
A)no parameters.
B)one parameter (λ).
C)two parameters (μ, σ).
D)three parameters (μ, σ, n).
Unlock Deck
Unlock for access to all 99 flashcards in this deck.
Unlock Deck
k this deck
45
Which of these statements concerning a chi-square goodness-of-fit test is correct?
A)Data could be ratio or interval measurements.
B)Population must be normally distributed.
C)All the expected frequencies must be equal.
A)Data could be ratio or interval measurements.
B)Population must be normally distributed.
C)All the expected frequencies must be equal.
Unlock Deck
Unlock for access to all 99 flashcards in this deck.
Unlock Deck
k this deck
46
We sometimes combine two row or column categories in a chi-square test when:
A)observed frequencies are more than 5.
B)observed frequencies are less than 5.
C)expected frequencies are more than 5.
D)expected frequencies are less than 5.
A)observed frequencies are more than 5.
B)observed frequencies are less than 5.
C)expected frequencies are more than 5.
D)expected frequencies are less than 5.
Unlock Deck
Unlock for access to all 99 flashcards in this deck.
Unlock Deck
k this deck
47
In a test for a uniform distribution with k categories, the expected frequency is n/k in each cell.
Unlock Deck
Unlock for access to all 99 flashcards in this deck.
Unlock Deck
k this deck
48
The number of cars waiting at a certain residential neighborhood stoplight is observed at 6:00 a.m. on 160 different days. The observed sample frequencies are shown here: Under the null hypothesis of a uniform distribution, the expected number of days we would see 0 cars is:
A)10.
B)20.
C)30.
D)40.
A)10.
B)20.
C)30.
D)40.
Unlock Deck
Unlock for access to all 99 flashcards in this deck.
Unlock Deck
k this deck
49
Kortholts that fail to meet certain precise specifications must be reworked on the next day until they are within the desired specifications. A sample of one day's output of kortholts from the Melodic Kortholt Company showed the following frequencies: Find the chi-square test statistic for a hypothesis of independence.
A)7.22
B)4.17
C)5.13
D)6.08
A)7.22
B)4.17
C)5.13
D)6.08
Unlock Deck
Unlock for access to all 99 flashcards in this deck.
Unlock Deck
k this deck
50
Which of the following is not a potential solution to the problem that arises when not all expected frequencies are 5 or more in a chi-square test for independence?
A)Combine some of the columns
B)Combine some of the rows
C)Increase the sample size
D)Add more rows or columns
A)Combine some of the columns
B)Combine some of the rows
C)Increase the sample size
D)Add more rows or columns
Unlock Deck
Unlock for access to all 99 flashcards in this deck.
Unlock Deck
k this deck
51
The critical value in a chi-square test for independence depends on:
A)the normality of the data.
B)the variance of the data.
C)the number of categories.
D)the expected frequencies.
A)the normality of the data.
B)the variance of the data.
C)the number of categories.
D)the expected frequencies.
Unlock Deck
Unlock for access to all 99 flashcards in this deck.
Unlock Deck
k this deck
52
Kortholts that fail to meet certain precise specifications must be reworked on the next day until they are within the desired specifications. A sample of one day's output of kortholts from the Melodic Kortholt Company showed the following frequencies: Find the p-value for the chi-square test statistic for a hypothesis of independence.
A)Less than .01
B)Between .01 and .025
C)Between .025 and .05
D)Greater than .05
A)Less than .01
B)Between .01 and .025
C)Between .025 and .05
D)Greater than .05
Unlock Deck
Unlock for access to all 99 flashcards in this deck.
Unlock Deck
k this deck
53
A chi-square goodness of fit test for a normal distribution used 40 observations, and the mean and standard deviation were estimated from the sample. The test used six categories. We would use how many degrees of freedom in looking up the critical value for the test?
A)39
B)37
C)5
D)3
A)39
B)37
C)5
D)3
Unlock Deck
Unlock for access to all 99 flashcards in this deck.
Unlock Deck
k this deck
54
A chi-square goodness of fit test for a normal distribution used 60 observations, and the mean and standard deviation were estimated from the sample. The test used seven categories. We would use how many degrees of freedom in looking up the critical value for the test?
A)6
B)4
C)59
D)57
A)6
B)4
C)59
D)57
Unlock Deck
Unlock for access to all 99 flashcards in this deck.
Unlock Deck
k this deck
55
A proofreader checked 160 ads for grammatical errors. The sample frequency distribution is shown: Using a goodness-of-fit test to determine whether this distribution is uniform would result in a chi-square test statistic of approximately:
A)55.
B)79.
C)85.
D) 161.
A)55.
B)79.
C)85.
D) 161.
Unlock Deck
Unlock for access to all 99 flashcards in this deck.
Unlock Deck
k this deck
56
A proofreader checked 160 ads for grammatical errors. The distribution obtained is shown: At ? = .01, what decision would we reach in a goodness-of-fit test to see whether this sample came from a uniform distribution?
A)Reject the null and conclude the distribution is not uniform.
B)Conclude that there is insufficient evidence to reject the null.
C)No conclusion can be made due to small expected frequencies.
D)No conclusion can be made due to inadequate sample size.
A)Reject the null and conclude the distribution is not uniform.
B)Conclude that there is insufficient evidence to reject the null.
C)No conclusion can be made due to small expected frequencies.
D)No conclusion can be made due to inadequate sample size.
Unlock Deck
Unlock for access to all 99 flashcards in this deck.
Unlock Deck
k this deck
57
In order to apply the chi-square test of independence, we prefer to have:
A)at least 5 observed frequencies in each cell.
B)at least 5 expected observations in each cell.
C)at least 5 percent of the observations in each cell.
D)not more than 5 observations in each cell.
A)at least 5 observed frequencies in each cell.
B)at least 5 expected observations in each cell.
C)at least 5 percent of the observations in each cell.
D)not more than 5 observations in each cell.
Unlock Deck
Unlock for access to all 99 flashcards in this deck.
Unlock Deck
k this deck
58
Which of these statements concerning a chi-square goodness-of-fit test is correct?
A)It is inapplicable to test for a normal distribution with open-ended top and bottom classes.
B)It is generally a better test than the chi-square test of independence.
C)There is no way to get the degrees of freedom since the right tail goes to infinity.
D)It can be used to test whether a sample follows a specified distribution.
Unlock Deck
Unlock for access to all 99 flashcards in this deck.
Unlock Deck
k this deck
59
An operations analyst counted the number of arrivals per minute at a bank ATM in each of 30 randomly chosen minutes. The results were: 0, 3, 3, 2, 1, 0, 1, 0, 0, 1, 1, 1, 2, 1, 0, 1, 0, 1, 2, 1, 1, 2, 1, 0, 1, 2, 0, 1, 0, 1. Which goodness-of-fit test would you recommend?
A)Uniform
B)Poisson
C)Normal
D)Binomial
A)Uniform
B)Poisson
C)Normal
D)Binomial
Unlock Deck
Unlock for access to all 99 flashcards in this deck.
Unlock Deck
k this deck
60
A proofreader checked 160 ads for grammatical errors. The sample frequency distribution is shown: Under the null hypothesis of a uniform distribution, the expected number of times we would get 0 errors is:
A)10.
B)20.
C)30.
D)40.
A)10.
B)20.
C)30.
D)40.
Unlock Deck
Unlock for access to all 99 flashcards in this deck.
Unlock Deck
k this deck
61
To carry out a chi-square goodness-of-fit test for normality, you need at least:
A)5 categories altogether.
B)5 observations in each category.
C)5 expected observations in each category.
D)50 samples or more.
A)5 categories altogether.
B)5 observations in each category.
C)5 expected observations in each category.
D)50 samples or more.
Unlock Deck
Unlock for access to all 99 flashcards in this deck.
Unlock Deck
k this deck
62
As an independent project, a team of statistics students tabulated the types of vehicles that were parked in four different suburban shopping malls.
For a chi-square test of independence, degrees of freedom would be:
A)20.
B)12.
C)399.
D)6.
For a chi-square test of independence, degrees of freedom would be:
A)20.
B)12.
C)399.
D)6.
Unlock Deck
Unlock for access to all 99 flashcards in this deck.
Unlock Deck
k this deck
63
As an independent project, a team of statistics students tabulated the types of vehicles that were parked in four different suburban shopping malls.
For a chi-square test of independence, the critical value for ? = .10 is:
A)10.64.
B)14.68.
C)28.41.
D)18.55.
For a chi-square test of independence, the critical value for ? = .10 is:
A)10.64.
B)14.68.
C)28.41.
D)18.55.
Unlock Deck
Unlock for access to all 99 flashcards in this deck.
Unlock Deck
k this deck
64
The table below is a tabulation of opinions of employees of Axolotl Corporation, who were sampled at random from pay records and asked to complete an anonymous job satisfaction survey.
For a chi-square test of independence, degrees of freedom would be:
A)2
B)3
C)4
D)6
For a chi-square test of independence, degrees of freedom would be:
A)2
B)3
C)4
D)6
Unlock Deck
Unlock for access to all 99 flashcards in this deck.
Unlock Deck
k this deck
65
As an independent project, a team of statistics students tabulated the types of vehicles that were parked in four different suburban shopping malls.
Assuming independence, the expected frequency of SUVs in Jamestown is:
A)12.
B)21.
C)75.
D)60.
Assuming independence, the expected frequency of SUVs in Jamestown is:
A)12.
B)21.
C)75.
D)60.
Unlock Deck
Unlock for access to all 99 flashcards in this deck.
Unlock Deck
k this deck
66
Employees of OxCo Mfg. were surveyed to evaluate the company's pension plan. The table below displays some of the results of the survey. The expected frequency for the shaded cell in the table would be:
A)163.
B)158.
C)165.
D) 160.
The expected frequency for the shaded cell in the table would be:A)163.
B)158.
C)165.
D) 160.
Unlock Deck
Unlock for access to all 99 flashcards in this deck.
Unlock Deck
k this deck
67
The table below is a tabulation of opinions of employees of Axolotl Corporation, who were sampled at random from pay records and asked to complete an anonymous job satisfaction survey.
Assuming independence, the expected frequency of satisfied hourly employees is:
A)80.
B)90.
C)75.
D)60.
Assuming independence, the expected frequency of satisfied hourly employees is:
A)80.
B)90.
C)75.
D)60.
Unlock Deck
Unlock for access to all 99 flashcards in this deck.
Unlock Deck
k this deck
68
An operations analyst counted the number of arrivals per minute at an ATM in each of 30 randomly chosen minutes. The results were: 0, 3, 3, 2, 1, 0, 1, 0, 0, 1, 1, 1, 2, 1, 0, 1, 0, 1, 2, 1, 1, 2, 1, 0, 1, 2, 0, 1, 0, 1. For the Poisson goodness-of-fit test, what is the expected frequency of the data value X = 1?
A)Impossible to determine.
B)11.04
C)1.00
D)2.47
A)Impossible to determine.
B)11.04
C)1.00
D)2.47
Unlock Deck
Unlock for access to all 99 flashcards in this deck.
Unlock Deck
k this deck
69
The table below is a tabulation of opinions of employees of Axolotl Corporation, who were sampled at random from pay records and asked to complete an anonymous job satisfaction survey.
For a chi-square test of independence, the critical value for ? = .01 is:
A)9.210.
B)4.605.
C)11.34.
D)16.81.
For a chi-square test of independence, the critical value for ? = .01 is:
A)9.210.
B)4.605.
C)11.34.
D)16.81.
Unlock Deck
Unlock for access to all 99 flashcards in this deck.
Unlock Deck
k this deck
70
You test a hypothesis of independence of two variables. The number of observations is 500 and you have classified the data into a 4 by 4 contingency table. The test statistic has __________ degrees of freedom.
A)16
B)9
C)499
D)498
A)16
B)9
C)499
D)498
Unlock Deck
Unlock for access to all 99 flashcards in this deck.
Unlock Deck
k this deck
71
Students in an introductory college economics class were asked how many credits they had earned in college, and how certain they were about their choice of major. Their replies are summarized below.
Assuming independence, the expected frequency of very uncertain students with 60 credits or more is:
A)12.47.
B)2.00.
C)14.56.
D)11.09.
Assuming independence, the expected frequency of very uncertain students with 60 credits or more is:
A)12.47.
B)2.00.
C)14.56.
D)11.09.
Unlock Deck
Unlock for access to all 99 flashcards in this deck.
Unlock Deck
k this deck
72
You want to test the hypothesis that the prime rate and inflation are independent. The following table is prepared for the test on the basis of the results of a random sample, collected in various countries and various time periods: Using α = .05, what is the critical value of the test statistic that you would use?
A)3.841
B)12.59
C)5.991
D)7.815
Using α = .05, what is the critical value of the test statistic that you would use?A)3.841
B)12.59
C)5.991
D)7.815
Unlock Deck
Unlock for access to all 99 flashcards in this deck.
Unlock Deck
k this deck
73
Students in an introductory college economics class were asked how many credits they had earned in college, and how certain they were about their choice of major. Their replies are summarized below.
For a chi-square test of independence, degrees of freedom would be:
A)2.
B)9.
C)4.
D)127.
For a chi-square test of independence, degrees of freedom would be:
A)2.
B)9.
C)4.
D)127.
Unlock Deck
Unlock for access to all 99 flashcards in this deck.
Unlock Deck
k this deck
74
Students in an introductory college economics class were asked how many credits they had earned in college, and how certain they were about their choice of major. Their replies are summarized below.
Under the assumption of independence, the expected frequency in the upper left cell is:
A)15.09.
B)24.00.
C)19.72.
D)20.22.
Under the assumption of independence, the expected frequency in the upper left cell is:
A)15.09.
B)24.00.
C)19.72.
D)20.22.
Unlock Deck
Unlock for access to all 99 flashcards in this deck.
Unlock Deck
k this deck
75
Employees of OxCo Mfg. were surveyed to evaluate the company's pension plan. The table below displays some of the results of the survey. The appropriate conclusion would be:
A)do not reject H0.
B)reject H0 at α = .10.
C)reject H0 at α = .05.
D)reject H0 at α = .01.
The appropriate conclusion would be:A)do not reject H0.
B)reject H0 at α = .10.
C)reject H0 at α = .05.
D)reject H0 at α = .01.
Unlock Deck
Unlock for access to all 99 flashcards in this deck.
Unlock Deck
k this deck
76
Employees of OxCo Mfg. were surveyed to evaluate the company's pension plan. The table below displays some of the results of the survey. Degrees of freedom for this test (shaded cell below the table) would be:
A)6.
B)7.
C)799.
D)12.
Degrees of freedom for this test (shaded cell below the table) would be:A)6.
B)7.
C)799.
D)12.
Unlock Deck
Unlock for access to all 99 flashcards in this deck.
Unlock Deck
k this deck
77
You want to test the hypothesis that the prime rate and inflation are independent. The following table is prepared for the test on the basis of the results of a random sample, collected in various countries and various time periods: The expected frequency for the shaded cell is:
A)22.5.
B)30.
C)40.
D)40.5.
The expected frequency for the shaded cell is:A)22.5.
B)30.
C)40.
D)40.5.
Unlock Deck
Unlock for access to all 99 flashcards in this deck.
Unlock Deck
k this deck
78
You want to test the hypothesis that the prime rate and inflation are independent. The following table is prepared for the test on the basis of the results of a random sample, collected in various countries and various time periods: What is the value of the test statistic?
A)306.25
B)0.00
C)54.44
D)13.61
What is the value of the test statistic?A)306.25
B)0.00
C)54.44
D)13.61
Unlock Deck
Unlock for access to all 99 flashcards in this deck.
Unlock Deck
k this deck
79
Students in an introductory college economics class were asked how many credits they had earned in college, and how certain they were about their choice of major. Their replies are summarized below.
For a chi-square test of independence, the critical value for ? = .05 is:
A)5.991.
B)7.815.
C)9.488.
D)16.92.
For a chi-square test of independence, the critical value for ? = .05 is:
A)5.991.
B)7.815.
C)9.488.
D)16.92.
Unlock Deck
Unlock for access to all 99 flashcards in this deck.
Unlock Deck
k this deck
80
Students in an introductory college economics class were asked how many credits they had earned in college, and how certain they were about their choice of major. Their replies are summarized below.
Which statement is most nearly correct?
A)The contingency table violates Cochran's Rule.
B)Visual inspection of column frequencies suggests independence.
C)At ? = .05 we would easily reject the null hypothesis of independence.
D)At ? = .05 we cannot reject he null hypothesis of independence.
Which statement is most nearly correct?
A)The contingency table violates Cochran's Rule.
B)Visual inspection of column frequencies suggests independence.
C)At ? = .05 we would easily reject the null hypothesis of independence.
D)At ? = .05 we cannot reject he null hypothesis of independence.
Unlock Deck
Unlock for access to all 99 flashcards in this deck.
Unlock Deck
k this deck
Unlock Deck
Unlock for access to all 99 flashcards in this deck.


