Deck 5: Hypothesis Testing in Linear Regression Analysis
Full screen (f)
Question
Question
Question
Question
Question
The logic behind the t-test for the individual significance of the estimated slope coefficient 
Is that if the estimated slope coefficient is likely to be different from 0,then
A)the estimated slope coefficient should be large.
B)the estimated standard error should be large.
C)the ratio of the estimated slope coefficient to the standard error of the estimated slope coefficient should be small.
D)the ratio of the estimated slope coefficient to the standard error of the estimated slope coefficient should be large.
Question
Figure:
Suppose you regress U.S.annual real GDP ($ billions)on U.S.annual real defense expenditures ($ millions)and that you get the following results.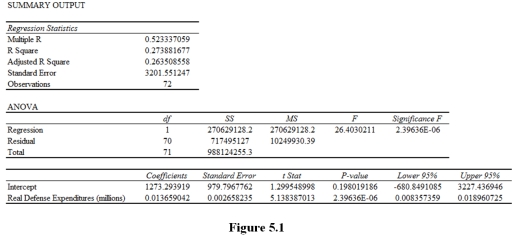
Based on the Excel output in Figure 5.1,you should conclude that
A)the estimated intercept is statistically significant.
B)the estimated intercept is not statistically significant.
C)the estimated slope coefficient is not statistically significant.
D)the estimated sample regression function is not statistically significant.
Question
Question
Question
Figure:
Suppose you regress U.S.annual real GDP ($ billions)on U.S.annual real defense expenditures ($ millions)and that you get the following results.
Based on the Excel output in Figure 5.1,you should conclude that the estimated sample regression function is
A)statistically significant because 2.39636E - 06 < .05.
B)statistically significant because 26.403 > .05.
C)statistically insignificant because 2.39636E - 06 < .05.
D)statistically insignificant because 26.403 > .05.
Question
Question
Question
Question
Question
Figure:
Suppose you regress U.S.annual real GDP ($ billions)on U.S.annual real defense expenditures ($ millions)and that you get the following results.
Based on the Excel output in Figure 5.1,you should conclude that a
A)$1 million increase in real defense expenditures is estimated to be associated with a statistically significant $1,273.29 billion increase in real GDP,holding all else constant.
B)real GDP is estimated to be a statistically significant $1,273.29 billion when real defense expenditures are 0,holding all else constant.
C)$1 million increase in real defense expenditures is estimated to be associated with a statistically insignificant $13.659 million increase in real GDP,holding all else constant.
D)a $1 million increase in real defense expenditures is estimated to be associated with a statistically significant $13.659 million increase in real GDP,holding all else constant.
Question
Figure:
Suppose you regress U.S.annual real GDP ($ billions)on U.S.annual real defense expenditures ($ millions)and that you get the following results.
Based on the Excel output in Figure 5.1,you should conclude that the estimated slope coefficient is
A)statistically insignificant because the 95% confidence interval contains the estimated slope coefficient.
B)statistically insignificant because 5.138 > .05.
C)statistically insignificant because 2.39636E - 06 < .05.
D)statistically significant because 2.39636E - 06 < .05.
Question
Question
Question
Question
Question
The t-statistic for the individual significance of the estimated slope coefficient 
Is
A)the standard error of the estimated slope coefficient.
B)the estimated slope coefficient.
C)the ratio of the estimated slope coefficient to the standard error of the estimated slope coefficient.
D)the ratio of the estimated slope coefficient to the variance of the estimated slope coefficient.
Is
A)the standard error of the estimated slope coefficient.
B)the estimated slope coefficient.
C)the ratio of the estimated slope coefficient to the standard error of the estimated slope coefficient.
D)the ratio of the estimated slope coefficient to the variance of the estimated slope coefficient.
Question
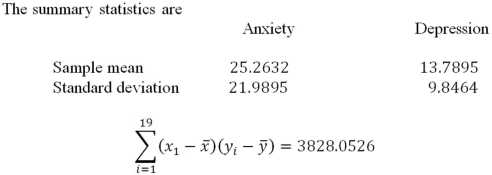
A counselor working with teenagers is interested in the relationship between anxiety and depression.The counselor administers a depression and anxiety test to each teenager.The scores obtained from the administration of the two inventories are given below. 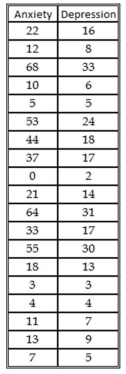
If an individual had an anxiety score of 40,what is a 95% confidence interval for the mean predicted value?
If an individual had an anxiety score of 40,what is a 95% confidence interval for the mean predicted value?
Question
Question
Figure:
Suppose you regress U.S.annual real GDP ($ billions)on U.S.annual real defense expenditures ($ millions)and that you get the following results.
Based on the Excel output in Figure 5.1,the appropriate critical value for 95% confidence is
A)1.96.
B)t.05,70 = 1.67.
C)1.645.
D)t.025,70 = 2.00.
Suppose you regress U.S.annual real GDP ($ billions)on U.S.annual real defense expenditures ($ millions)and that you get the following results.
Based on the Excel output in Figure 5.1,the appropriate critical value for 95% confidence is
A)1.96.
B)t.05,70 = 1.67.
C)1.645.
D)t.025,70 = 2.00.
Question
Question
Suppose you regress the number of days that individuals report having hunted in the past year on years of education and that you get the results in Figure 4.3. 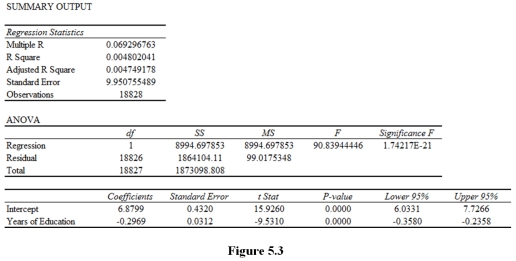
What would you conclude about the statistical significance of the estimated sample regression function? The estimated intercept? The estimated slope coefficient? Explain.
What would you conclude about the statistical significance of the estimated sample regression function? The estimated intercept? The estimated slope coefficient? Explain.
Question
Question
Question
Suppose that you regress the total number of medals that a country won in the 2008 Olympics on GDP per capita and that you get the results in Figure 4.2. 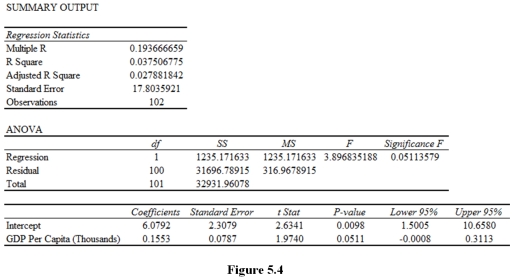
What would you conclude about the statistical significance of the estimated sample regression function? The estimated intercept? The estimated slope coefficient? Explain.
What would you conclude about the statistical significance of the estimated sample regression function? The estimated intercept? The estimated slope coefficient? Explain.
Question
Question
Figure
Suppose you regress obesity rates for the 50 states and the District of Columbia on the percentage of adults who have earned a Bachelor's degree and that you get the following results.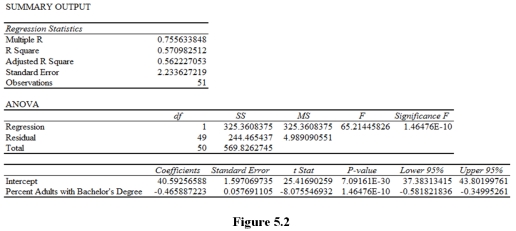
Based on the Excel output in Figure 5.2,you should conclude that the estimated slope coefficient is
A)statistically significant because -8.076 < .05.
B)statistically significant because -0.466 < .05.
C)statistically significant because |-8.076| > 1.96.
D)statistically insignificant because -0.466 is inside the 95% confidence interval.
Question
Figure
Suppose you regress obesity rates for the 50 states and the District of Columbia on the percentage of adults who have earned a Bachelor's degree and that you get the following results.
Based on the Excel output in Figure 5.2,you should conclude that the estimated sample regression function is
A)statistically significant because 65.21 > .05.
B)statistically significant because 1.465E - 10 < .05.
C)statistically significant because 7.092E - 30 < .05.
D)statistically significant because 25.42 > 1.96.
Question
Question
Question
Figure
Suppose you regress obesity rates for the 50 states and the District of Columbia on the percentage of adults who have earned a Bachelor's degree and that you get the following results.
Based on the Excel output in Figure 5.2,you should conclude that a
A)one percentage point increase in the percentage of adults with a Bachelor's degree is associated with a statistically insignificant 40.59 percent increase in the obesity rate,holding all else constant.
B)one percentage point increase in the percentage of adults with a Bachelor's degree is associated with a statistically significant 40.59 percent increase in the obesity rate,holding all else constant.
C)one percentage point increase in the percentage of adults with a Bachelor's degree is associated with a statistically insignificant .466 percentage point increase in the obesity rate,holding all else constant.
D)one percentage point increase in the percentage of adults with a Bachelor's degree is associated with a statistically significant .466 percentage point increase in the obesity rate,holding all else constant.

Unlock Deck
Sign up to unlock the cards in this deck!
Unlock Deck
Unlock Deck
1/34
Play
Full screen (f)
Deck 5: Hypothesis Testing in Linear Regression Analysis
1
The critical value method for hypothesis testing relies on the fact that
A)if the null hypothesis is false,then it is very unlikely to observe a test statistic more extreme than the critical value.
B)if the null hypothesis is true,then it is very unlikely to observe a test statistic more extreme than the critical value.
C)if the null hypothesis is true,then it is very likely to observe a test statistic more extreme than the critical value.
D)if the alternative hypothesis is false,then it is very unlikely to observe a test statistic more extreme than the critical value.
B
2
When using the confidence interval method for hypothesis testing,if the calculated confidence interval does not contain the value of the null hypothesis,then you should
A)reject the null hypothesis.
B)fail to reject the null hypothesis.
C)reject the alternative hypothesis.
D)calculate a new confidence interval that does contain the value of the null hypothesis.
A)reject the null hypothesis.
B)fail to reject the null hypothesis.
C)reject the alternative hypothesis.
D)calculate a new confidence interval that does contain the value of the null hypothesis.
A
3
The F-statistic for the overall significance of the estimated sample regression function is
A)the ratio of the MSExplained to the MSUnexplained.
B)the ratio of the MSUnexplained to the MSExplained.
C)the standard error of the estimated sample regression function.
D)the adjusted R-square.
A)the ratio of the MSExplained to the MSUnexplained.
B)the ratio of the MSUnexplained to the MSExplained.
C)the standard error of the estimated sample regression function.
D)the adjusted R-square.
A
4
A sampling distribution is
A)the distribution of a parameter.
B)the distribution of a statistic.
C)the standard deviation of a statistic.
D)the standard deviation of the estimated slope coefficient.
A)the distribution of a parameter.
B)the distribution of a statistic.
C)the standard deviation of a statistic.
D)the standard deviation of the estimated slope coefficient.
Unlock Deck
Unlock for access to all 34 flashcards in this deck.
Unlock Deck
k this deck
5
The logic behind the t-test for the individual significance of the estimated slope coefficient
Is that if the estimated slope coefficient is likely to be different from 0,then
A)the estimated slope coefficient should be large.
B)the estimated standard error should be large.
C)the ratio of the estimated slope coefficient to the standard error of the estimated slope coefficient should be small.
D)the ratio of the estimated slope coefficient to the standard error of the estimated slope coefficient should be large.
Unlock Deck
Unlock for access to all 34 flashcards in this deck.
Unlock Deck
k this deck
6
Figure:
Suppose you regress U.S.annual real GDP ($ billions)on U.S.annual real defense expenditures ($ millions)and that you get the following results.
Based on the Excel output in Figure 5.1,you should conclude that
A)the estimated intercept is statistically significant.
B)the estimated intercept is not statistically significant.
C)the estimated slope coefficient is not statistically significant.
D)the estimated sample regression function is not statistically significant.
Unlock Deck
Unlock for access to all 34 flashcards in this deck.
Unlock Deck
k this deck
7
A standard error is
A)the variance of the sampling distribution.
B)the standard deviation of the population distribution.
C)the standard deviation of the sampling distribution.
D)the variance of the population distribution.
A)the variance of the sampling distribution.
B)the standard deviation of the population distribution.
C)the standard deviation of the sampling distribution.
D)the variance of the population distribution.
Unlock Deck
Unlock for access to all 34 flashcards in this deck.
Unlock Deck
k this deck
8
A confidence interval is constructed
A)to bracket the sample mean.
B)to bracket the sample statistic.
C)to bracket the population parameter.
D)to bracket the margin of error.
A)to bracket the sample mean.
B)to bracket the sample statistic.
C)to bracket the population parameter.
D)to bracket the margin of error.
Unlock Deck
Unlock for access to all 34 flashcards in this deck.
Unlock Deck
k this deck
9
Figure:
Suppose you regress U.S.annual real GDP ($ billions)on U.S.annual real defense expenditures ($ millions)and that you get the following results.
Based on the Excel output in Figure 5.1,you should conclude that the estimated sample regression function is
A)statistically significant because 2.39636E - 06 < .05.
B)statistically significant because 26.403 > .05.
C)statistically insignificant because 2.39636E - 06 < .05.
D)statistically insignificant because 26.403 > .05.
Unlock Deck
Unlock for access to all 34 flashcards in this deck.
Unlock Deck
k this deck
10
The confidence interval method for hypothesis testing (at the 95% level)relies on the fact that
A)95 percent of all sample statistics are correct.
B)the observed sample statistic is correct 95 percent of the time.
C)there is a 95 percent chance that the calculated confidence interval contains the true value of the unobserved population parameter.
D)95 percent of all confidence intervals that could be constructed contain the true value of the unobserved population parameter.
Unlock Deck
Unlock for access to all 34 flashcards in this deck.
Unlock Deck
k this deck
11
An estimator is efficient if it
A)has the smallest variance of all unbiased estimators.
B)has a p-value is less than .05.
C)has a small standard error.
D)has the smallest mean squared error.
A)has the smallest variance of all unbiased estimators.
B)has a p-value is less than .05.
C)has a small standard error.
D)has the smallest mean squared error.
Unlock Deck
Unlock for access to all 34 flashcards in this deck.
Unlock Deck
k this deck
12
The logic behind the F-test for the overall significance of the estimated sample regression function is that if the estimated sample regression function explains a significant amount of the variation in the dependent variable,then
A)the regression F-statistic should be small.
B)the MSUnexplained should be large relative to the MSExplained.
C)the MSExplained should be large relative to the MSUnexplained.
D)total sum of squares should be large.
A)the regression F-statistic should be small.
B)the MSUnexplained should be large relative to the MSExplained.
C)the MSExplained should be large relative to the MSUnexplained.
D)total sum of squares should be large.
Unlock Deck
Unlock for access to all 34 flashcards in this deck.
Unlock Deck
k this deck
13
If we find that it is unlikely to observe the sample statistic that is actually observed if the null hypothesis is true,then we should
A)fail to reject the null hypothesis.
B)reject the null hypothesis.
C)reject the alternative hypothesis.
D)calculate a new sample statistic.
A)fail to reject the null hypothesis.
B)reject the null hypothesis.
C)reject the alternative hypothesis.
D)calculate a new sample statistic.
Unlock Deck
Unlock for access to all 34 flashcards in this deck.
Unlock Deck
k this deck
14
Figure:
Suppose you regress U.S.annual real GDP ($ billions)on U.S.annual real defense expenditures ($ millions)and that you get the following results.
Based on the Excel output in Figure 5.1,you should conclude that a
A)$1 million increase in real defense expenditures is estimated to be associated with a statistically significant $1,273.29 billion increase in real GDP,holding all else constant.
B)real GDP is estimated to be a statistically significant $1,273.29 billion when real defense expenditures are 0,holding all else constant.
C)$1 million increase in real defense expenditures is estimated to be associated with a statistically insignificant $13.659 million increase in real GDP,holding all else constant.
D)a $1 million increase in real defense expenditures is estimated to be associated with a statistically significant $13.659 million increase in real GDP,holding all else constant.
Unlock Deck
Unlock for access to all 34 flashcards in this deck.
Unlock Deck
k this deck
15
Figure:
Suppose you regress U.S.annual real GDP ($ billions)on U.S.annual real defense expenditures ($ millions)and that you get the following results.
Based on the Excel output in Figure 5.1,you should conclude that the estimated slope coefficient is
A)statistically insignificant because the 95% confidence interval contains the estimated slope coefficient.
B)statistically insignificant because 5.138 > .05.
C)statistically insignificant because 2.39636E - 06 < .05.
D)statistically significant because 2.39636E - 06 < .05.
Unlock Deck
Unlock for access to all 34 flashcards in this deck.
Unlock Deck
k this deck
16
When using the critical value method for hypothesis testing,if the value of the test statistic is less than the critical value,then you should
A)reject the null hypothesis.
B)fail to reject the null hypothesis.
C)choose a smaller critical value that is less than the test statistic.
D)calculate a new test statistic that exceeds the critical value.
A)reject the null hypothesis.
B)fail to reject the null hypothesis.
C)choose a smaller critical value that is less than the test statistic.
D)calculate a new test statistic that exceeds the critical value.
Unlock Deck
Unlock for access to all 34 flashcards in this deck.
Unlock Deck
k this deck
17
The p-value method for hypothesis testing relies on the fact that
A)if the null hypothesis is false,then it is very unlikely to observe a p-value smaller than the chosen significance level.
B)if the null hypothesis is true,then it is very unlikely to observe a p-value larger than the chosen significance level.
C)if the null hypothesis is true,then it is very unlikely to observe a p-value smaller than the chosen significance level.
D)if the alternative hypothesis is true,then it is very unlikely to observe a p-value smaller than the chosen significance level.
Unlock Deck
Unlock for access to all 34 flashcards in this deck.
Unlock Deck
k this deck
18
An estimator is unbiased if
A)the standard error is small.
B)the expected value of the estimator is equal to the true population parameter.
C)the p-value is less than .05.
D)the expected value of the estimator is equal to the sample statistic.
A)the standard error is small.
B)the expected value of the estimator is equal to the true population parameter.
C)the p-value is less than .05.
D)the expected value of the estimator is equal to the sample statistic.
Unlock Deck
Unlock for access to all 34 flashcards in this deck.
Unlock Deck
k this deck
19
When using the p-value method for hypothesis testing,if the calculated p-value is smaller than the chosen significance level,then you should
A)reject the null hypothesis.
B)fail to reject the null hypothesis.
C)choose a smaller significance level that is less than the p-value.
D)calculate a new p-value that is larger than the chosen significance level.
A)reject the null hypothesis.
B)fail to reject the null hypothesis.
C)choose a smaller significance level that is less than the p-value.
D)calculate a new p-value that is larger than the chosen significance level.
Unlock Deck
Unlock for access to all 34 flashcards in this deck.
Unlock Deck
k this deck
20
The t-statistic for the individual significance of the estimated slope coefficient
Is
A)the standard error of the estimated slope coefficient.
B)the estimated slope coefficient.
C)the ratio of the estimated slope coefficient to the standard error of the estimated slope coefficient.
D)the ratio of the estimated slope coefficient to the variance of the estimated slope coefficient.
Is
A)the standard error of the estimated slope coefficient.
B)the estimated slope coefficient.
C)the ratio of the estimated slope coefficient to the standard error of the estimated slope coefficient.
D)the ratio of the estimated slope coefficient to the variance of the estimated slope coefficient.
Unlock Deck
Unlock for access to all 34 flashcards in this deck.
Unlock Deck
k this deck
21
A counselor working with teenagers is interested in the relationship between anxiety and depression.The counselor administers a depression and anxiety test to each teenager.The scores obtained from the administration of the two inventories are given below.
If an individual had an anxiety score of 40,what is a 95% confidence interval for the mean predicted value?
If an individual had an anxiety score of 40,what is a 95% confidence interval for the mean predicted value?
Unlock Deck
Unlock for access to all 34 flashcards in this deck.
Unlock Deck
k this deck
22
Why is hypothesis testing is necessary? Explain.
Unlock Deck
Unlock for access to all 34 flashcards in this deck.
Unlock Deck
k this deck
23
Figure:
Suppose you regress U.S.annual real GDP ($ billions)on U.S.annual real defense expenditures ($ millions)and that you get the following results.
Based on the Excel output in Figure 5.1,the appropriate critical value for 95% confidence is
A)1.96.
B)t.05,70 = 1.67.
C)1.645.
D)t.025,70 = 2.00.
Suppose you regress U.S.annual real GDP ($ billions)on U.S.annual real defense expenditures ($ millions)and that you get the following results.
Based on the Excel output in Figure 5.1,the appropriate critical value for 95% confidence is
A)1.96.
B)t.05,70 = 1.67.
C)1.645.
D)t.025,70 = 2.00.
Unlock Deck
Unlock for access to all 34 flashcards in this deck.
Unlock Deck
k this deck
24
What is a sampling distribution? Why is it important? Explain.
Unlock Deck
Unlock for access to all 34 flashcards in this deck.
Unlock Deck
k this deck
25
Suppose you regress the number of days that individuals report having hunted in the past year on years of education and that you get the results in Figure 4.3.
What would you conclude about the statistical significance of the estimated sample regression function? The estimated intercept? The estimated slope coefficient? Explain.
What would you conclude about the statistical significance of the estimated sample regression function? The estimated intercept? The estimated slope coefficient? Explain.
Unlock Deck
Unlock for access to all 34 flashcards in this deck.
Unlock Deck
k this deck
26
What is the intuition behind the critical-value method of hypothesis testing? Explain.
Unlock Deck
Unlock for access to all 34 flashcards in this deck.
Unlock Deck
k this deck
27
What is the intuition behind the p-value method of hypothesis testing? Explain.
Unlock Deck
Unlock for access to all 34 flashcards in this deck.
Unlock Deck
k this deck
28
Suppose that you regress the total number of medals that a country won in the 2008 Olympics on GDP per capita and that you get the results in Figure 4.2.
What would you conclude about the statistical significance of the estimated sample regression function? The estimated intercept? The estimated slope coefficient? Explain.
What would you conclude about the statistical significance of the estimated sample regression function? The estimated intercept? The estimated slope coefficient? Explain.
Unlock Deck
Unlock for access to all 34 flashcards in this deck.
Unlock Deck
k this deck
29
What is the intuition behind the confidence interval method of hypothesis testing? Explain.
Unlock Deck
Unlock for access to all 34 flashcards in this deck.
Unlock Deck
k this deck
30
Figure
Suppose you regress obesity rates for the 50 states and the District of Columbia on the percentage of adults who have earned a Bachelor's degree and that you get the following results.
Based on the Excel output in Figure 5.2,you should conclude that the estimated slope coefficient is
A)statistically significant because -8.076 < .05.
B)statistically significant because -0.466 < .05.
C)statistically significant because |-8.076| > 1.96.
D)statistically insignificant because -0.466 is inside the 95% confidence interval.
Unlock Deck
Unlock for access to all 34 flashcards in this deck.
Unlock Deck
k this deck
31
Figure
Suppose you regress obesity rates for the 50 states and the District of Columbia on the percentage of adults who have earned a Bachelor's degree and that you get the following results.
Based on the Excel output in Figure 5.2,you should conclude that the estimated sample regression function is
A)statistically significant because 65.21 > .05.
B)statistically significant because 1.465E - 10 < .05.
C)statistically significant because 7.092E - 30 < .05.
D)statistically significant because 25.42 > 1.96.
Unlock Deck
Unlock for access to all 34 flashcards in this deck.
Unlock Deck
k this deck
32
Why are each of the individual simple linear regression model assumptions important? Explain.
Unlock Deck
Unlock for access to all 34 flashcards in this deck.
Unlock Deck
k this deck
33
How does the concept of a sampling distribution relate to the process of hypothesis testing? Explain.
Unlock Deck
Unlock for access to all 34 flashcards in this deck.
Unlock Deck
k this deck
34
Figure
Suppose you regress obesity rates for the 50 states and the District of Columbia on the percentage of adults who have earned a Bachelor's degree and that you get the following results.
Based on the Excel output in Figure 5.2,you should conclude that a
A)one percentage point increase in the percentage of adults with a Bachelor's degree is associated with a statistically insignificant 40.59 percent increase in the obesity rate,holding all else constant.
B)one percentage point increase in the percentage of adults with a Bachelor's degree is associated with a statistically significant 40.59 percent increase in the obesity rate,holding all else constant.
C)one percentage point increase in the percentage of adults with a Bachelor's degree is associated with a statistically insignificant .466 percentage point increase in the obesity rate,holding all else constant.
D)one percentage point increase in the percentage of adults with a Bachelor's degree is associated with a statistically significant .466 percentage point increase in the obesity rate,holding all else constant.
Unlock Deck
Unlock for access to all 34 flashcards in this deck.
Unlock Deck
k this deck
Unlock Deck
Unlock for access to all 34 flashcards in this deck.


