Deck 11: Income Inequality and Poverty
Full screen (f)
Question
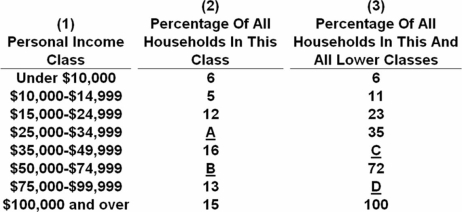
 Using the data in the above table,what percentage of households made $75,000-$99,999?
A) 11 percent
B) 13 percent
C) 16 percent
D) 85 percent
Question
Question
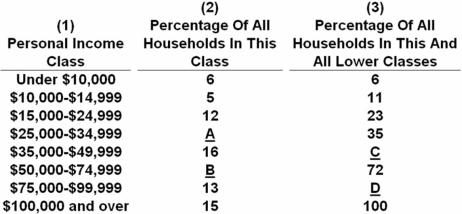
 Using the data in the above table,what percentage of households made less than $15,000?
A) 5 percent
B) 6 percent
C) 11 percent
D) 23 percent
Question
Question
Question
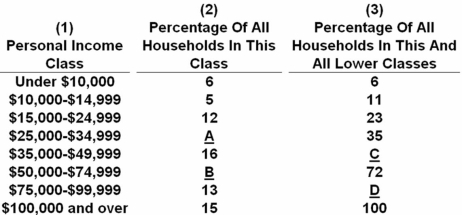
 Using the data in the above table,what percentage should be reported in blank D of column 3?
A) 21
B) 35
C) 85
D) 94
The blank in column 3 is found by adding the value in column 2 to the previous value in column 3.Thus,D is 72 + 13 = 85.
Question
Question
 Using the data in the above table,what percentage should be reported in blank A of column 2?
A) 5
B) 6
C) 12
D) 17
The blank in column 2 is found by subtracting the percentage in column 3 for the entry $25,000 - $34,999 from the previous percentage.Thus,A is 35 - 23 = 12.
Question
Question
 Using the data in the above table,what percentage of households made $100,000 or more?
A) 13 percent
B) 15 percent
C) 72 percent
D) 85 percent
Question
 Using the data in the above table,what percentage should be reported in blank C of column 3?
A) 6
B) 11
C) 35
D) 51
The blank in column 3 is found by adding the value in column 2 to the previous value in column 3.Thus,C is 35 + 16 = 51.
Question
Question
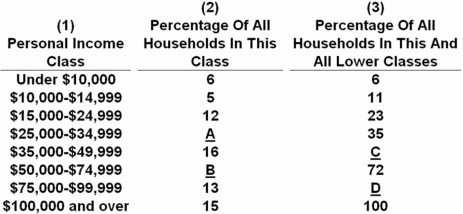
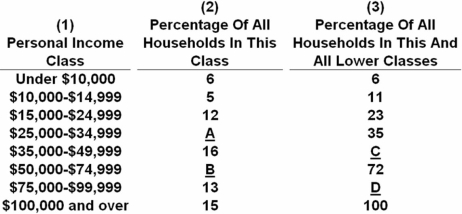 Using the data in the above table,what percentage of households made less than $35,000?
A) 5 percent
B) 12 percent
C) 35 percent
D) 51 percent
Question
Question
Question
Question
Question
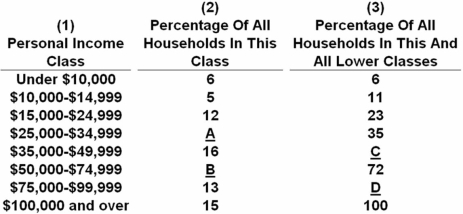 Using the data in the above table,what percentage should be reported in blank B of column 2?
A) 6
B) 16
C) 21
D) 25
The first step is to identify "C." C is the cumulative percentage of the previous class shown in column 3.It is found by adding the percentage in the relevant class (column 2)to the prior cumulative percentage (column 3).C = 35 + 16 = 51.The blank in column 2 is then found by subtracting the cumulative percentage in column 3 for the entry $50,000-$74,999 from that in the previous class.B = 72 - 51 = 21.
Question
Question
Question
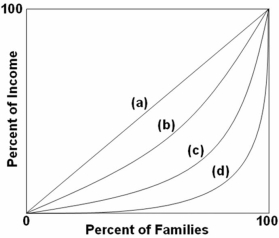 Refer to the above graph.If a curve shifted from (d)to (b),then the Gini ratio would:
A) increase.
B) decrease.
C) remain constant.
D) become negative.
Question
 Refer to the above graph,which shows four different Lorenz curves (I,II,III,and IV).Which change would indicate that there has been an increase in income equality? A movement from point:
A) c to a.
B) a to d.
C) d to a.
D) b to e.
Question
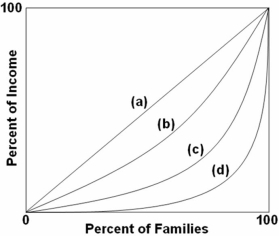 Refer to the above graph.The Gini ratio would be 0 for which curve?
A) a
B) b
C) c
D) d
Question
 Refer to the above graph,which shows four different Lorenz curves (I,II,III,and IV).The movement from point b to point e in the graph would indicate that:
A) 80 percent of households now receive 40 percent of income instead of 60 percent of households.
B) 80 percent of income goes to 40 percent of households instead of 60 percent of households.
C) 40 percent of income goes to 60 percent of households instead of 80 percent of households.
D) 60 percent of households now receive 20 percent instead of 60 percent of income.
Question
 Refer to the above graph,which shows four different Lorenz curves (I,II,III,and IV).The greatest increase in income inequality would occur with a shift in a Lorenz curve from:
A) II to III.
B) II to IV.
C) IV to III.
D) IV to I.
Question
Question
Question
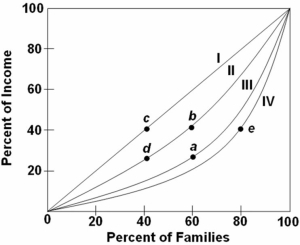 Refer to the above graph,which shows four different Lorenz curves (I,II,III,and IV).What point indicates that 60 percent of the households receive only 40 percent of the income?
A) a
B) b
C) c
D) d
Question
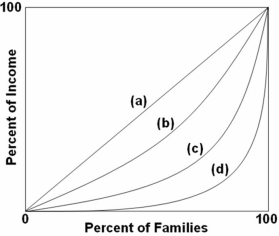 Refer to the above graph.If a curve shifted from (b)to (d),then the Gini ratio would:
A) increase.
B) decrease.
C) remain constant.
D) become negative.
Question
Question
 Refer to the above graph.The Gini ratio would be greatest for which curve?
A) a
B) b
C) c
D) d
Question
Question
Question
Question
Question
Question
 Refer to the above graph.A nation that has an income distribution of perfect equality would be represented by the above curve:
A) a.
B) b.
C) c.
D) d.
Question
 Refer to the above graph.Venezuela has a very small number of extremely wealthy households and an extremely large number of very poor households.If the United States is represented by Lorenz curve (C)above,which curve would represent Venezuela?
A) a
B) b
C) c
D) d
Question
 Refer to the above graph.If the United States is represented by Lorenz curve (C.above,which curve would represent most other industrially advanced nations?
A) a
B) b
C) c
D) d
Question
Question
Question
Question
Question
Question
Question
Question
Question
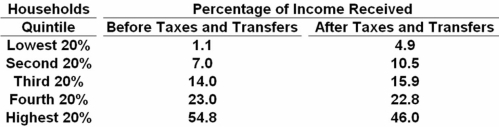 Refer to the above table.It shows that:
A) income inequality increased after taxes and transfers are taken into account.
B) income inequality decreased after taxes and transfers are taken into account.
C) income received by the highest 20 percent of households increased after taxes and transfers.
D) income received by the lowest 20 percent of households decreased after taxes and transfers.
Question
 Refer to the above table.The decline in percentage of income received from before taxes and transfers to after taxes and transfers is greatest for the:
A) second 20 percent of households.
B) third 20 percent of households.
C) fourth 20 percent of households.
D) highest 20 percent of households.
Question
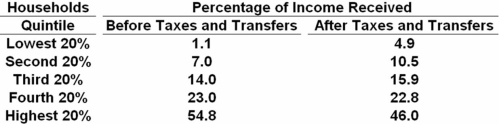 Refer to the above table.Before taxes and transfers:
A) the highest 20 percent of households received 46.0 percent of income.
B) the highest 20 percent of households received 54.8 percent of income.
C) the lowest 20 percent of households received 70 percent of income.
D) the lowest 20 percent of households received 4.9 percent of income.
Question
Question
Question
Question
Question
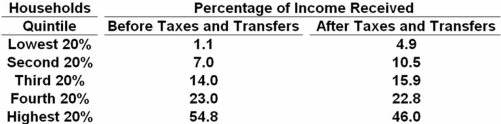 Refer to the above table.The rise in percentage of income received from before taxes and transfers to after taxes and transfers is greatest for the:
A) lowest 20 percent of households.
B) third 20 percent of households.
C) fourth 20 percent of households.
D) highest 20 percent of households.
Question
Question
Question
Question
Question
Question
Question
Question
Question
Question
Question
Question
Question
Question
Question
Question
Question
Question
Question
Question
Question
Question
Question
Question
Question

Unlock Deck
Sign up to unlock the cards in this deck!
Unlock Deck
Unlock Deck
1/158
Play
Full screen (f)
Deck 11: Income Inequality and Poverty
1
Using the data in the above table,what percentage of households made $75,000-$99,999?A) 11 percent
B) 13 percent
C) 16 percent
D) 85 percent
B
2
Based on 2009 data on the distribution of personal income:
A) 7 percent of all households receive $100,000 and above.
B) 17 percent of all households receive $100,000 and above.
C) 20 percent of all households receive $100,000 and above.
D) 26 percent of all households receive $100,000 and above.
A) 7 percent of all households receive $100,000 and above.
B) 17 percent of all households receive $100,000 and above.
C) 20 percent of all households receive $100,000 and above.
D) 26 percent of all households receive $100,000 and above.
C
3
Using the data in the above table,what percentage of households made less than $15,000?A) 5 percent
B) 6 percent
C) 11 percent
D) 23 percent
C
4
The average household income in the United States in 2009 was:
A) $27,876.
B) $34,231.
C) $52,025.
D) $67,570.
A) $27,876.
B) $34,231.
C) $52,025.
D) $67,570.
Unlock Deck
Unlock for access to all 158 flashcards in this deck.
Unlock Deck
k this deck
5
The percentage of total before-tax income received by the lowest 20 percent of households in 2009 was about:
A) 1.8 percent.
B) 3.4 percent.
C) 8.7 percent.
D) 22.9 percent.
A) 1.8 percent.
B) 3.4 percent.
C) 8.7 percent.
D) 22.9 percent.
Unlock Deck
Unlock for access to all 158 flashcards in this deck.
Unlock Deck
k this deck
6
Using the data in the above table,what percentage should be reported in blank D of column 3?A) 21
B) 35
C) 85
D) 94
The blank in column 3 is found by adding the value in column 2 to the previous value in column 3.Thus,D is 72 + 13 = 85.
Unlock Deck
Unlock for access to all 158 flashcards in this deck.
Unlock Deck
k this deck
7
The Lorenz curve is a graph that shows the:
A) distribution of wealth.
B) degree of income inequality.
C) effect of discrimination on incomes.
D) trade-off between equality and efficiency.
A) distribution of wealth.
B) degree of income inequality.
C) effect of discrimination on incomes.
D) trade-off between equality and efficiency.
Unlock Deck
Unlock for access to all 158 flashcards in this deck.
Unlock Deck
k this deck
8
Using the data in the above table,what percentage should be reported in blank A of column 2?A) 5
B) 6
C) 12
D) 17
The blank in column 2 is found by subtracting the percentage in column 3 for the entry $25,000 - $34,999 from the previous percentage.Thus,A is 35 - 23 = 12.
Unlock Deck
Unlock for access to all 158 flashcards in this deck.
Unlock Deck
k this deck
9
A Lorenz curve shows:
A) the tax and transfer trade-off.
B) how many households are living in poverty.
C) perfect income equality.
D) the distribution of income.
A) the tax and transfer trade-off.
B) how many households are living in poverty.
C) perfect income equality.
D) the distribution of income.
Unlock Deck
Unlock for access to all 158 flashcards in this deck.
Unlock Deck
k this deck
10
Using the data in the above table,what percentage of households made $100,000 or more?A) 13 percent
B) 15 percent
C) 72 percent
D) 85 percent
Unlock Deck
Unlock for access to all 158 flashcards in this deck.
Unlock Deck
k this deck
11
Using the data in the above table,what percentage should be reported in blank C of column 3?A) 6
B) 11
C) 35
D) 51
The blank in column 3 is found by adding the value in column 2 to the previous value in column 3.Thus,C is 35 + 16 = 51.
Unlock Deck
Unlock for access to all 158 flashcards in this deck.
Unlock Deck
k this deck
12
In 2009,about what percentage of households had personal income of $50,000-$74,999?
A) 2 percent
B) 5 percent
C) 11 percent
D) 18 percent
A) 2 percent
B) 5 percent
C) 11 percent
D) 18 percent
Unlock Deck
Unlock for access to all 158 flashcards in this deck.
Unlock Deck
k this deck
13
Using the data in the above table,what percentage of households made less than $35,000?A) 5 percent
B) 12 percent
C) 35 percent
D) 51 percent
Unlock Deck
Unlock for access to all 158 flashcards in this deck.
Unlock Deck
k this deck
14
The greater the degree of inequality in the size distribution of income,the more bowed will be the Lorenz curve toward the:
A) upper left-hand corner.
B) upper right-hand corner.
C) lower right-hand corner.
D) lower left-hand corner.
A) upper left-hand corner.
B) upper right-hand corner.
C) lower right-hand corner.
D) lower left-hand corner.
Unlock Deck
Unlock for access to all 158 flashcards in this deck.
Unlock Deck
k this deck
15
The percentage of total before-tax income received by the highest 20 percent of households in 2009 was about:
A) 21 percent.
B) 50 percent.
C) 61 percent.
D) 82 percent.
A) 21 percent.
B) 50 percent.
C) 61 percent.
D) 82 percent.
Unlock Deck
Unlock for access to all 158 flashcards in this deck.
Unlock Deck
k this deck
16
A progressive income tax would cause the after-tax Lorenz curve,compared with the before-tax Lorenz curve,to be:
A) more bowed toward the southeast.
B) less bowed to the southeast.
C) a vertical line.
D) a horizontal line.
A) more bowed toward the southeast.
B) less bowed to the southeast.
C) a vertical line.
D) a horizontal line.
Unlock Deck
Unlock for access to all 158 flashcards in this deck.
Unlock Deck
k this deck
17
The difference between the 45-degree line and the Lorenz curve shows the:
A) inflationary gap.
B) recessionary gap.
C) number of households that are classified as being poor.
D) degree of income inequality.
A) inflationary gap.
B) recessionary gap.
C) number of households that are classified as being poor.
D) degree of income inequality.
Unlock Deck
Unlock for access to all 158 flashcards in this deck.
Unlock Deck
k this deck
18
Using the data in the above table,what percentage should be reported in blank B of column 2?A) 6
B) 16
C) 21
D) 25
The first step is to identify "C." C is the cumulative percentage of the previous class shown in column 3.It is found by adding the percentage in the relevant class (column 2)to the prior cumulative percentage (column 3).C = 35 + 16 = 51.The blank in column 2 is then found by subtracting the cumulative percentage in column 3 for the entry $50,000-$74,999 from that in the previous class.B = 72 - 51 = 21.
Unlock Deck
Unlock for access to all 158 flashcards in this deck.
Unlock Deck
k this deck
19
A Lorenz curve showing perfect equality in the distribution of income:
A) coincides with the horizontal axis.
B) coincides with the vertical axis.
C) is a straight line with a 45-degree angle.
D) is a curve bowed to the southwest.
A) coincides with the horizontal axis.
B) coincides with the vertical axis.
C) is a straight line with a 45-degree angle.
D) is a curve bowed to the southwest.
Unlock Deck
Unlock for access to all 158 flashcards in this deck.
Unlock Deck
k this deck
20
In 2009,about what percentage of households had personal income of $100,000 or more?
A) 3 percent
B) 8 percent
C) 16 percent
D) 20 percent
A) 3 percent
B) 8 percent
C) 16 percent
D) 20 percent
Unlock Deck
Unlock for access to all 158 flashcards in this deck.
Unlock Deck
k this deck
21
Refer to the above graph.If a curve shifted from (d)to (b),then the Gini ratio would:A) increase.
B) decrease.
C) remain constant.
D) become negative.
Unlock Deck
Unlock for access to all 158 flashcards in this deck.
Unlock Deck
k this deck
22
Refer to the above graph,which shows four different Lorenz curves (I,II,III,and IV).Which change would indicate that there has been an increase in income equality? A movement from point:A) c to a.
B) a to d.
C) d to a.
D) b to e.
Unlock Deck
Unlock for access to all 158 flashcards in this deck.
Unlock Deck
k this deck
23
Refer to the above graph.The Gini ratio would be 0 for which curve?A) a
B) b
C) c
D) d
Unlock Deck
Unlock for access to all 158 flashcards in this deck.
Unlock Deck
k this deck
24
Refer to the above graph,which shows four different Lorenz curves (I,II,III,and IV).The movement from point b to point e in the graph would indicate that:A) 80 percent of households now receive 40 percent of income instead of 60 percent of households.
B) 80 percent of income goes to 40 percent of households instead of 60 percent of households.
C) 40 percent of income goes to 60 percent of households instead of 80 percent of households.
D) 60 percent of households now receive 20 percent instead of 60 percent of income.
Unlock Deck
Unlock for access to all 158 flashcards in this deck.
Unlock Deck
k this deck
25
Refer to the above graph,which shows four different Lorenz curves (I,II,III,and IV).The greatest increase in income inequality would occur with a shift in a Lorenz curve from:A) II to III.
B) II to IV.
C) IV to III.
D) IV to I.
Unlock Deck
Unlock for access to all 158 flashcards in this deck.
Unlock Deck
k this deck
26
The Gini ratio is determined by:
A) adding the area between the Lorenz curve and the diagonal to the total area below the diagonal.
B) dividing the area between the Lorenz curve and the diagonal by the total area below the diagonal.
C) multiplying the area between the Lorenz curve and the diagonal by the total area below the diagonal.
D) subtracting the area between the Lorenz curve and the diagonal from the total area below the diagonal.
Unlock Deck
Unlock for access to all 158 flashcards in this deck.
Unlock Deck
k this deck
27
Complete income equality using the Gini ratio would be reflected by a value of:
A) 3.
B) 2.
C) 1.
D) 0.
A) 3.
B) 2.
C) 1.
D) 0.
Unlock Deck
Unlock for access to all 158 flashcards in this deck.
Unlock Deck
k this deck
28
Refer to the above graph,which shows four different Lorenz curves (I,II,III,and IV).What point indicates that 60 percent of the households receive only 40 percent of the income?A) a
B) b
C) c
D) d
Unlock Deck
Unlock for access to all 158 flashcards in this deck.
Unlock Deck
k this deck
29
Refer to the above graph.If a curve shifted from (b)to (d),then the Gini ratio would:A) increase.
B) decrease.
C) remain constant.
D) become negative.
Unlock Deck
Unlock for access to all 158 flashcards in this deck.
Unlock Deck
k this deck
30
Complete income inequality using the Gini ratio would be reflected by a value of:
A) 2.
B) 3.
C) 0.
D) 1.
A) 2.
B) 3.
C) 0.
D) 1.
Unlock Deck
Unlock for access to all 158 flashcards in this deck.
Unlock Deck
k this deck
31
Refer to the above graph.The Gini ratio would be greatest for which curve?A) a
B) b
C) c
D) d
Unlock Deck
Unlock for access to all 158 flashcards in this deck.
Unlock Deck
k this deck
32
As the area between the Lorenz curve and diagonal gets smaller,the Gini ratio:
A) rises to reflect greater equality.
B) rises to reflect greater inequality.
C) falls to reflect greater inequality.
D) falls to reflect greater equality.
A) rises to reflect greater equality.
B) rises to reflect greater inequality.
C) falls to reflect greater inequality.
D) falls to reflect greater equality.
Unlock Deck
Unlock for access to all 158 flashcards in this deck.
Unlock Deck
k this deck
33
The Lorenz curve is helpful in visualizing the:
A) trade-off between unemployment and inflation.
B) relationship between the prices received and paid by farmers.
C) degree of inequality in the distribution of income.
D) relationship between education and income.
A) trade-off between unemployment and inflation.
B) relationship between the prices received and paid by farmers.
C) degree of inequality in the distribution of income.
D) relationship between education and income.
Unlock Deck
Unlock for access to all 158 flashcards in this deck.
Unlock Deck
k this deck
34
The diagonal line in a Lorenz curve represents perfect:
A) inequality in the distribution of personal income.
B) equality in the distribution of personal income.
C) inequality in factor shares of personal income.
D) equality in factor shares of personal income.
A) inequality in the distribution of personal income.
B) equality in the distribution of personal income.
C) inequality in factor shares of personal income.
D) equality in factor shares of personal income.
Unlock Deck
Unlock for access to all 158 flashcards in this deck.
Unlock Deck
k this deck
35
The degree of inequality in the distribution of income in an economy is depicted in a:
A) Lorenz curve.
B) Phillips curve.
C) Laffer curve.
D) supply curve.
A) Lorenz curve.
B) Phillips curve.
C) Laffer curve.
D) supply curve.
Unlock Deck
Unlock for access to all 158 flashcards in this deck.
Unlock Deck
k this deck
36
Which of the following Gini ratios would indicate the least amount of income inequality?
A) 0.20
B) 0.40
C) 0.60
D) 0.80
A) 0.20
B) 0.40
C) 0.60
D) 0.80
Unlock Deck
Unlock for access to all 158 flashcards in this deck.
Unlock Deck
k this deck
37
Refer to the above graph.A nation that has an income distribution of perfect equality would be represented by the above curve:A) a.
B) b.
C) c.
D) d.
Unlock Deck
Unlock for access to all 158 flashcards in this deck.
Unlock Deck
k this deck
38
Refer to the above graph.Venezuela has a very small number of extremely wealthy households and an extremely large number of very poor households.If the United States is represented by Lorenz curve (C)above,which curve would represent Venezuela?A) a
B) b
C) c
D) d
Unlock Deck
Unlock for access to all 158 flashcards in this deck.
Unlock Deck
k this deck
39
Refer to the above graph.If the United States is represented by Lorenz curve (C.above,which curve would represent most other industrially advanced nations?A) a
B) b
C) c
D) d
Unlock Deck
Unlock for access to all 158 flashcards in this deck.
Unlock Deck
k this deck
40
As the area between the Lorenz curve and diagonal gets larger,the Gini ratio:
A) rises to reflect greater equality.
B) rises to reflect greater inequality.
C) falls to reflect greater inequality.
D) falls to reflect greater equality.
A) rises to reflect greater equality.
B) rises to reflect greater inequality.
C) falls to reflect greater inequality.
D) falls to reflect greater equality.
Unlock Deck
Unlock for access to all 158 flashcards in this deck.
Unlock Deck
k this deck
41
Which would be a significant cause of income inequality in the United States?
A) Housing
B) Discrimination
C) In-kind transfers
D) Social Security
A) Housing
B) Discrimination
C) In-kind transfers
D) Social Security
Unlock Deck
Unlock for access to all 158 flashcards in this deck.
Unlock Deck
k this deck
42
Differences in "job preferences" and "job risks":
A) illustrate the trade-off between equality and efficiency.
B) can be used to broaden the concept of income.
C) result from government transfer programs.
D) are a cause of income inequality.
A) illustrate the trade-off between equality and efficiency.
B) can be used to broaden the concept of income.
C) result from government transfer programs.
D) are a cause of income inequality.
Unlock Deck
Unlock for access to all 158 flashcards in this deck.
Unlock Deck
k this deck
43
Earnings from wealth:
A) contribute to income inequality.
B) are the major source of family income.
C) are becoming more equal in the society.
D) are primarily the result of advanced education.
A) contribute to income inequality.
B) are the major source of family income.
C) are becoming more equal in the society.
D) are primarily the result of advanced education.
Unlock Deck
Unlock for access to all 158 flashcards in this deck.
Unlock Deck
k this deck
44
Suppose that Jennifer earns $10,000 in year 1 and $40,000 in year 2,while Shawna earns $40,000 in year 1 and only $10,000 in year 2.Is there income inequality for the two individuals?
A) The yearly data and the data over the two years indicate equality.
B) The yearly data and the data over the two years indicate inequality.
C) The yearly data indicate equality,but the data over the two years indicate inequality.
D) The yearly data indicate inequality,but the data over the two years indicate equality.
Unlock Deck
Unlock for access to all 158 flashcards in this deck.
Unlock Deck
k this deck
45
Taxes and transfer payments:
A) reduce the degree of income inequality.
B) increase the degree of income inequality.
C) have no effect upon the location of the Lorenz curve.
D) make the Lorenz curve a straight 45-degree line.
A) reduce the degree of income inequality.
B) increase the degree of income inequality.
C) have no effect upon the location of the Lorenz curve.
D) make the Lorenz curve a straight 45-degree line.
Unlock Deck
Unlock for access to all 158 flashcards in this deck.
Unlock Deck
k this deck
46
A government payment in the form of goods and services rather than money is a(n):
A) earned income tax credit.
B) benefit reduction.
C) noncash transfer.
D) work incentive.
A) earned income tax credit.
B) benefit reduction.
C) noncash transfer.
D) work incentive.
Unlock Deck
Unlock for access to all 158 flashcards in this deck.
Unlock Deck
k this deck
47
Two major criticisms of the Bureau of Census data as a portrayal of the degree of income inequality are that the income concept employed is too:
A) broad and the income accounting period is too short.
B) narrow and the income accounting period is too long.
C) narrow and the income accounting period is too short.
D) broad and the income accounting period is too long.
A) broad and the income accounting period is too short.
B) narrow and the income accounting period is too long.
C) narrow and the income accounting period is too short.
D) broad and the income accounting period is too long.
Unlock Deck
Unlock for access to all 158 flashcards in this deck.
Unlock Deck
k this deck
48
Refer to the above table.It shows that:A) income inequality increased after taxes and transfers are taken into account.
B) income inequality decreased after taxes and transfers are taken into account.
C) income received by the highest 20 percent of households increased after taxes and transfers.
D) income received by the lowest 20 percent of households decreased after taxes and transfers.
Unlock Deck
Unlock for access to all 158 flashcards in this deck.
Unlock Deck
k this deck
49
Refer to the above table.The decline in percentage of income received from before taxes and transfers to after taxes and transfers is greatest for the:A) second 20 percent of households.
B) third 20 percent of households.
C) fourth 20 percent of households.
D) highest 20 percent of households.
Unlock Deck
Unlock for access to all 158 flashcards in this deck.
Unlock Deck
k this deck
50
Refer to the above table.Before taxes and transfers:A) the highest 20 percent of households received 46.0 percent of income.
B) the highest 20 percent of households received 54.8 percent of income.
C) the lowest 20 percent of households received 70 percent of income.
D) the lowest 20 percent of households received 4.9 percent of income.
Unlock Deck
Unlock for access to all 158 flashcards in this deck.
Unlock Deck
k this deck
51
When the distribution of income is adjusted for noncash transfers,the income distribution shows:
A) perfect equality.
B) greater equality.
C) greater inequality.
D) little,if any,change.
A) perfect equality.
B) greater equality.
C) greater inequality.
D) little,if any,change.
Unlock Deck
Unlock for access to all 158 flashcards in this deck.
Unlock Deck
k this deck
52
Suppose that Jane earns $10,000 in year 1 and $100,000 in year 2,while Jim earns $100,000 in year 1 and $10,000 in year 2.Is there income equality for the two individuals?
A) The annual data indicate equality,but the two-year data indicate inequality.
B) The annual data indicate inequality,but the two-year data indicate equality.
C) Both the annual and the two-year data indicate equality.
D) Both the annual and the two-year data indicate inequality.
A) The annual data indicate equality,but the two-year data indicate inequality.
B) The annual data indicate inequality,but the two-year data indicate equality.
C) Both the annual and the two-year data indicate equality.
D) Both the annual and the two-year data indicate inequality.
Unlock Deck
Unlock for access to all 158 flashcards in this deck.
Unlock Deck
k this deck
53
A cause of the unequal distribution of income in the United States is:
A) differences in preferences and risks.
B) differences in noncash transfers.
C) high expenditures for social insurance.
D) a low benefit-reduction rate for income.
A) differences in preferences and risks.
B) differences in noncash transfers.
C) high expenditures for social insurance.
D) a low benefit-reduction rate for income.
Unlock Deck
Unlock for access to all 158 flashcards in this deck.
Unlock Deck
k this deck
54
The degree of inequality in the distribution of annual income is:
A) understated because it does not take into account wages and salaries.
B) overstated because it does not take into account how income changes over time.
C) understated because it does not take into account how income changes over time.
D) overstated because it does not take into account wages and salaries.
Unlock Deck
Unlock for access to all 158 flashcards in this deck.
Unlock Deck
k this deck
55
Refer to the above table.The rise in percentage of income received from before taxes and transfers to after taxes and transfers is greatest for the:A) lowest 20 percent of households.
B) third 20 percent of households.
C) fourth 20 percent of households.
D) highest 20 percent of households.
Unlock Deck
Unlock for access to all 158 flashcards in this deck.
Unlock Deck
k this deck
56
When taxes and transfer payments are taken into account,the distribution of income in the United States:
A) is unchanged.
B) is less equally distributed.
C) is more equally distributed.
D) becomes more beneficial for the wealthy.
A) is unchanged.
B) is less equally distributed.
C) is more equally distributed.
D) becomes more beneficial for the wealthy.
Unlock Deck
Unlock for access to all 158 flashcards in this deck.
Unlock Deck
k this deck
57
One of the major causes of income inequality is the difference in:
A) unemployment benefits.
B) transportation.
C) education.
D) housing.
A) unemployment benefits.
B) transportation.
C) education.
D) housing.
Unlock Deck
Unlock for access to all 158 flashcards in this deck.
Unlock Deck
k this deck
58
Which contributes more to the reduction of income inequality?
A) Taxes
B) Wealth
C) Transfer payments
D) Earned income tax credits
A) Taxes
B) Wealth
C) Transfer payments
D) Earned income tax credits
Unlock Deck
Unlock for access to all 158 flashcards in this deck.
Unlock Deck
k this deck
59
The empirical data indicate that the tax system and the transfer programs of the government:
A) increase the degree of inequality in the distribution of income.
B) make no change in the degree of inequality in the distribution of income.
C) reduce the degree of inequality in the distribution of income.
D) affect the distribution of wealth,not income.
A) increase the degree of inequality in the distribution of income.
B) make no change in the degree of inequality in the distribution of income.
C) reduce the degree of inequality in the distribution of income.
D) affect the distribution of wealth,not income.
Unlock Deck
Unlock for access to all 158 flashcards in this deck.
Unlock Deck
k this deck
60
Which is an example of a noncash transfer?
A) An inheritance of $1 million
B) Payments for labor services rendered
C) Postage stamps
D) Medicare
A) An inheritance of $1 million
B) Payments for labor services rendered
C) Postage stamps
D) Medicare
Unlock Deck
Unlock for access to all 158 flashcards in this deck.
Unlock Deck
k this deck
61
A flow of wages and salary earnings,along with rent,interest,and profits,is:
A) wealth.
B) income.
C) transfers.
D) utility.
A) wealth.
B) income.
C) transfers.
D) utility.
Unlock Deck
Unlock for access to all 158 flashcards in this deck.
Unlock Deck
k this deck
62
Which would be considered part of wealth?
A) Wages and salaries
B) Rental payments
C) Profits from a corporation
D) Corporate stock holdings
A) Wages and salaries
B) Rental payments
C) Profits from a corporation
D) Corporate stock holdings
Unlock Deck
Unlock for access to all 158 flashcards in this deck.
Unlock Deck
k this deck
63
Suppose Tracy obtains 7 units of utility from the last dollar of income she receives and Brent obtains 7 units of utility from his last dollar of income.Assume both Brent and Tracy have the same capacity to derive utility from income with identical marginal-utility-of-income-curves.Those who favor an equal distribution of income would:
A) advocate redistributing income from Brent to Tracy.
B) advocate redistributing income from Tracy to Brent.
C) be content with this distribution of income between Tracy and Brent.
D) argue that any redistribution of income between them would increase total utility.
A) advocate redistributing income from Brent to Tracy.
B) advocate redistributing income from Tracy to Brent.
C) be content with this distribution of income between Tracy and Brent.
D) argue that any redistribution of income between them would increase total utility.
Unlock Deck
Unlock for access to all 158 flashcards in this deck.
Unlock Deck
k this deck
64
The necessity to maintain incentives to work and incentives to produce output would be a point made by an individual making the case for:
A) income equality.
B) income inequality.
C) maximization of total utility.
D) maximization of marginal utility.
A) income equality.
B) income inequality.
C) maximization of total utility.
D) maximization of marginal utility.
Unlock Deck
Unlock for access to all 158 flashcards in this deck.
Unlock Deck
k this deck
65
Which would best be considered part of income?
A) Wages and salaries
B) The value of one's home
C) Corporate stock holdings
D) Money in a bank account
A) Wages and salaries
B) The value of one's home
C) Corporate stock holdings
D) Money in a bank account
Unlock Deck
Unlock for access to all 158 flashcards in this deck.
Unlock Deck
k this deck
66
What would be an example of how pure luck contributes to income inequality?
A) Approval to receive unemployment benefits
B) Receipt of a government grant for housing
C) Selection as winner of a state lottery
D) Admission to a state university
A) Approval to receive unemployment benefits
B) Receipt of a government grant for housing
C) Selection as winner of a state lottery
D) Admission to a state university
Unlock Deck
Unlock for access to all 158 flashcards in this deck.
Unlock Deck
k this deck
67
Which is one cause of the unequal distribution of income in the United States?
A) Income mobility over time
B) Differences in preferences for work and leisure
C) The high levels of noncash transfers
D) The low benefit-reduction rate
A) Income mobility over time
B) Differences in preferences for work and leisure
C) The high levels of noncash transfers
D) The low benefit-reduction rate
Unlock Deck
Unlock for access to all 158 flashcards in this deck.
Unlock Deck
k this deck
68
Suppose Rita obtains 10 units of utility from the last dollar of income she receives and David obtains 6 units of utility from his last dollar of income.Assume both David and Rita have the same capacity to derive utility from income with identical marginal-utility-of-income-curves.Those who favor an equal distribution of income would:
A) advocate redistributing income from David to Rita.
B) advocate redistributing income from Rita to David.
C) be content with this distribution of income between Rita and David.
D) argue that any redistribution of income between them would increase total utility.
A) advocate redistributing income from David to Rita.
B) advocate redistributing income from Rita to David.
C) be content with this distribution of income between Rita and David.
D) argue that any redistribution of income between them would increase total utility.
Unlock Deck
Unlock for access to all 158 flashcards in this deck.
Unlock Deck
k this deck
69
Which of the following is not one of the causes of the unequal distribution of income in the United States?
A) Ability differences
B) Job preferences and job risks
C) Education and training
D) The dispersion of market power
A) Ability differences
B) Job preferences and job risks
C) Education and training
D) The dispersion of market power
Unlock Deck
Unlock for access to all 158 flashcards in this deck.
Unlock Deck
k this deck
70
"A more equal distribution of income in the United States would result in greater total consumer satisfaction." This statement is based on the concept that:
A) income inequality is unfair.
B) income inequality is undemocratic.
C) income equality stimulates efficiency.
D) incomes are subject to diminishing marginal utility.
A) income inequality is unfair.
B) income inequality is undemocratic.
C) income equality stimulates efficiency.
D) incomes are subject to diminishing marginal utility.
Unlock Deck
Unlock for access to all 158 flashcards in this deck.
Unlock Deck
k this deck
71
The equality-efficiency trade-off would be most closely associated with which one of the following statements?
A) The rich get richer and the poor get poorer.
B) The only way to create income equality is to take from the rich and give to the poor.
C) If cutting the income pie in more equal slices tends to shrink the pie,what amount of shrinkage will society tolerate?
D) People are less concerned with the larger question of income distribution than they are with the more specific issue of income inadequacy.
Unlock Deck
Unlock for access to all 158 flashcards in this deck.
Unlock Deck
k this deck
72
Greater income equality that is achieved through the redistribution of income is thought to:
A) stimulate innovation and entrepreneurship.
B) promote economic efficiency in the economy.
C) increase incentives to work,save,and invest in the economy.
D) come at the opportunity cost of reduced production and income.
A) stimulate innovation and entrepreneurship.
B) promote economic efficiency in the economy.
C) increase incentives to work,save,and invest in the economy.
D) come at the opportunity cost of reduced production and income.
Unlock Deck
Unlock for access to all 158 flashcards in this deck.
Unlock Deck
k this deck
73
What is a major reason for growing income inequality in the United States?
A) Higher marginal tax rates
B) Unemployment benefits
C) More skilled workers
D) Import competition
A) Higher marginal tax rates
B) Unemployment benefits
C) More skilled workers
D) Import competition
Unlock Deck
Unlock for access to all 158 flashcards in this deck.
Unlock Deck
k this deck
74
Which is a cause of growing income inequality in the United States in the last decade?
A) Competition in exporting to other countries among several major industries
B) Industrial restructuring from services to goods production
C) A widening wage gap between skilled and unskilled workers
D) An increase in the progressivity of the federal tax system
A) Competition in exporting to other countries among several major industries
B) Industrial restructuring from services to goods production
C) A widening wage gap between skilled and unskilled workers
D) An increase in the progressivity of the federal tax system
Unlock Deck
Unlock for access to all 158 flashcards in this deck.
Unlock Deck
k this deck
75
A stock reflecting,at a given time,the financial and real assets an individual has accumulated is:
A) income.
B) wealth.
C) preferences.
D) noncash transfers.
A) income.
B) wealth.
C) preferences.
D) noncash transfers.
Unlock Deck
Unlock for access to all 158 flashcards in this deck.
Unlock Deck
k this deck
76
The wages and salaries that people earn differ partly because of differences in:
A) wealth.
B) ability.
C) Social Security payments.
D) in-kind transfer payments.
A) wealth.
B) ability.
C) Social Security payments.
D) in-kind transfer payments.
Unlock Deck
Unlock for access to all 158 flashcards in this deck.
Unlock Deck
k this deck
77
Which would be evidence of more income inequality over time in the United States?
A) An increase in the percentage of total personal income received by the lowest quintile
B) An increase in the percentage of total personal income received by the highest quintile
C) An increase in the percentage of total personal income received by the four lowest quintiles
D) A decrease in the percentage of total personal income received by the highest quintile
Unlock Deck
Unlock for access to all 158 flashcards in this deck.
Unlock Deck
k this deck
78
Suppose that Teresa Thomas obtains 12 units of utility from the last dollar of income she receives,while Richard Voote obtains 7 units of utility from the last dollar of his income.Both have identical marginal-utility-of-income-curves.Those who:
A) favor an equal distribution of income would advocate redistributing income from Richard to Teresa.
B) favor an equal distribution of income would advocate redistributing income from Teresa to Richard.
C) favor an equal distribution of income would be content with the distribution of income between Teresa and Richard.
D) do not favor an equal distribution of income would argue that any redistribution between Teresa and Richard would increase total utility.
Unlock Deck
Unlock for access to all 158 flashcards in this deck.
Unlock Deck
k this deck
79
The debate over income distribution focuses on the trade-off between:
A) unemployment and economic freedom.
B) equality and economic growth.
C) economic efficiency and equality.
D) unemployment and economic growth.
A) unemployment and economic freedom.
B) equality and economic growth.
C) economic efficiency and equality.
D) unemployment and economic growth.
Unlock Deck
Unlock for access to all 158 flashcards in this deck.
Unlock Deck
k this deck
80
Since 1970,the distribution of personal income in the United States has:
A) moved toward greater inequality.
B) moved toward greater equality.
C) remained about the same.
D) fluctuated considerably.
A) moved toward greater inequality.
B) moved toward greater equality.
C) remained about the same.
D) fluctuated considerably.
Unlock Deck
Unlock for access to all 158 flashcards in this deck.
Unlock Deck
k this deck
Unlock Deck
Unlock for access to all 158 flashcards in this deck.


