Deck 15: Financial Statement Analysis
Full screen (f)
Question
Question
Question
Question
Question
Question
Question
Question
Question
Question
Question
Question
Question
Question
Question
Question
Question
Question
Question
Question
Question
Question
Question
Question
Question
Question
Question
Question
Question
Question
Question
Question
Question
Question
Question
Question
Question
Question
Question
Question
Question
Question
Question
Question
Question
Question
Question
Question
Night Owl, Inc. reported the following data: 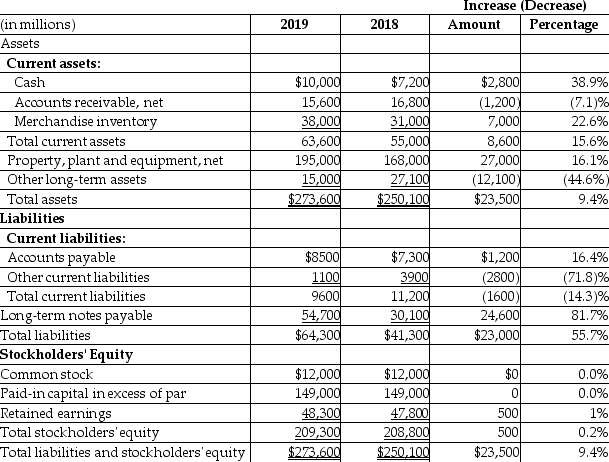 The horizontal analysis shows that the amount of total liabilities has __________.
A) increased by $23,000
B) increased by $2800
C) decreased by $2800
D) increased by $24,600
The horizontal analysis shows that the amount of total liabilities has __________.A) increased by $23,000
B) increased by $2800
C) decreased by $2800
D) increased by $24,600
Question
Question
Question
Question
Question
Question
Question
Question
Question
Question
Question
Question
Question
Question
Question
Question
Question
Question
Question
Question
The vertical analysis of the income statement of Bates, Inc. is as shown below: 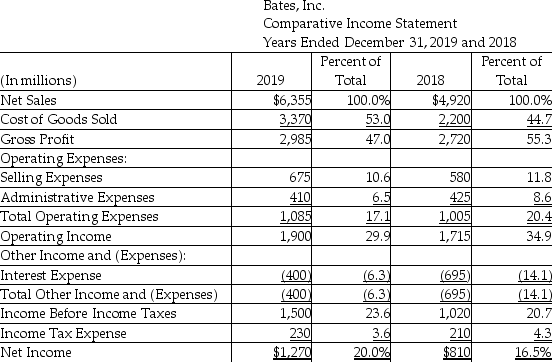 The figure 47.0% shown for gross profit in 2019 signifies that the gross profit is ________.
A) equal to 47.0% of net income
B) increased by 47.0% over the previous year
C) 47.0% of net sales revenue
D) 47.0% of cost of goods sold
The figure 47.0% shown for gross profit in 2019 signifies that the gross profit is ________.A) equal to 47.0% of net income
B) increased by 47.0% over the previous year
C) 47.0% of net sales revenue
D) 47.0% of cost of goods sold
Question
Question
The vertical analysis of the income statement of Settler, Inc. is as shown below: 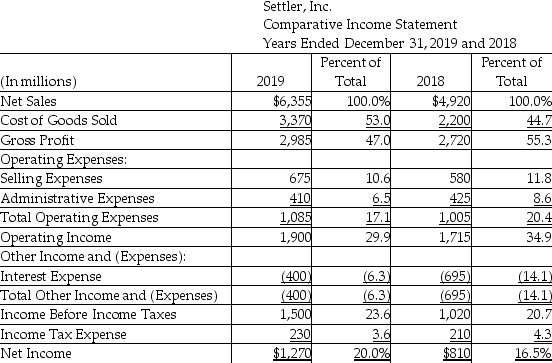 The 20% shown for net income in 2019 signifies that net income ________.
A) is 20% of net sales revenues
B) increased by 20% over the previous year
C) is 20% of gross profit
D) equals 20 times of the income before income tax
The 20% shown for net income in 2019 signifies that net income ________.A) is 20% of net sales revenues
B) increased by 20% over the previous year
C) is 20% of gross profit
D) equals 20 times of the income before income tax
Question
Question
Question
Question
Question
Question
Question
Question
Question
Question

Unlock Deck
Sign up to unlock the cards in this deck!
Unlock Deck
Unlock Deck
1/161
Play
Full screen (f)
Deck 15: Financial Statement Analysis
1
A quarterly report filed with the Securities and Exchange Commission is called a Form 10-K.
False
2
Horizontal analysis provides a year-to-year comparison of a company's performance in different periods.
True
3
An external auditor is responsible for assessing the effectiveness of a company's internal controls.
True
4
Investors and creditors cannot evaluate a company by examining only one year of data.
Unlock Deck
Unlock for access to all 161 flashcards in this deck.
Unlock Deck
k this deck
5
To accurately determine the financial performance of a company, it is necessary to compare the company's performance ________.
A) with a competing company
B) to the budget
C) with companies in different industries
D) only with profitable companies
A) with a competing company
B) to the budget
C) with companies in different industries
D) only with profitable companies
Unlock Deck
Unlock for access to all 161 flashcards in this deck.
Unlock Deck
k this deck
6
The income statement is also known as the ________.
A) statement of operations
B) statement of cash flows
C) statement of stockholders' equity
D) statement of financial position
A) statement of operations
B) statement of cash flows
C) statement of stockholders' equity
D) statement of financial position
Unlock Deck
Unlock for access to all 161 flashcards in this deck.
Unlock Deck
k this deck
7
List the three ways to analyze financial statements. State what each of these ways provides to investors and creditors.
Unlock Deck
Unlock for access to all 161 flashcards in this deck.
Unlock Deck
k this deck
8
Ratio analysis ________.
A) cannot be used to evaluate a company's financial condition
B) is used most effectively to compare a company against other companies in the same industry and to denote trends within the company
C) cannot be used to compare a company against other companies in the same industry because the necessary information is not available
D) cannot be used to evaluate a company's performance
Unlock Deck
Unlock for access to all 161 flashcards in this deck.
Unlock Deck
k this deck
9
The audit report in the annual report attests to the fairness of the presentation of the financial statements.
Unlock Deck
Unlock for access to all 161 flashcards in this deck.
Unlock Deck
k this deck
10
A summary of significant accounting policies and explanations of specific items on the financial statements are included in ________.
A) the balance sheet
B) the income statement
C) the notes to financial statements
D) the report of the independent registered public accounting firm
A) the balance sheet
B) the income statement
C) the notes to financial statements
D) the report of the independent registered public accounting firm
Unlock Deck
Unlock for access to all 161 flashcards in this deck.
Unlock Deck
k this deck
11
Ratio analysis is used most effectively to measure a company against other companies in different industries.
Unlock Deck
Unlock for access to all 161 flashcards in this deck.
Unlock Deck
k this deck
12
An adverse opinion is issued if the auditor finds that the financial statements are not presented fairly.
Unlock Deck
Unlock for access to all 161 flashcards in this deck.
Unlock Deck
k this deck
13
In an audit report in the annual report, a qualified opinion states that the financial statements are presented fairly in all material respects.
Unlock Deck
Unlock for access to all 161 flashcards in this deck.
Unlock Deck
k this deck
14
Which of the following is NOT a way to accurately determine the financial performance of a company?
A) carefully examining one year of data
B) evaluating a company's performance from year to year
C) comparing a company's performance with a competing company
D) comparing a company's performance with the same industry as a whole
A) carefully examining one year of data
B) evaluating a company's performance from year to year
C) comparing a company's performance with a competing company
D) comparing a company's performance with the same industry as a whole
Unlock Deck
Unlock for access to all 161 flashcards in this deck.
Unlock Deck
k this deck
15
There are three main ways to analyze financial statements. Which of the following does NOT represent one of these ways of analyzing financial statements?
A) horizontal analysis
B) ratio analysis
C) financial statement analysis
D) vertical analysis
A) horizontal analysis
B) ratio analysis
C) financial statement analysis
D) vertical analysis
Unlock Deck
Unlock for access to all 161 flashcards in this deck.
Unlock Deck
k this deck
16
An annual report provides information about a company's financial condition.
Unlock Deck
Unlock for access to all 161 flashcards in this deck.
Unlock Deck
k this deck
17
The audit report in the annual report is prepared by an internal auditor of a company.
Unlock Deck
Unlock for access to all 161 flashcards in this deck.
Unlock Deck
k this deck
18
To accurately determine the financial performance of a company, it is necessary to compare its performance from year to year, with a competing company, and with the same industry as a whole.
Unlock Deck
Unlock for access to all 161 flashcards in this deck.
Unlock Deck
k this deck
19
Investors and creditors can evaluate a company by examining only one year of data.
Unlock Deck
Unlock for access to all 161 flashcards in this deck.
Unlock Deck
k this deck
20
Management's discussion and analysis of financial condition and results of operations section of the annual report is the company's attempt to explain its financial statements and discuss its performance.
Unlock Deck
Unlock for access to all 161 flashcards in this deck.
Unlock Deck
k this deck
21
Which of the following best describes horizontal analysis?
A) comparing financial statement line items from year to year for the same company
B) expressing each financial statement amount as a percentage of a budgeted amount
C) comparing a company's financial statements with other companies
D) calculating key ratios to evaluate performance
A) comparing financial statement line items from year to year for the same company
B) expressing each financial statement amount as a percentage of a budgeted amount
C) comparing a company's financial statements with other companies
D) calculating key ratios to evaluate performance
Unlock Deck
Unlock for access to all 161 flashcards in this deck.
Unlock Deck
k this deck
22
Which of the following statements regarding the management's discussion and analysis (MD&A) part of the annual report is NOT correct?
A) Investors are not interested in the MD&A because it is written by the company and could present a biased view of the company's financial condition and performance.
B) It often contains information that is not found in the financial data.
C) It provides forward-looking formation.
D) The MD&A is the company's attempt to explain its financial statements and to discuss its performance.
Unlock Deck
Unlock for access to all 161 flashcards in this deck.
Unlock Deck
k this deck
23
Provide a description of the contents of each of the following components of the annual report.
-
-
Unlock Deck
Unlock for access to all 161 flashcards in this deck.
Unlock Deck
k this deck
24
McDonald Corp. reported the following on its comparative income statement (in millions):
Prepare a horizontal analysis of revenues and cost of goods sold, both in dollar amounts and in percentages, for 2019 and 2018. (Round your percentage answers to two decimal places.)
Prepare a horizontal analysis of revenues and cost of goods sold, both in dollar amounts and in percentages, for 2019 and 2018. (Round your percentage answers to two decimal places.)
Unlock Deck
Unlock for access to all 161 flashcards in this deck.
Unlock Deck
k this deck
25
Horizontal analysis is computed by dividing a specific statement line item by its base amount and then multiplying by 100.
Unlock Deck
Unlock for access to all 161 flashcards in this deck.
Unlock Deck
k this deck
26
Horizontal analysis is the study of percentage changes in line items in comparative financial statements.
Unlock Deck
Unlock for access to all 161 flashcards in this deck.
Unlock Deck
k this deck
27
Data for Sherwood, Inc. for the years ended December 31, 2019 and 2018 are as follows:
Prepare a horizontal analysis of the comparative income statement of Sherman, Inc. (Round to one decimal place.) Use a multi-step income statement.
Prepare a horizontal analysis of the comparative income statement of Sherman, Inc. (Round to one decimal place.) Use a multi-step income statement.
Unlock Deck
Unlock for access to all 161 flashcards in this deck.
Unlock Deck
k this deck
28
The following is a summary of information presented on the financial statements of a company on December 31, 2019. With respect to net sales revenue, a horizontal analysis reveals ________.
A) a 20.92% increase in net sales revenue
B) a 240.62% decrease in net sales revenue
C) a decrease of $44,000 in net sales revenue
D) a $44,000 increase in net sales revenue
A) a 20.92% increase in net sales revenue
B) a 240.62% decrease in net sales revenue
C) a decrease of $44,000 in net sales revenue
D) a $44,000 increase in net sales revenue
Unlock Deck
Unlock for access to all 161 flashcards in this deck.
Unlock Deck
k this deck
29
Which of the following is used to determine how the sales revenue of a company has changed from one year to the next?
A) vertical analysis of the balance sheet
B) horizontal analysis of the income statement
C) horizontal analysis of the balance sheet
D) vertical analysis of the income statement
A) vertical analysis of the balance sheet
B) horizontal analysis of the income statement
C) horizontal analysis of the balance sheet
D) vertical analysis of the income statement
Unlock Deck
Unlock for access to all 161 flashcards in this deck.
Unlock Deck
k this deck
30
What is an annual report? Briefly describe the key parts of the annual report.
Unlock Deck
Unlock for access to all 161 flashcards in this deck.
Unlock Deck
k this deck
31
The horizontal analysis is computed by which of the following formulas?
A) ((earlier period amount - later period amount)/base period amount) × 100
B) (later period amount/earlier period amount) × 100
C) (base period amount/dollar amount of change) × 100
D) (dollar amount of change/base period amount) × 100
A) ((earlier period amount - later period amount)/base period amount) × 100
B) (later period amount/earlier period amount) × 100
C) (base period amount/dollar amount of change) × 100
D) (dollar amount of change/base period amount) × 100
Unlock Deck
Unlock for access to all 161 flashcards in this deck.
Unlock Deck
k this deck
32
MacMan, Inc. reported the following data:
The horizontal analysis shows that cost of goods sold has ________. (Round your answer to two decimal places.)
A) increased by 28.95%
B) decreased by 28.95%
C) increased by 56.82%
D) decreased by 56.82%
The horizontal analysis shows that cost of goods sold has ________. (Round your answer to two decimal places.)
A) increased by 28.95%
B) decreased by 28.95%
C) increased by 56.82%
D) decreased by 56.82%
Unlock Deck
Unlock for access to all 161 flashcards in this deck.
Unlock Deck
k this deck
33
Data for Kahn, Inc. follows:
Kahn, Inc.
Comparative Income Statement
Years Ended Dec. 31, 2019 and 2018 Expenses:
Prepare a horizontal analysis of the comparative income statement of Kahn, Inc. (Round to one decimal place.) Use a multi-step format for the income statement.
Kahn, Inc.
Comparative Income Statement
Years Ended Dec. 31, 2019 and 2018 Expenses:
Prepare a horizontal analysis of the comparative income statement of Kahn, Inc. (Round to one decimal place.) Use a multi-step format for the income statement.
Unlock Deck
Unlock for access to all 161 flashcards in this deck.
Unlock Deck
k this deck
34
Provide a description of the contents of each of the following components of the annual report.
-
-
Unlock Deck
Unlock for access to all 161 flashcards in this deck.
Unlock Deck
k this deck
35
Which of the following is NOT a part of a corporation's annual report?
A) report of independent registered public accounting firm
B) MD&A
C) notes to financial statements
D) employees' pay rates
A) report of independent registered public accounting firm
B) MD&A
C) notes to financial statements
D) employees' pay rates
Unlock Deck
Unlock for access to all 161 flashcards in this deck.
Unlock Deck
k this deck
36
Horizontal analysis compares the change in each statement item from one year to the next.
Unlock Deck
Unlock for access to all 161 flashcards in this deck.
Unlock Deck
k this deck
37
Horizontal analysis compares each item in the income statement to the net sales amount.
Unlock Deck
Unlock for access to all 161 flashcards in this deck.
Unlock Deck
k this deck
38
Annual reports ________.
A) are required to be prepared by every corporation
B) discuss the company's competitors and the risks related to the company's business
C) are also called a Form 10-Q
D) only include the company's financial statements
A) are required to be prepared by every corporation
B) discuss the company's competitors and the risks related to the company's business
C) are also called a Form 10-Q
D) only include the company's financial statements
Unlock Deck
Unlock for access to all 161 flashcards in this deck.
Unlock Deck
k this deck
39
The following is a summary of information presented on the financial statements of a company on December 31, 2019. With respect to net income, a horizontal analysis reveals ________. (Round your answer to two decimal places.)
A) that net income is 14.55% of net sales revenue
B) a $22,000 increase in net income
C) a 145.45% decrease in net income
D) a 145.45% increase in net income
A) that net income is 14.55% of net sales revenue
B) a $22,000 increase in net income
C) a 145.45% decrease in net income
D) a 145.45% increase in net income
Unlock Deck
Unlock for access to all 161 flashcards in this deck.
Unlock Deck
k this deck
40
The auditor's report ________.
A) attests that the financial statements are error-free
B) is prepared by the internal auditors
C) states whether the financial statements are presented in accordance with GAAP
D) does not include an assessment of the effectiveness of the company's internal controls
A) attests that the financial statements are error-free
B) is prepared by the internal auditors
C) states whether the financial statements are presented in accordance with GAAP
D) does not include an assessment of the effectiveness of the company's internal controls
Unlock Deck
Unlock for access to all 161 flashcards in this deck.
Unlock Deck
k this deck
41
The trend analysis report of Marswell, Inc. is given below (in millions): Which of the following is a correct conclusion from the above analysis?
A) Net income for 2017 has increased by 114% over that for 2015.
B) Net income for 2017 has decreased by 14% over that for 2015.
C) Net income for 2017 has decreased by 114% over that for 2015.
D) Net income for 2017 has increased by 14% over that for 2015.
A) Net income for 2017 has increased by 114% over that for 2015.
B) Net income for 2017 has decreased by 14% over that for 2015.
C) Net income for 2017 has decreased by 114% over that for 2015.
D) Net income for 2017 has increased by 14% over that for 2015.
Unlock Deck
Unlock for access to all 161 flashcards in this deck.
Unlock Deck
k this deck
42
Which of the following best describes trend analysis?
A) calculating key ratios to evaluate performance
B) expressing each financial statement amount as a percentage of a budgeted amount
C) comparing a company's financial statements with that of other companies
D) expressing each year's financial statement line item as a percentage of the base year amount
Unlock Deck
Unlock for access to all 161 flashcards in this deck.
Unlock Deck
k this deck
43
In a vertical analysis of the balance sheet, each line item is shown as a percentage of stockholders' equity.
Unlock Deck
Unlock for access to all 161 flashcards in this deck.
Unlock Deck
k this deck
44
The horizontal analysis of the balance sheet shows the changes in net sales and net income.
Unlock Deck
Unlock for access to all 161 flashcards in this deck.
Unlock Deck
k this deck
45
A trend analysis would be used if an analyst wants to see how the gross profit of a company has changed from one year to the next.
Unlock Deck
Unlock for access to all 161 flashcards in this deck.
Unlock Deck
k this deck
46
In a vertical analysis of the income statement, each line item is shown as a percentage of net sales revenue.
Unlock Deck
Unlock for access to all 161 flashcards in this deck.
Unlock Deck
k this deck
47
The following is summary of information presented on the financial statements of a company on December 31, 2019. With respect to current liabilities, a horizontal analysis reveals ________. (Round your answer to two decimal places.)
A) that current liabilities are 37.13% of total equity
B) a 44.23% increase in current liabilities
C) a current ratio of 0.88
D) a 30.67% increase in current liabilities
A) that current liabilities are 37.13% of total equity
B) a 44.23% increase in current liabilities
C) a current ratio of 0.88
D) a 30.67% increase in current liabilities
Unlock Deck
Unlock for access to all 161 flashcards in this deck.
Unlock Deck
k this deck
48
Night Owl, Inc. reported the following data: The horizontal analysis shows that the amount of total liabilities has __________.
A) increased by $23,000
B) increased by $2800
C) decreased by $2800
D) increased by $24,600
The horizontal analysis shows that the amount of total liabilities has __________.A) increased by $23,000
B) increased by $2800
C) decreased by $2800
D) increased by $24,600
Unlock Deck
Unlock for access to all 161 flashcards in this deck.
Unlock Deck
k this deck
49
The following is a summary of information presented on the financial statements of a company on December 31, 2019. With respect to long-term liabilities, a horizontal analysis reveals ________.
A) long-term liabilities decreased by $13,000
B) long-term liabilities decreased by 22.81%
C) long-term liabilities decreased by 15.38%
D) long-term liabilities decreased by $2000
A) long-term liabilities decreased by $13,000
B) long-term liabilities decreased by 22.81%
C) long-term liabilities decreased by 15.38%
D) long-term liabilities decreased by $2000
Unlock Deck
Unlock for access to all 161 flashcards in this deck.
Unlock Deck
k this deck
50
Sapphire Corp. reported the following revenues and net income amounts.
Calculate Sapphire's trend analysis for revenues and cost of goods sold. Use 2015 as the base year, and round to the nearest percent.
Calculate Sapphire's trend analysis for revenues and cost of goods sold. Use 2015 as the base year, and round to the nearest percent.
Unlock Deck
Unlock for access to all 161 flashcards in this deck.
Unlock Deck
k this deck
51
A horizontal analysis would be used if an analyst wants to see how the assets of a company have changed from one year to the next.
Unlock Deck
Unlock for access to all 161 flashcards in this deck.
Unlock Deck
k this deck
52
A vertical analysis percent is computed by dividing the base amount by the specific item and then multiplying by 100.
Unlock Deck
Unlock for access to all 161 flashcards in this deck.
Unlock Deck
k this deck
53
A vertical analysis of a financial statement reveals the relationship of each statement item to its base amount, which is the 100% figure.
Unlock Deck
Unlock for access to all 161 flashcards in this deck.
Unlock Deck
k this deck
54
The trend analysis report of Poplar, Inc. is given below (in millions): Which of the following is a correct conclusion from the above analysis?
A) Net income for 2019 is 175% of net income for 2015.
B) Net income for 2018 is 152% of the previous year.
C) Net income for 2018 decreased by 152% from 2017.
D) Net income for 2019 increased by 175% from 2018.
A) Net income for 2019 is 175% of net income for 2015.
B) Net income for 2018 is 152% of the previous year.
C) Net income for 2018 decreased by 152% from 2017.
D) Net income for 2019 increased by 175% from 2018.
Unlock Deck
Unlock for access to all 161 flashcards in this deck.
Unlock Deck
k this deck
55
Data for Michelle, Inc. follow:
Michelle, Inc.
Comparative Balance Sheet
December 31, 2019 and 2018
Assets
Current Assets:
Liabilities
Stockholders' Equity
Prepare a horizontal analysis of the comparative balance sheet of Michelle, Inc. (Round to one decimal place.)
Michelle, Inc.
Comparative Balance Sheet
December 31, 2019 and 2018
Assets
Current Assets:
Liabilities
Stockholders' Equity
Prepare a horizontal analysis of the comparative balance sheet of Michelle, Inc. (Round to one decimal place.)
Unlock Deck
Unlock for access to all 161 flashcards in this deck.
Unlock Deck
k this deck
56
Data for Gobell, Inc. follow:
Gobell, Inc.
Comparative Balance Sheet
December 31,2019 and 2018
Assets
Current Assets:
Liabilities
Stockholders' Equity
Prepare a horizontal analysis of the comparative balance sheet of Gobell, Inc. (Round to one decimal place.)
Gobell, Inc.
Comparative Balance Sheet
December 31,2019 and 2018
Assets
Current Assets:
Liabilities
Stockholders' Equity
Prepare a horizontal analysis of the comparative balance sheet of Gobell, Inc. (Round to one decimal place.)
Unlock Deck
Unlock for access to all 161 flashcards in this deck.
Unlock Deck
k this deck
57
Vertical analysis involves comparing an amount for a line item in the financial statements with a corresponding amount for the line item of the previous year.
Unlock Deck
Unlock for access to all 161 flashcards in this deck.
Unlock Deck
k this deck
58
The horizontal analysis of the balance sheet is based on the comparative balance sheet.
Unlock Deck
Unlock for access to all 161 flashcards in this deck.
Unlock Deck
k this deck
59
Trend analysis is a form of horizontal analysis.
Unlock Deck
Unlock for access to all 161 flashcards in this deck.
Unlock Deck
k this deck
60
Beary, Inc. provides the following historical data:
Prepare the trend analysis report. Use 2014 as the base year, and round answers to the nearest percent.
Prepare the trend analysis report. Use 2014 as the base year, and round answers to the nearest percent.
Unlock Deck
Unlock for access to all 161 flashcards in this deck.
Unlock Deck
k this deck
61
Prepare a vertical analysis for the balance sheet data given below. (Round to two decimal places.)
Petals, Inc.
Balance Sheet
December 31,2019 Assets
Current Assets:
Liabilities
Current Liabilities:
Stockholders' Equity
Petals, Inc.
Balance Sheet
December 31,2019 Assets
Current Assets:
Liabilities
Current Liabilities:
Stockholders' Equity
Unlock Deck
Unlock for access to all 161 flashcards in this deck.
Unlock Deck
k this deck
62
Dollar value bias is the bias one sees from comparing numbers in relative (dollars) rather than absolute (percentage) terms.
Unlock Deck
Unlock for access to all 161 flashcards in this deck.
Unlock Deck
k this deck
63
Martin Company's cost of goods sold is 40% of net sales revenue. This means that for every $1 of net sales revenue, Martin has $0.60 of gross profit.
Unlock Deck
Unlock for access to all 161 flashcards in this deck.
Unlock Deck
k this deck
64
Shelcal, Inc. provides the following data for the year 2019: The cost of goods sold as a percentage of net sales revenue is ________. (Round your answer to two decimal places.)
A) 58.84%
B) 58.96%
C) 58.41%
D) 58.68%
A) 58.84%
B) 58.96%
C) 58.41%
D) 58.68%
Unlock Deck
Unlock for access to all 161 flashcards in this deck.
Unlock Deck
k this deck
65
Reliable Moving Company reported the following amounts on its balance sheet as of December 31, 2019 and December 31, 2018: For the vertical analysis, what is the percentage of total liabilities for December 31, 2018? (Round your answer to two decimal places.)
A) 100.00%
B) 46.50%
C) 31.03%
D) 38.67%
A) 100.00%
B) 46.50%
C) 31.03%
D) 38.67%
Unlock Deck
Unlock for access to all 161 flashcards in this deck.
Unlock Deck
k this deck
66
Mercer, Inc. provides the following data for 2019: The gross profit as a percentage of net sales is ________. (Round your answer to two decimal places.)
A) 35.24%
B) 36.88%
C) 63.12%
D) 38.21%
A) 35.24%
B) 36.88%
C) 63.12%
D) 38.21%
Unlock Deck
Unlock for access to all 161 flashcards in this deck.
Unlock Deck
k this deck
67
Modern Moving Company reported the following amounts on its balance sheet as of December 31, 2019 and December 31, 2018: For the vertical analysis, what is the percentage of stockholders' equity as of December 31, 2019? (Round your answer to two decimal places.)
A) 100.00%
B) 59.36%
C) 59.24%
D) There is not enough information provided to make this computation.
A) 100.00%
B) 59.36%
C) 59.24%
D) There is not enough information provided to make this computation.
Unlock Deck
Unlock for access to all 161 flashcards in this deck.
Unlock Deck
k this deck
68
The vertical analysis of the income statement of Bates, Inc. is as shown below: The figure 47.0% shown for gross profit in 2019 signifies that the gross profit is ________.
A) equal to 47.0% of net income
B) increased by 47.0% over the previous year
C) 47.0% of net sales revenue
D) 47.0% of cost of goods sold
The figure 47.0% shown for gross profit in 2019 signifies that the gross profit is ________.A) equal to 47.0% of net income
B) increased by 47.0% over the previous year
C) 47.0% of net sales revenue
D) 47.0% of cost of goods sold
Unlock Deck
Unlock for access to all 161 flashcards in this deck.
Unlock Deck
k this deck
69
When performing vertical analysis of a balance sheet, the base amount is ________.
A) total assets
B) total cash and cash equivalents
C) net income
D) gross profit
A) total assets
B) total cash and cash equivalents
C) net income
D) gross profit
Unlock Deck
Unlock for access to all 161 flashcards in this deck.
Unlock Deck
k this deck
70
The vertical analysis of the income statement of Settler, Inc. is as shown below: The 20% shown for net income in 2019 signifies that net income ________.
A) is 20% of net sales revenues
B) increased by 20% over the previous year
C) is 20% of gross profit
D) equals 20 times of the income before income tax
The 20% shown for net income in 2019 signifies that net income ________.A) is 20% of net sales revenues
B) increased by 20% over the previous year
C) is 20% of gross profit
D) equals 20 times of the income before income tax
Unlock Deck
Unlock for access to all 161 flashcards in this deck.
Unlock Deck
k this deck
71
In a vertical analysis of the balance sheet, the base amount is total liabilities.
Unlock Deck
Unlock for access to all 161 flashcards in this deck.
Unlock Deck
k this deck
72
For the vertical analysis of the balance sheet, the base amount is also the total of liabilities and stockholders' equity.
Unlock Deck
Unlock for access to all 161 flashcards in this deck.
Unlock Deck
k this deck
73
Glasgow, Inc. provides the following:
Glasgow, Inc.
Comparative Balance Sheet
December 31,2019 and 2018
Assets
Liabilities
Stockholders' Equity
Perform a vertical analysis of Glasgow's balance sheet for each year. (Round to one decimal place.)
Glasgow, Inc.
Comparative Balance Sheet
December 31,2019 and 2018
Assets
Liabilities
Stockholders' Equity
Perform a vertical analysis of Glasgow's balance sheet for each year. (Round to one decimal place.)
Unlock Deck
Unlock for access to all 161 flashcards in this deck.
Unlock Deck
k this deck
74
In 2018, Spirit Company's net income was 10% of net sales revenue. In 2019, the net income was 5% of net sales revenue. There is no need for investors to be alarmed because a drop from 10% to 5% is not significant.
Unlock Deck
Unlock for access to all 161 flashcards in this deck.
Unlock Deck
k this deck
75
When performing vertical analysis of an income statement, the base amount is ________.
A) total expenses
B) net sales revenue
C) sales revenue
D) gross profit
A) total expenses
B) net sales revenue
C) sales revenue
D) gross profit
Unlock Deck
Unlock for access to all 161 flashcards in this deck.
Unlock Deck
k this deck
76
A common-size statement reports the same percentages that appear in a vertical analysis.
Unlock Deck
Unlock for access to all 161 flashcards in this deck.
Unlock Deck
k this deck
77
Allstate Moving Company reported the following amounts on its balance sheet as of December 31, 2019 and December 31, 2018: For the vertical analysis, what is the percentage of current assets as of December 31, 2019? (Round your answer to two decimal places.)
A) 23.36%
B) 35.75%
C) 55.63%
D) 30.49%
A) 23.36%
B) 35.75%
C) 55.63%
D) 30.49%
Unlock Deck
Unlock for access to all 161 flashcards in this deck.
Unlock Deck
k this deck
78
Prepare a vertical analysis of the income statement shown below. (Round to two decimal places.)
Buckner, Inc.
Income Statement
For the Year Ended December 31, 2019 Operating Expenses:
Other Income and (Expenses):
Buckner, Inc.
Income Statement
For the Year Ended December 31, 2019 Operating Expenses:
Other Income and (Expenses):
Unlock Deck
Unlock for access to all 161 flashcards in this deck.
Unlock Deck
k this deck
79
In a vertical analysis of the income statement, each line item is shown as a percentage of net income.
Unlock Deck
Unlock for access to all 161 flashcards in this deck.
Unlock Deck
k this deck
80
Which of the following is used to see how a company's operating expenses, as a percentage of net sales, have changed from one year to the next?
A) vertical analysis
B) horizontal analysis
C) ratio analysis
D) analysis of internal control system
A) vertical analysis
B) horizontal analysis
C) ratio analysis
D) analysis of internal control system
Unlock Deck
Unlock for access to all 161 flashcards in this deck.
Unlock Deck
k this deck
Unlock Deck
Unlock for access to all 161 flashcards in this deck.


