Deck 19: Current Issues: Income, Income Distribution, Poverty, and Government Policy
Full screen (f)
Question
The table below shows the distribution of income in the U.S. in the year 1978.Table 19.1
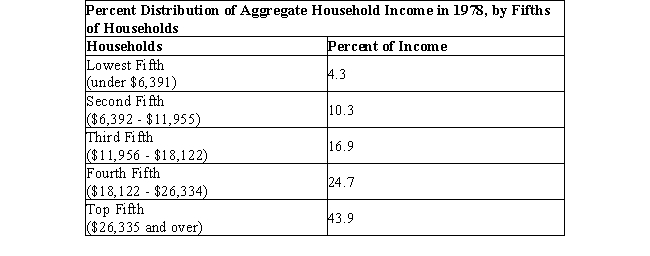
Refer to Table 19.1. What percentage of income is received by the bottom 20% of the households?
A)10.3%
B)43.9%
C)24.7%
D)4.3%
E)16.9%
Refer to Table 19.1. What percentage of income is received by the bottom 20% of the households?
A)10.3%
B)43.9%
C)24.7%
D)4.3%
E)16.9%
Question
The figure given below represents an imperfectly competitive resource market. Here common land (and not land used for specific purpose) is under consideration.Figure 18.1

In Country X, the highest 10 percent of families account for 70 percent of the income. In Country Y, the highest 10 percent of families account for 20 percent of the income. In this example:
A)Country Y would be located on the line of perfect inequality.
B)income is more equally distributed in Country Y.
C)income is more equally distributed in Country X.
D)Country X would be located on the line of perfect equality.
E)the degree of income inequality is equal in both the countries.
Question
The figure given below represents an imperfectly competitive resource market. Here common land (and not land used for specific purpose) is under consideration.Figure 18.1
Assume that any given percentage of the population earns an equal percentage of real GDP. This percentage of population will be represented by:
A)a point below the line of income equality.
B)a line lying below the line of income equality.
C)a point on the line of income equality.
D)a line lying above the line of income equality.
E)a point above the line of income equality.
Question
The figure given below represents an imperfectly competitive resource market. Here common land (and not land used for specific purpose) is under consideration.Figure 18.1
If the Gini co-efficient for an economy is 0.85, which of the following statements is true?
A)The national income of this economy is more or less equally distributed.
B)The Lorenz curve for the economy will bow above the line of perfect equality.
C)The Lorenz curve for the economy will coincide with the line of perfect equality.
D)The Lorenz curve for the economy will bow down below the line of perfect equality.
E)The Lorenz curve for the economy will be a rectangle.
Question
The figure given below represents an imperfectly competitive resource market. Here common land (and not land used for specific purpose) is under consideration.Figure 18.1
A Gini of 0 implies that:
A)every family has an equal amount of income.
B)the top 10% of the families appropriate almost 100% of the total income.
C)the bottom 90% of the families have only 10% of the total income.
D)the bottom 20% of the families have 80% of the total income.
E)only 1 family appropriates the entire national income.
Question
The table below shows the distribution of income in the U.S. in the year 1978.Table 19.1
According to Table 19.1, what percentage of income is received by the top 40% of the population?
A)41.6%
B)51.9%
C)60.8%
D)56.2%
E)68.6%
According to Table 19.1, what percentage of income is received by the top 40% of the population?
A)41.6%
B)51.9%
C)60.8%
D)56.2%
E)68.6%
Question
The figure given below represents an imperfectly competitive resource market. Here common land (and not land used for specific purpose) is under consideration.Figure 18.1
The diagram that represents how income is distributed among members of a population is known as a(n):
A)indifference curve.
B)Laffer curve.
C)Edgeworth box.
D)Lorenz curve.
E)Phillips curve
The diagram that represents how income is distributed among members of a population is known as a(n):
A)indifference curve.
B)Laffer curve.
C)Edgeworth box.
D)Lorenz curve.
E)Phillips curve
Question
The figure given below represents an imperfectly competitive resource market. Here common land (and not land used for specific purpose) is under consideration.Figure 18.1
Empirical observations validate that the Gini co-efficient for the U.S. economy was between 0.35 and 0.37 until the 1990s, after which it has increased and reached 0.469 in 2009. Which of the following can be inferred from this?
A)The distribution of national income in the U.S. has become slightly more equal since the 1990s.
B)The government spending on poverty alleviation has increased since 1990.
C)More jobs have been created in the U.S. since 1990.
D)The distribution of national income in the U.S. has become slightly more unequal since the 1990s.
E)The government has replaced the existing regressive tax structure with a progressive tax structure.
Question
The table below shows the distribution of income in the U.S. in the year 1978.Table 19.1
Refer to Table 19.1. What percentage of households earn 31.5% of the income?
A)Bottom 20%
B)Top 20%
C)Bottom 60%
D)Top 40%
E)Top 10%
Refer to Table 19.1. What percentage of households earn 31.5% of the income?
A)Bottom 20%
B)Top 20%
C)Bottom 60%
D)Top 40%
E)Top 10%
Question
The figure given below represents an imperfectly competitive resource market. Here common land (and not land used for specific purpose) is under consideration.Figure 18.1
Which of the following results from the market system of resource allocation?
A)Equitable distribution of resources
B)High opportunity cost of production
C)Excess supply of goods and services resulting in decreased profits
D)Unequal distribution of income and wealth
E)Allocation of the goods and services to those who need them the most
Question
The figure given below represents an imperfectly competitive resource market. Here common land (and not land used for specific purpose) is under consideration.Figure 18.1
If everyone had the same income, then the Lorenz curve would:
A)be the line of income equality.
B)bow down below the line of income equality.
C)be a parallel line lying below the line of income equality.
D)bow up above the line of income equality.
E)be a curve that intersects the line of income equality at its mid-point.
Question
The figure given below represents an imperfectly competitive resource market. Here common land (and not land used for specific purpose) is under consideration.Figure 18.1
If 50 percent of the population receives 20 percent of the total income, it can be represented on the Lorenz curve by:
A)a point below the line of income equality.
B)a line below the line of income equality.
C)a point on the line of income equality.
D)a line intersecting the line of income equality from below.
E)a point above the line of income equality.
Question
The figure given below represents an imperfectly competitive resource market. Here common land (and not land used for specific purpose) is under consideration.Figure 18.1
In a market system, incomes are distributed according to the:
A)principle of equality.
B)directions of a central authority.
C)needs of the people.
D)ownership of resources.
E)objectives of a planning commission.
In a market system, incomes are distributed according to the:
A)principle of equality.
B)directions of a central authority.
C)needs of the people.
D)ownership of resources.
E)objectives of a planning commission.
Question
The figure given below represents an imperfectly competitive resource market. Here common land (and not land used for specific purpose) is under consideration.Figure 18.1
If the Gini coefficient for the United States is 0.47 and that for India is 0.36, which of the following statements is true?
A)The U.S. being an industrialized nation has a lower income inequality than India.
B)The Lorenz curve for the U.S. lies above the Lorenz curve for India.
C)India, in spite of being a developing nation, has lesser income inequality than the U.S.
D)The Lorenz curve for India would coincide with the line of perfect equality.
E)The distribution of income in both the economies are equal.
Question
The figure given below represents an imperfectly competitive resource market. Here common land (and not land used for specific purpose) is under consideration.Figure 18.1
The Gini co-efficient is the:
A)area between the Lorenz curve and the vertical axis divided by the area under the Lorenz curve.
B)area between the Lorenz curve and the horizontal axis divided by the area above the Lorenz curve.
C)area between the Lorenz curve and the line of perfect equality divided by the total area under the line of income equality.
D)area between the Lorenz curve and the line of perfect equality divided by the total area above the line of perfect equality.
E)area between the line of perfect equality and the horizontal axis divided by the area between the Lorenz curve and the horizontal axis.
Question
The figure given below represents an imperfectly competitive resource market. Here common land (and not land used for specific purpose) is under consideration.Figure 18.1
Income inequality is indicated by a Lorenz curve that:
A)bows up, away from the line of income equality.
B)bows down, away from the line of income equality.
C)lies parallel to the line of income equality.
D)coincides with the line of income equality.
E)approaches the vertical axis.
Income inequality is indicated by a Lorenz curve that:
A)bows up, away from the line of income equality.
B)bows down, away from the line of income equality.
C)lies parallel to the line of income equality.
D)coincides with the line of income equality.
E)approaches the vertical axis.
Question
The figure given below represents an imperfectly competitive resource market. Here common land (and not land used for specific purpose) is under consideration.Figure 18.1
The 45-degree line splitting the distance between the axes in a Lorenz Curve is the:
A)line of equal share of expenditure.
B)line of equivalent income.
C)line of income equality.
D)line of average income.
E)line of absolute inequality.
The 45-degree line splitting the distance between the axes in a Lorenz Curve is the:
A)line of equal share of expenditure.
B)line of equivalent income.
C)line of income equality.
D)line of average income.
E)line of absolute inequality.
Question
The figure given below represents an imperfectly competitive resource market. Here common land (and not land used for specific purpose) is under consideration.Figure 18.1
The horizontal and vertical axes of the Lorenz curve respectively measure:
A)total income and total expenditure as cumulative percentages.
B)total income and total population as cumulative percentages.
C)total population and total expenditure as cumulative percentages.
D)total expenditure and total income as cumulative percentages.
E)total population and total income as cumulative percentages.
Question
The figure given below represents an imperfectly competitive resource market. Here common land (and not land used for specific purpose) is under consideration.Figure 18.1
For an economy, the greater the value of the Gini co-efficient, _____.
A)the greater will be the GDP.
B)the greater will be the income inequality
C)the greater will be the revenue of the government from direct taxes
D)the greater will be the equality in the distribution of income and wealth
E)the lesser will be the expenditure on the part of the government
Question
The table below shows the distribution of income in the U.S. in the year 1978.Table 19.1
If a Lorenz curve is drawn using the data in Table 19.1, it will:
A)coincide with the line of perfect equality.
B)be an L-shaped curve.
C)bow above the line of perfect equality.
D)bow down below the line of perfect equality.
E)be a rectangular-shaped curve.
If a Lorenz curve is drawn using the data in Table 19.1, it will:
A)coincide with the line of perfect equality.
B)be an L-shaped curve.
C)bow above the line of perfect equality.
D)bow down below the line of perfect equality.
E)be a rectangular-shaped curve.
Question
The figure given below shows the Lorenz curves of two countries (Country A and Country B).Figure 19.2
Total income (cumulative percentage)
Total population (cumuative percentage)

Refer to Figure 19.2. The richest 20 percent of the population in Country A receive:
A)10 percent of the national income.
B)20 percent of the national income.
C)30 percent of the national income.
D)40 percent of the national income.
E)50 percent of the national income.
Total income (cumulative percentage)
Total population (cumuative percentage)
Refer to Figure 19.2. The richest 20 percent of the population in Country A receive:
A)10 percent of the national income.
B)20 percent of the national income.
C)30 percent of the national income.
D)40 percent of the national income.
E)50 percent of the national income.
Question
The figure given below shows the Lorenz curves of two countries (Country A and Country B).Figure 19.2
Total income (cumulative percentage)
Total population (cumuative percentage)
The extent to which people move from one income quintile to another over time is called _____.
A)migrancy
B)moveability
C)mobility
D)exchangeability
E)transferability
Total income (cumulative percentage)
Total population (cumuative percentage)
The extent to which people move from one income quintile to another over time is called _____.
A)migrancy
B)moveability
C)mobility
D)exchangeability
E)transferability
Question
The figure given below shows the Lorenz curves of two countries (Country A and Country B).Figure 19.2
Total income (cumulative percentage)
Total population (cumuative percentage)
The official poverty-line income is adjusted annually for _____.
A)income taxes
B)unemployment compensation benefits
C)house rents
D)inflation
E)increases in health-care costs
Total income (cumulative percentage)
Total population (cumuative percentage)
The official poverty-line income is adjusted annually for _____.
A)income taxes
B)unemployment compensation benefits
C)house rents
D)inflation
E)increases in health-care costs
Question
The figure given below shows the Lorenz curves of two countries (Country A and Country B).Figure 19.2
Total income (cumulative percentage)
Total population (cumuative percentage)
_____ are most likely to be upwardly mobile within the income distribution of a country.
A)Single-earner families
B)College graduates
C)People who experience unemployment
D)Non-college graduates
E)Retired individuals
Total income (cumulative percentage)
Total population (cumuative percentage)
_____ are most likely to be upwardly mobile within the income distribution of a country.
A)Single-earner families
B)College graduates
C)People who experience unemployment
D)Non-college graduates
E)Retired individuals
Question
The figure given below shows the Lorenz curves of two countries (Country A and Country B).Figure 19.2
Total income (cumulative percentage)
Total population (cumuative percentage)
The allocations of goods and services from one group in a society to another are called:
A)mutually voluntary exchanges.
B)in-kind transfers.
C)grants.
D)economic rents.
E)transfer earnings.
Total income (cumulative percentage)
Total population (cumuative percentage)
The allocations of goods and services from one group in a society to another are called:
A)mutually voluntary exchanges.
B)in-kind transfers.
C)grants.
D)economic rents.
E)transfer earnings.
Question
The figure given below shows the Lorenz curves of two countries (Country A and Country B).Figure 19.2
Total income (cumulative percentage)
Total population (cumuative percentage)
In Figure 19.2, the poorest 60 percent of the population in Country B receive:
A)30 percent of the national income.
B)40 percent of the national income.
C)60 percent of the national income.
D)20 percent of the national income.
E)10 percent of the national income.
Question
The figure given below shows the Lorenz curves of two countries (Country A and Country B).Figure 19.2
Total income (cumulative percentage)
Total population (cumuative percentage)
A major problem with household data is that:
A)the income of the households vary greatly.
B)the households usually vary in their consumption patterns.
C)the households usually comprise of only one individual.
D)collecting data from the households is highly inconvenient.
E)the number of persons per household varies greatly.
Question
The figure below shows two Lorenz curves, Y and Z.Figure 19.1
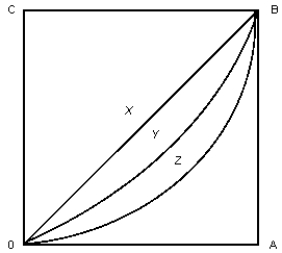
In Figure 19.1, which of the following could occur in the short run given the introduction of a regressive income tax?
A)The Lorenz curve OZB would shift to OYB.
B)The Lorenz curve OYB would coincide with the line OXB.
C)The Lorenz curve OZB would coincide with the line OXB.
D)The Lorenz curve OYB would coincide with the horizontal axis.
E)The Lorenz curve would shift from OYB to OZB.
Question
The figure given below shows the Lorenz curves of two countries (Country A and Country B).Figure 19.2
Total income (cumulative percentage)
Total population (cumuative percentage)
Which of the following is an example of in-kind transfer?
A)Social security benefits
B)Food stamps
C)Disability pensions
D)Unemployment compensations
E)Earned income tax credit
Total income (cumulative percentage)
Total population (cumuative percentage)
Which of the following is an example of in-kind transfer?
A)Social security benefits
B)Food stamps
C)Disability pensions
D)Unemployment compensations
E)Earned income tax credit
Question
The figure given below shows the Lorenz curves of two countries (Country A and Country B).Figure 19.2
Total income (cumulative percentage)
Total population (cumuative percentage)
_____ are the primary population group with poverty-level incomes in the USA.
A)Single-income households
B)Households headed by males
C)College graduates
D)People who do not have high school education
E)Retired individuals
Total income (cumulative percentage)
Total population (cumuative percentage)
_____ are the primary population group with poverty-level incomes in the USA.
A)Single-income households
B)Households headed by males
C)College graduates
D)People who do not have high school education
E)Retired individuals
Question
The figure given below shows the Lorenz curves of two countries (Country A and Country B).Figure 19.2
Total income (cumulative percentage)
Total population (cumuative percentage)
If those who are poor at any one time are poor only temporarily, then their plight is only temporary. This statement is based on which of the following assumptions?
A)Many spells of poverty are relatively short-lived.
B)Government spending in the economy is inadequate.
C)All phases of the business cycle are temporary.
D)Education infrastructure in the economy is poor.
E)Once people fall below the poverty line, it is almost impossible for them to rise above it.
Question
The figure given below shows the Lorenz curves of two countries (Country A and Country B).Figure 19.2
Total income (cumulative percentage)
Total population (cumuative percentage)
Why does the census data overstate inequality?
A)They overestimate the non cash transfers received by the people from the government.
B)They take into account the after-tax incomes.
C)They take into account the gifts and transfer receipts from friends and relatives staying abroad.
D)They do not consider the in-kind transfers received by the people from the government.
E)They overestimate the medical benefits received by the people from the government.
Question
The figure given below shows the Lorenz curves of two countries (Country A and Country B).Figure 19.2
Total income (cumulative percentage)
Total population (cumuative percentage)
Refer to Figure 19.2 and identify the correct statement.
A)The top 10 percent of the population in Country B receive 20 percent of the national income.
B)The top 10 percent of the population in Country A receive 70 percent of the national income.
C)Country A has a greater degree of income inequality than Country B.
D)The bottom 90 percent of the population in Country B receive 90 percent of the national income.
E)The poorest 20 percent of the population in Country A receive 10 percent of the national income.
Question
The figure given below shows the Lorenz curves of two countries (Country A and Country B).Figure 19.2
Total income (cumulative percentage)
Total population (cumuative percentage)
Following are the controversies over how poverty should be measured, except:
A)government transfers and other programs are not properly taken into account in the measures of poverty.
B)the poverty measures do not distinguish among the needs of different individuals.
C)the concept of poverty line does not draw any distinction between income and purchasing power.
D)the concept of poverty line does not take into account the expenditure on food by each family.
E)the income generated in the underground economy are not taken into account.
Question
The figure given below shows the Lorenz curves of two countries (Country A and Country B).Figure 19.2
Total income (cumulative percentage)
Total population (cumuative percentage)
The measures of absolute poverty:
A)are inversely related to the degree of income equality in a country.
B)are directly related to the degree of income equality in a country.
C)depend on the prosperity of the poorest 50 percent of population.
D)determine the degree of income inequality.
E)are completely independent of the degree of income inequality.
Question
The figure given below shows the Lorenz curves of two countries (Country A and Country B).Figure 19.2
Total income (cumulative percentage)
Total population (cumuative percentage)
Which of the following is a cash transfer received from the government?
A)Medicaid
B)Earned Income Tax Credit
C)Food stamps
D)Housing assistance
E)Free education
Total income (cumulative percentage)
Total population (cumuative percentage)
Which of the following is a cash transfer received from the government?
A)Medicaid
B)Earned Income Tax Credit
C)Food stamps
D)Housing assistance
E)Free education
Question
The figure below shows two Lorenz curves, Y and Z.Figure 19.1
According to Figure 19.1, which of the following is true?
A)Line OZB is the line of perfect income inequality.
B)Curve OYB represents a less equal distribution of income than curve OZB.
C)Line AB represents a society in which wealth is shared equally among individuals.
D)Line OXB is the line of perfect income equality.
E)Line AB represents a society in which 50 percent of the population receives all the income.
Question
The figure given below shows the Lorenz curves of two countries (Country A and Country B).Figure 19.2
Total income (cumulative percentage)
Total population (cumuative percentage)
Which of the following is an absolute measure of poverty?
A)Gini co-efficient
B)Per capita income
C)HiLo ratio
D)Hoover index
E)Theil index
Total income (cumulative percentage)
Total population (cumuative percentage)
Which of the following is an absolute measure of poverty?
A)Gini co-efficient
B)Per capita income
C)HiLo ratio
D)Hoover index
E)Theil index
Question
The figure given below shows the Lorenz curves of two countries (Country A and Country B).Figure 19.2
Total income (cumulative percentage)
Total population (cumuative percentage)
Per capita income is calculated as:
A)national income divided by number of households.
B)national income divided by number of people.
C)number of households divided by national income.
D)number of people divided by national income.
E)number of people divided by domestic income.
Question
The figure given below shows the Lorenz curves of two countries (Country A and Country B).Figure 19.2
Total income (cumulative percentage)
Total population (cumuative percentage)
In Figure 19.2, the richest 20 percent of the population in Country B receive:
A)20 percent of the national income.
B)60 percent of the national income.
C)50 percent of the national income.
D)40 percent of the national income.
E)80 percent of the national income.
Question
The figure given below shows the Lorenz curves of two countries (Country A and Country B).Figure 19.2
Total income (cumulative percentage)
Total population (cumuative percentage)
Which of the following tax structures helps in reducing income inequality?
A)Proportional tax structure
B)Regressive tax structure
C)Indirect tax structure
D)Progressive tax structure
E)A combination of proportional and regressive tax structure.
Question
The figure given below shows the Lorenz curves of two countries (Country A and Country B).Figure 19.2
Total income (cumulative percentage)
Total population (cumuative percentage)
Which of the following statements in the context of poverty in the U.S. is true?
A)Families headed by males are likely to be poor.
B)Caucasian Americans carry a much heavier burden of poverty compared to the native Americans.
C)Education and technical skills do not affect employment in the United States of America.
D)Females tend to have a greater literacy rate than males in the United States of America.
E)Minorities, young and disabled have a higher likelihood to fall into poverty
Question
The figure given below shows the Lorenz curves of two countries (Country A and Country B).Figure 19.2
Total income (cumulative percentage)
Total population (cumuative percentage)
Which of the following are most likely to be in poverty?
A)Families headed by a male
B)White males
C)Disabled people
D)Married couples
E)People with a college degree
Total income (cumulative percentage)
Total population (cumuative percentage)
Which of the following are most likely to be in poverty?
A)Families headed by a male
B)White males
C)Disabled people
D)Married couples
E)People with a college degree
Question
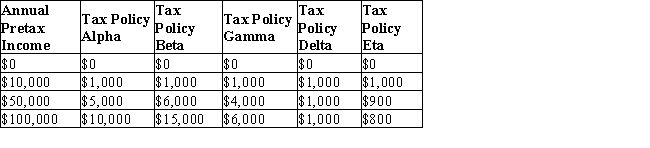
The table given below shows the absolute tax amounts under five different tax policies for respective income levels.Table 19.2
_____ is the largest social insurance program in the U.S.
A)Medicaid
B)The food stamp program
C)Supplementary security insurance
D)The Head Start program
E)Old-Age, Survivors, and Disability Insurance
_____ is the largest social insurance program in the U.S.
A)Medicaid
B)The food stamp program
C)Supplementary security insurance
D)The Head Start program
E)Old-Age, Survivors, and Disability Insurance
Question
The table given below shows the absolute tax amounts under five different tax policies for respective income levels.Table 19.2
Transfer programs are so named because they transfer:
A)the burden of poverty alleviation from the church to the state.
B)the poverty from the country side to the city.
C)the responsibility for maintaining minimum standards of living from the federal government to state governments.
D)income from the relatively high-income people to relatively low-income people.
E)the incidence of poverty from predominantly ethnic groups to the majority white population.
Question
The table given below shows the absolute tax amounts under five different tax policies for respective income levels.Table 19.2
The main transfer programs of the U.S. government include each of the following, except:
A)social insurance.
B)cash welfare or public assistance.
C)in-kind transfers.
D)veterans' benefits.
E)employment programs.
The main transfer programs of the U.S. government include each of the following, except:
A)social insurance.
B)cash welfare or public assistance.
C)in-kind transfers.
D)veterans' benefits.
E)employment programs.
Question
The figure given below shows the Lorenz curves of two countries (Country A and Country B).Figure 19.2
Total income (cumulative percentage)
Total population (cumuative percentage)
If an individual who earns $20,000 pays $2,000 in taxes and another individual who earns $100,000 pays $10,000 in taxes, then these individuals are being taxed under a _______ tax system.
A)toll
B)regressive
C)progressive
D)proportional
E)negative income
Question
The table given below shows the absolute tax amounts under five different tax policies for respective income levels.Table 19.2
An imposition of tax by the government for funding welfare programs raises the cost of labor to firms as:
A)the demand for labor increases.
B)the demand for labor decreases.
C)the supply of labor decreases.
D)the supply of labor increases.
E)the opportunity cost of leisure increases.
An imposition of tax by the government for funding welfare programs raises the cost of labor to firms as:
A)the demand for labor increases.
B)the demand for labor decreases.
C)the supply of labor decreases.
D)the supply of labor increases.
E)the opportunity cost of leisure increases.
Question
The table given below shows the absolute tax amounts under five different tax policies for respective income levels.Table 19.2
Refer to Table 19.2. Which of the tax policies is an example of a proportional tax?
A)Alpha
B)Gamma
C)Eta
D)Beta
E)Delta
Refer to Table 19.2. Which of the tax policies is an example of a proportional tax?
A)Alpha
B)Gamma
C)Eta
D)Beta
E)Delta
Question
The table given below shows the absolute tax amounts under five different tax policies for respective income levels.Table 19.2
Refer to Table 19.2. The tax structure which leads to maximum income inequality is:
A)Beta.
B)Alpha.
C)Eta.
D)Gamma.
E)Delta.
Refer to Table 19.2. The tax structure which leads to maximum income inequality is:
A)Beta.
B)Alpha.
C)Eta.
D)Gamma.
E)Delta.
Question
The table given below shows the absolute tax amounts under five different tax policies for respective income levels.Table 19.2
Unemployment insurance provided by the U.S. government is usually funded by:
A)the excise duties imposed on the import of foreign goods.
B)the national tax on payrolls levied on firms.
C)external borrowing by the U.S. government.
D)printing new money.
E)selling off government bonds.
Unemployment insurance provided by the U.S. government is usually funded by:
A)the excise duties imposed on the import of foreign goods.
B)the national tax on payrolls levied on firms.
C)external borrowing by the U.S. government.
D)printing new money.
E)selling off government bonds.
Question
The table given below shows the absolute tax amounts under five different tax policies for respective income levels.Table 19.2
Which of the following is true of transfer programs?
A)They involve redistributing income from lower-income individuals to higher-income individuals.
B)They place a high implicit tax on work.
C)They increase the opportunity cost of leisure.
D)They indirectly help in decreasing the unemployment rate in an economy.
E)They result in an increased productivity of labor and a rise in the total output of an economy.
Question
The table given below shows the absolute tax amounts under five different tax policies for respective income levels.Table 19.2
The largest in-kind transfer received by the poor households in the U.S. is:
A)Old-Age, Survivors, and Disability Insurance.
B)the Head Start special education program for poor children.
C)Medicaid, which provides long-term medical care for the poor.
D)the food stamp program, which distributes food coupons to poor households.
E)Temporary Assistance for Needy Families.
Question
The table given below shows the absolute tax amounts under five different tax policies for respective income levels.Table 19.2
Supplementary Security Incomes are provided by the U.S. government to those who:
A)regularly pay a social security tax.
B)are below 65 years of age.
C)lack the required education to be absorbed in the job market.
D)earn less than $4,500 per year.
E)are temporarily unemployed.
Supplementary Security Incomes are provided by the U.S. government to those who:
A)regularly pay a social security tax.
B)are below 65 years of age.
C)lack the required education to be absorbed in the job market.
D)earn less than $4,500 per year.
E)are temporarily unemployed.
Question
The figure given below shows the Lorenz curves of two countries (Country A and Country B).Figure 19.2
Total income (cumulative percentage)
Total population (cumuative percentage)
In a progressive tax structure:
A)both the tax rate and absolute tax amount increase with an increase in income.
B)the tax rate remains constant, but the absolute tax amount increases with an increase in income.
C)both the tax rate and absolute tax amount decline with an increase in income.
D)the tax rate falls,but the absolute tax amount increases with an increase in income.
E)the tax rate increases, but the absolute tax amount decreases with an increase in income.
Question
The table given below shows the absolute tax amounts under five different tax policies for respective income levels.Table 19.2
Which of the following tax structures creates a disincentive to earn more?
A)Proportional tax structure
B)Regressive tax structure
C)Digressive tax structure
D)Progressive tax structure
E)A combination of proportional and regressive tax structure
Which of the following tax structures creates a disincentive to earn more?
A)Proportional tax structure
B)Regressive tax structure
C)Digressive tax structure
D)Progressive tax structure
E)A combination of proportional and regressive tax structure
Question
The table given below shows the absolute tax amounts under five different tax policies for respective income levels.Table 19.2
Taxes are one method of funding the poverty alleviation programs by the government. Which of the following is an important impact of taxes?
A)Taxes increase workers' incentives to work for longer hours.
B)Taxes raise the disposable income of the workers.
C)Imposition of taxes makes the government popular among the people.
D)Taxes reduce the opportunity cost of leisure.
E)Taxes reduce the demand for labor.
Question
The table given below shows the absolute tax amounts under five different tax policies for respective income levels.Table 19.2
Refer to Table 19.2. Which of the following tax policies is regressive by nature?
A)Alpha
B)Beta
C)Gamma
D)Delta
E)Eta
Refer to Table 19.2. Which of the following tax policies is regressive by nature?
A)Alpha
B)Beta
C)Gamma
D)Delta
E)Eta
Question
The table given below shows the absolute tax amounts under five different tax policies for respective income levels.Table 19.2
Refer to Table 19.2. The _____ is an example of a progressive tax structure.
A)tax policy Eta
B)tax policy Delta
C)tax policy Alpha
D)tax policy Beta
E)tax policy Gamma
Refer to Table 19.2. The _____ is an example of a progressive tax structure.
A)tax policy Eta
B)tax policy Delta
C)tax policy Alpha
D)tax policy Beta
E)tax policy Gamma
Question
The table given below shows the absolute tax amounts under five different tax policies for respective income levels.Table 19.2
Unemployment compensation programs tend to increase the unemployment rate because:
A)they increase the opportunity cost of leisure.
B)they provide benefits only to unemployed people under the age of 18.
C)they legally fix the minimum wage that has to be paid to labor.
D)they allow unemployed persons to become more selective in what job offer they accept.
E)they do not provide benefits to labor engaged in the manufacturing sectors of the economy.
Question
The table given below shows the absolute tax amounts under five different tax policies for respective income levels.Table 19.2
The longer the time period considered, the greater the mobility within an income distribution.
The longer the time period considered, the greater the mobility within an income distribution.
Question
The table given below shows the absolute tax amounts under five different tax policies for respective income levels.Table 19.2
The income tax structure in the United States is regressive in nature.
The income tax structure in the United States is regressive in nature.
Question
The table given below shows the absolute tax amounts under five different tax policies for respective income levels.Table 19.2
Which of the following transfer programs in the U.S. is funded by a national tax but administered by state governments?
A)Social security
B)Veterans' Administration Benefit program
C)Unemployment insurance
D)Food stamps
E)National Guard activities
Which of the following transfer programs in the U.S. is funded by a national tax but administered by state governments?
A)Social security
B)Veterans' Administration Benefit program
C)Unemployment insurance
D)Food stamps
E)National Guard activities
Question
The table given below shows the absolute tax amounts under five different tax policies for respective income levels.Table 19.2
Unemployment insurance programs provide benefits to permanently unemployed people.
Unemployment insurance programs provide benefits to permanently unemployed people.
Question
The table given below shows the absolute tax amounts under five different tax policies for respective income levels.Table 19.2
Before-tax incomes are a better measure of income as compared to after-tax incomes.
Before-tax incomes are a better measure of income as compared to after-tax incomes.
Question
The table given below shows the absolute tax amounts under five different tax policies for respective income levels.Table 19.2
Someone who has the desire to work but has no exceptional abilities and has not acquired the skills necessary for a well-paying job is likely to escape poverty completely.
Someone who has the desire to work but has no exceptional abilities and has not acquired the skills necessary for a well-paying job is likely to escape poverty completely.
Question
The table given below shows the absolute tax amounts under five different tax policies for respective income levels.Table 19.2
A proportional tax is a tax whose rate increases as the tax base widens.
A proportional tax is a tax whose rate increases as the tax base widens.
Question
The table given below shows the absolute tax amounts under five different tax policies for respective income levels.Table 19.2
The farther the Lorenz curve from the line of perfect equality, the lower is the income inequality.
The farther the Lorenz curve from the line of perfect equality, the lower is the income inequality.
Question
The table given below shows the absolute tax amounts under five different tax policies for respective income levels.Table 19.2
Which of the following results in the superstar effect?
A)An increase in the minimum wage for sports stars
B)A decrease in the demand for televisions
C)A technological improvement due to which a baseball game can be broadcast across the world
D)A rise in the unemployment rate in the service sector of an economy
E)A decline in the returns to capital in an economy
Question
The table given below shows the absolute tax amounts under five different tax policies for respective income levels.Table 19.2
Government policies designed to change the distribution of income to one that is more equal involve taking from the rich and giving to the poor.
Government policies designed to change the distribution of income to one that is more equal involve taking from the rich and giving to the poor.
Question
The table given below shows the absolute tax amounts under five different tax policies for respective income levels.Table 19.2
It is often found that there is a sufficient mobility within the income distribution such that a person in the lowest quintile of income can move to the higher ones and vice versa.
It is often found that there is a sufficient mobility within the income distribution such that a person in the lowest quintile of income can move to the higher ones and vice versa.
Question
The table given below shows the absolute tax amounts under five different tax policies for respective income levels.Table 19.2
The size of a family or household does not affect the data used to measure income inequality.
The size of a family or household does not affect the data used to measure income inequality.
Question
The table given below shows the absolute tax amounts under five different tax policies for respective income levels.Table 19.2
The "Robin Hood" tax policy, which taxes the rich to give to the poor, is best described by economists as:
A)a proportional tax policy.
B)a regressive tax policy.
C)a poll tax policy.
D)a progressive tax policy.
E)a capital tax policy.
The "Robin Hood" tax policy, which taxes the rich to give to the poor, is best described by economists as:
A)a proportional tax policy.
B)a regressive tax policy.
C)a poll tax policy.
D)a progressive tax policy.
E)a capital tax policy.
Question
The table given below shows the absolute tax amounts under five different tax policies for respective income levels.Table 19.2
At each point on the line of income equality, the percentage of total population and the percentage of total income are equal.
At each point on the line of income equality, the percentage of total population and the percentage of total income are equal.
Question
The table given below shows the absolute tax amounts under five different tax policies for respective income levels.Table 19.2
Rising income inequality is driven by:
A)an increase in employment in the manufacturing sector of an economy.
B)a progressive tax structure.
C)a rising demand for unskilled, cheap labor.
D)a technological advancement.
E)a fall in capital's share of national income.
Rising income inequality is driven by:
A)an increase in employment in the manufacturing sector of an economy.
B)a progressive tax structure.
C)a rising demand for unskilled, cheap labor.
D)a technological advancement.
E)a fall in capital's share of national income.
Question
The table given below shows the absolute tax amounts under five different tax policies for respective income levels.Table 19.2
The poverty threshold is often determined in terms of the expenditure on meals that meet a predetermined nutritional standard.
The poverty threshold is often determined in terms of the expenditure on meals that meet a predetermined nutritional standard.
Question
The table given below shows the absolute tax amounts under five different tax policies for respective income levels.Table 19.2
If everyone in an economy had equal income, the Lorenz curve would be a curve that intersects the line of income equality at the point at which 50 percent of the population earns 50 percent of the income.
If everyone in an economy had equal income, the Lorenz curve would be a curve that intersects the line of income equality at the point at which 50 percent of the population earns 50 percent of the income.
Question
The table given below shows the absolute tax amounts under five different tax policies for respective income levels.Table 19.2
Economic stagnation and recession result in unemployment and poverty.
Economic stagnation and recession result in unemployment and poverty.
Question
The table given below shows the absolute tax amounts under five different tax policies for respective income levels.Table 19.2
A proportional tax tends to:
A)reduce income inequality.
B)increase overall income inequality.
C)leave the income distribution essentially unchanged.
D)increase income inequality among the rich.
E)generate additional tax revenues for the government.
A proportional tax tends to:
A)reduce income inequality.
B)increase overall income inequality.
C)leave the income distribution essentially unchanged.
D)increase income inequality among the rich.
E)generate additional tax revenues for the government.
Question
The table given below shows the absolute tax amounts under five different tax policies for respective income levels.Table 19.2
Those who argue that welfare programs are a drag on the economy are of the view that welfare programs funded by taxes:
A)reduce the opportunity cost of labor.
B)raise the incidence of poverty and income inequality.
C)raise the incentive to work.
D)reduce the tax-liability of the tax-payers.
E)reduce the demand for labor.

Unlock Deck
Sign up to unlock the cards in this deck!
Unlock Deck
Unlock Deck
1/85
Play
Full screen (f)
Deck 19: Current Issues: Income, Income Distribution, Poverty, and Government Policy
1
The table below shows the distribution of income in the U.S. in the year 1978.Table 19.1
Refer to Table 19.1. What percentage of income is received by the bottom 20% of the households?
A)10.3%
B)43.9%
C)24.7%
D)4.3%
E)16.9%
Refer to Table 19.1. What percentage of income is received by the bottom 20% of the households?
A)10.3%
B)43.9%
C)24.7%
D)4.3%
E)16.9%
4.3%
2
The figure given below represents an imperfectly competitive resource market. Here common land (and not land used for specific purpose) is under consideration.Figure 18.1
In Country X, the highest 10 percent of families account for 70 percent of the income. In Country Y, the highest 10 percent of families account for 20 percent of the income. In this example:
A)Country Y would be located on the line of perfect inequality.
B)income is more equally distributed in Country Y.
C)income is more equally distributed in Country X.
D)Country X would be located on the line of perfect equality.
E)the degree of income inequality is equal in both the countries.
income is more equally distributed in Country Y.
3
The figure given below represents an imperfectly competitive resource market. Here common land (and not land used for specific purpose) is under consideration.Figure 18.1
Assume that any given percentage of the population earns an equal percentage of real GDP. This percentage of population will be represented by:
A)a point below the line of income equality.
B)a line lying below the line of income equality.
C)a point on the line of income equality.
D)a line lying above the line of income equality.
E)a point above the line of income equality.
a point on the line of income equality.
4
The figure given below represents an imperfectly competitive resource market. Here common land (and not land used for specific purpose) is under consideration.Figure 18.1
If the Gini co-efficient for an economy is 0.85, which of the following statements is true?
A)The national income of this economy is more or less equally distributed.
B)The Lorenz curve for the economy will bow above the line of perfect equality.
C)The Lorenz curve for the economy will coincide with the line of perfect equality.
D)The Lorenz curve for the economy will bow down below the line of perfect equality.
E)The Lorenz curve for the economy will be a rectangle.
Unlock Deck
Unlock for access to all 85 flashcards in this deck.
Unlock Deck
k this deck
5
The figure given below represents an imperfectly competitive resource market. Here common land (and not land used for specific purpose) is under consideration.Figure 18.1
A Gini of 0 implies that:
A)every family has an equal amount of income.
B)the top 10% of the families appropriate almost 100% of the total income.
C)the bottom 90% of the families have only 10% of the total income.
D)the bottom 20% of the families have 80% of the total income.
E)only 1 family appropriates the entire national income.
Unlock Deck
Unlock for access to all 85 flashcards in this deck.
Unlock Deck
k this deck
6
The table below shows the distribution of income in the U.S. in the year 1978.Table 19.1
According to Table 19.1, what percentage of income is received by the top 40% of the population?
A)41.6%
B)51.9%
C)60.8%
D)56.2%
E)68.6%
According to Table 19.1, what percentage of income is received by the top 40% of the population?
A)41.6%
B)51.9%
C)60.8%
D)56.2%
E)68.6%
Unlock Deck
Unlock for access to all 85 flashcards in this deck.
Unlock Deck
k this deck
7
The figure given below represents an imperfectly competitive resource market. Here common land (and not land used for specific purpose) is under consideration.Figure 18.1
The diagram that represents how income is distributed among members of a population is known as a(n):
A)indifference curve.
B)Laffer curve.
C)Edgeworth box.
D)Lorenz curve.
E)Phillips curve
The diagram that represents how income is distributed among members of a population is known as a(n):
A)indifference curve.
B)Laffer curve.
C)Edgeworth box.
D)Lorenz curve.
E)Phillips curve
Unlock Deck
Unlock for access to all 85 flashcards in this deck.
Unlock Deck
k this deck
8
The figure given below represents an imperfectly competitive resource market. Here common land (and not land used for specific purpose) is under consideration.Figure 18.1
Empirical observations validate that the Gini co-efficient for the U.S. economy was between 0.35 and 0.37 until the 1990s, after which it has increased and reached 0.469 in 2009. Which of the following can be inferred from this?
A)The distribution of national income in the U.S. has become slightly more equal since the 1990s.
B)The government spending on poverty alleviation has increased since 1990.
C)More jobs have been created in the U.S. since 1990.
D)The distribution of national income in the U.S. has become slightly more unequal since the 1990s.
E)The government has replaced the existing regressive tax structure with a progressive tax structure.
Unlock Deck
Unlock for access to all 85 flashcards in this deck.
Unlock Deck
k this deck
9
The table below shows the distribution of income in the U.S. in the year 1978.Table 19.1
Refer to Table 19.1. What percentage of households earn 31.5% of the income?
A)Bottom 20%
B)Top 20%
C)Bottom 60%
D)Top 40%
E)Top 10%
Refer to Table 19.1. What percentage of households earn 31.5% of the income?
A)Bottom 20%
B)Top 20%
C)Bottom 60%
D)Top 40%
E)Top 10%
Unlock Deck
Unlock for access to all 85 flashcards in this deck.
Unlock Deck
k this deck
10
The figure given below represents an imperfectly competitive resource market. Here common land (and not land used for specific purpose) is under consideration.Figure 18.1
Which of the following results from the market system of resource allocation?
A)Equitable distribution of resources
B)High opportunity cost of production
C)Excess supply of goods and services resulting in decreased profits
D)Unequal distribution of income and wealth
E)Allocation of the goods and services to those who need them the most
Unlock Deck
Unlock for access to all 85 flashcards in this deck.
Unlock Deck
k this deck
11
The figure given below represents an imperfectly competitive resource market. Here common land (and not land used for specific purpose) is under consideration.Figure 18.1
If everyone had the same income, then the Lorenz curve would:
A)be the line of income equality.
B)bow down below the line of income equality.
C)be a parallel line lying below the line of income equality.
D)bow up above the line of income equality.
E)be a curve that intersects the line of income equality at its mid-point.
Unlock Deck
Unlock for access to all 85 flashcards in this deck.
Unlock Deck
k this deck
12
The figure given below represents an imperfectly competitive resource market. Here common land (and not land used for specific purpose) is under consideration.Figure 18.1
If 50 percent of the population receives 20 percent of the total income, it can be represented on the Lorenz curve by:
A)a point below the line of income equality.
B)a line below the line of income equality.
C)a point on the line of income equality.
D)a line intersecting the line of income equality from below.
E)a point above the line of income equality.
Unlock Deck
Unlock for access to all 85 flashcards in this deck.
Unlock Deck
k this deck
13
The figure given below represents an imperfectly competitive resource market. Here common land (and not land used for specific purpose) is under consideration.Figure 18.1
In a market system, incomes are distributed according to the:
A)principle of equality.
B)directions of a central authority.
C)needs of the people.
D)ownership of resources.
E)objectives of a planning commission.
In a market system, incomes are distributed according to the:
A)principle of equality.
B)directions of a central authority.
C)needs of the people.
D)ownership of resources.
E)objectives of a planning commission.
Unlock Deck
Unlock for access to all 85 flashcards in this deck.
Unlock Deck
k this deck
14
The figure given below represents an imperfectly competitive resource market. Here common land (and not land used for specific purpose) is under consideration.Figure 18.1
If the Gini coefficient for the United States is 0.47 and that for India is 0.36, which of the following statements is true?
A)The U.S. being an industrialized nation has a lower income inequality than India.
B)The Lorenz curve for the U.S. lies above the Lorenz curve for India.
C)India, in spite of being a developing nation, has lesser income inequality than the U.S.
D)The Lorenz curve for India would coincide with the line of perfect equality.
E)The distribution of income in both the economies are equal.
Unlock Deck
Unlock for access to all 85 flashcards in this deck.
Unlock Deck
k this deck
15
The figure given below represents an imperfectly competitive resource market. Here common land (and not land used for specific purpose) is under consideration.Figure 18.1
The Gini co-efficient is the:
A)area between the Lorenz curve and the vertical axis divided by the area under the Lorenz curve.
B)area between the Lorenz curve and the horizontal axis divided by the area above the Lorenz curve.
C)area between the Lorenz curve and the line of perfect equality divided by the total area under the line of income equality.
D)area between the Lorenz curve and the line of perfect equality divided by the total area above the line of perfect equality.
E)area between the line of perfect equality and the horizontal axis divided by the area between the Lorenz curve and the horizontal axis.
Unlock Deck
Unlock for access to all 85 flashcards in this deck.
Unlock Deck
k this deck
16
The figure given below represents an imperfectly competitive resource market. Here common land (and not land used for specific purpose) is under consideration.Figure 18.1
Income inequality is indicated by a Lorenz curve that:
A)bows up, away from the line of income equality.
B)bows down, away from the line of income equality.
C)lies parallel to the line of income equality.
D)coincides with the line of income equality.
E)approaches the vertical axis.
Income inequality is indicated by a Lorenz curve that:
A)bows up, away from the line of income equality.
B)bows down, away from the line of income equality.
C)lies parallel to the line of income equality.
D)coincides with the line of income equality.
E)approaches the vertical axis.
Unlock Deck
Unlock for access to all 85 flashcards in this deck.
Unlock Deck
k this deck
17
The figure given below represents an imperfectly competitive resource market. Here common land (and not land used for specific purpose) is under consideration.Figure 18.1
The 45-degree line splitting the distance between the axes in a Lorenz Curve is the:
A)line of equal share of expenditure.
B)line of equivalent income.
C)line of income equality.
D)line of average income.
E)line of absolute inequality.
The 45-degree line splitting the distance between the axes in a Lorenz Curve is the:
A)line of equal share of expenditure.
B)line of equivalent income.
C)line of income equality.
D)line of average income.
E)line of absolute inequality.
Unlock Deck
Unlock for access to all 85 flashcards in this deck.
Unlock Deck
k this deck
18
The figure given below represents an imperfectly competitive resource market. Here common land (and not land used for specific purpose) is under consideration.Figure 18.1
The horizontal and vertical axes of the Lorenz curve respectively measure:
A)total income and total expenditure as cumulative percentages.
B)total income and total population as cumulative percentages.
C)total population and total expenditure as cumulative percentages.
D)total expenditure and total income as cumulative percentages.
E)total population and total income as cumulative percentages.
Unlock Deck
Unlock for access to all 85 flashcards in this deck.
Unlock Deck
k this deck
19
The figure given below represents an imperfectly competitive resource market. Here common land (and not land used for specific purpose) is under consideration.Figure 18.1
For an economy, the greater the value of the Gini co-efficient, _____.
A)the greater will be the GDP.
B)the greater will be the income inequality
C)the greater will be the revenue of the government from direct taxes
D)the greater will be the equality in the distribution of income and wealth
E)the lesser will be the expenditure on the part of the government
Unlock Deck
Unlock for access to all 85 flashcards in this deck.
Unlock Deck
k this deck
20
The table below shows the distribution of income in the U.S. in the year 1978.Table 19.1
If a Lorenz curve is drawn using the data in Table 19.1, it will:
A)coincide with the line of perfect equality.
B)be an L-shaped curve.
C)bow above the line of perfect equality.
D)bow down below the line of perfect equality.
E)be a rectangular-shaped curve.
If a Lorenz curve is drawn using the data in Table 19.1, it will:
A)coincide with the line of perfect equality.
B)be an L-shaped curve.
C)bow above the line of perfect equality.
D)bow down below the line of perfect equality.
E)be a rectangular-shaped curve.
Unlock Deck
Unlock for access to all 85 flashcards in this deck.
Unlock Deck
k this deck
21
The figure given below shows the Lorenz curves of two countries (Country A and Country B).Figure 19.2
Total income (cumulative percentage)
Total population (cumuative percentage)
Refer to Figure 19.2. The richest 20 percent of the population in Country A receive:
A)10 percent of the national income.
B)20 percent of the national income.
C)30 percent of the national income.
D)40 percent of the national income.
E)50 percent of the national income.
Unlock Deck
Unlock for access to all 85 flashcards in this deck.
Unlock Deck
k this deck
22
The figure given below shows the Lorenz curves of two countries (Country A and Country B).Figure 19.2
Total income (cumulative percentage)
Total population (cumuative percentage)
The extent to which people move from one income quintile to another over time is called _____.
A)migrancy
B)moveability
C)mobility
D)exchangeability
E)transferability
Total income (cumulative percentage)
Total population (cumuative percentage)
The extent to which people move from one income quintile to another over time is called _____.
A)migrancy
B)moveability
C)mobility
D)exchangeability
E)transferability
Unlock Deck
Unlock for access to all 85 flashcards in this deck.
Unlock Deck
k this deck
23
The figure given below shows the Lorenz curves of two countries (Country A and Country B).Figure 19.2
Total income (cumulative percentage)
Total population (cumuative percentage)
The official poverty-line income is adjusted annually for _____.
A)income taxes
B)unemployment compensation benefits
C)house rents
D)inflation
E)increases in health-care costs
Total income (cumulative percentage)
Total population (cumuative percentage)
The official poverty-line income is adjusted annually for _____.
A)income taxes
B)unemployment compensation benefits
C)house rents
D)inflation
E)increases in health-care costs
Unlock Deck
Unlock for access to all 85 flashcards in this deck.
Unlock Deck
k this deck
24
The figure given below shows the Lorenz curves of two countries (Country A and Country B).Figure 19.2
Total income (cumulative percentage)
Total population (cumuative percentage)
_____ are most likely to be upwardly mobile within the income distribution of a country.
A)Single-earner families
B)College graduates
C)People who experience unemployment
D)Non-college graduates
E)Retired individuals
Total income (cumulative percentage)
Total population (cumuative percentage)
_____ are most likely to be upwardly mobile within the income distribution of a country.
A)Single-earner families
B)College graduates
C)People who experience unemployment
D)Non-college graduates
E)Retired individuals
Unlock Deck
Unlock for access to all 85 flashcards in this deck.
Unlock Deck
k this deck
25
The figure given below shows the Lorenz curves of two countries (Country A and Country B).Figure 19.2
Total income (cumulative percentage)
Total population (cumuative percentage)
The allocations of goods and services from one group in a society to another are called:
A)mutually voluntary exchanges.
B)in-kind transfers.
C)grants.
D)economic rents.
E)transfer earnings.
Total income (cumulative percentage)
Total population (cumuative percentage)
The allocations of goods and services from one group in a society to another are called:
A)mutually voluntary exchanges.
B)in-kind transfers.
C)grants.
D)economic rents.
E)transfer earnings.
Unlock Deck
Unlock for access to all 85 flashcards in this deck.
Unlock Deck
k this deck
26
The figure given below shows the Lorenz curves of two countries (Country A and Country B).Figure 19.2
Total income (cumulative percentage)
Total population (cumuative percentage)
In Figure 19.2, the poorest 60 percent of the population in Country B receive:
A)30 percent of the national income.
B)40 percent of the national income.
C)60 percent of the national income.
D)20 percent of the national income.
E)10 percent of the national income.
Unlock Deck
Unlock for access to all 85 flashcards in this deck.
Unlock Deck
k this deck
27
The figure given below shows the Lorenz curves of two countries (Country A and Country B).Figure 19.2
Total income (cumulative percentage)
Total population (cumuative percentage)
A major problem with household data is that:
A)the income of the households vary greatly.
B)the households usually vary in their consumption patterns.
C)the households usually comprise of only one individual.
D)collecting data from the households is highly inconvenient.
E)the number of persons per household varies greatly.
Unlock Deck
Unlock for access to all 85 flashcards in this deck.
Unlock Deck
k this deck
28
The figure below shows two Lorenz curves, Y and Z.Figure 19.1
In Figure 19.1, which of the following could occur in the short run given the introduction of a regressive income tax?
A)The Lorenz curve OZB would shift to OYB.
B)The Lorenz curve OYB would coincide with the line OXB.
C)The Lorenz curve OZB would coincide with the line OXB.
D)The Lorenz curve OYB would coincide with the horizontal axis.
E)The Lorenz curve would shift from OYB to OZB.
Unlock Deck
Unlock for access to all 85 flashcards in this deck.
Unlock Deck
k this deck
29
The figure given below shows the Lorenz curves of two countries (Country A and Country B).Figure 19.2
Total income (cumulative percentage)
Total population (cumuative percentage)
Which of the following is an example of in-kind transfer?
A)Social security benefits
B)Food stamps
C)Disability pensions
D)Unemployment compensations
E)Earned income tax credit
Total income (cumulative percentage)
Total population (cumuative percentage)
Which of the following is an example of in-kind transfer?
A)Social security benefits
B)Food stamps
C)Disability pensions
D)Unemployment compensations
E)Earned income tax credit
Unlock Deck
Unlock for access to all 85 flashcards in this deck.
Unlock Deck
k this deck
30
The figure given below shows the Lorenz curves of two countries (Country A and Country B).Figure 19.2
Total income (cumulative percentage)
Total population (cumuative percentage)
_____ are the primary population group with poverty-level incomes in the USA.
A)Single-income households
B)Households headed by males
C)College graduates
D)People who do not have high school education
E)Retired individuals
Total income (cumulative percentage)
Total population (cumuative percentage)
_____ are the primary population group with poverty-level incomes in the USA.
A)Single-income households
B)Households headed by males
C)College graduates
D)People who do not have high school education
E)Retired individuals
Unlock Deck
Unlock for access to all 85 flashcards in this deck.
Unlock Deck
k this deck
31
The figure given below shows the Lorenz curves of two countries (Country A and Country B).Figure 19.2
Total income (cumulative percentage)
Total population (cumuative percentage)
If those who are poor at any one time are poor only temporarily, then their plight is only temporary. This statement is based on which of the following assumptions?
A)Many spells of poverty are relatively short-lived.
B)Government spending in the economy is inadequate.
C)All phases of the business cycle are temporary.
D)Education infrastructure in the economy is poor.
E)Once people fall below the poverty line, it is almost impossible for them to rise above it.
Unlock Deck
Unlock for access to all 85 flashcards in this deck.
Unlock Deck
k this deck
32
The figure given below shows the Lorenz curves of two countries (Country A and Country B).Figure 19.2
Total income (cumulative percentage)
Total population (cumuative percentage)
Why does the census data overstate inequality?
A)They overestimate the non cash transfers received by the people from the government.
B)They take into account the after-tax incomes.
C)They take into account the gifts and transfer receipts from friends and relatives staying abroad.
D)They do not consider the in-kind transfers received by the people from the government.
E)They overestimate the medical benefits received by the people from the government.
Unlock Deck
Unlock for access to all 85 flashcards in this deck.
Unlock Deck
k this deck
33
The figure given below shows the Lorenz curves of two countries (Country A and Country B).Figure 19.2
Total income (cumulative percentage)
Total population (cumuative percentage)
Refer to Figure 19.2 and identify the correct statement.
A)The top 10 percent of the population in Country B receive 20 percent of the national income.
B)The top 10 percent of the population in Country A receive 70 percent of the national income.
C)Country A has a greater degree of income inequality than Country B.
D)The bottom 90 percent of the population in Country B receive 90 percent of the national income.
E)The poorest 20 percent of the population in Country A receive 10 percent of the national income.
Unlock Deck
Unlock for access to all 85 flashcards in this deck.
Unlock Deck
k this deck
34
The figure given below shows the Lorenz curves of two countries (Country A and Country B).Figure 19.2
Total income (cumulative percentage)
Total population (cumuative percentage)
Following are the controversies over how poverty should be measured, except:
A)government transfers and other programs are not properly taken into account in the measures of poverty.
B)the poverty measures do not distinguish among the needs of different individuals.
C)the concept of poverty line does not draw any distinction between income and purchasing power.
D)the concept of poverty line does not take into account the expenditure on food by each family.
E)the income generated in the underground economy are not taken into account.
Unlock Deck
Unlock for access to all 85 flashcards in this deck.
Unlock Deck
k this deck
35
The figure given below shows the Lorenz curves of two countries (Country A and Country B).Figure 19.2
Total income (cumulative percentage)
Total population (cumuative percentage)
The measures of absolute poverty:
A)are inversely related to the degree of income equality in a country.
B)are directly related to the degree of income equality in a country.
C)depend on the prosperity of the poorest 50 percent of population.
D)determine the degree of income inequality.
E)are completely independent of the degree of income inequality.
Unlock Deck
Unlock for access to all 85 flashcards in this deck.
Unlock Deck
k this deck
36
The figure given below shows the Lorenz curves of two countries (Country A and Country B).Figure 19.2
Total income (cumulative percentage)
Total population (cumuative percentage)
Which of the following is a cash transfer received from the government?
A)Medicaid
B)Earned Income Tax Credit
C)Food stamps
D)Housing assistance
E)Free education
Total income (cumulative percentage)
Total population (cumuative percentage)
Which of the following is a cash transfer received from the government?
A)Medicaid
B)Earned Income Tax Credit
C)Food stamps
D)Housing assistance
E)Free education
Unlock Deck
Unlock for access to all 85 flashcards in this deck.
Unlock Deck
k this deck
37
The figure below shows two Lorenz curves, Y and Z.Figure 19.1
According to Figure 19.1, which of the following is true?
A)Line OZB is the line of perfect income inequality.
B)Curve OYB represents a less equal distribution of income than curve OZB.
C)Line AB represents a society in which wealth is shared equally among individuals.
D)Line OXB is the line of perfect income equality.
E)Line AB represents a society in which 50 percent of the population receives all the income.
Unlock Deck
Unlock for access to all 85 flashcards in this deck.
Unlock Deck
k this deck
38
The figure given below shows the Lorenz curves of two countries (Country A and Country B).Figure 19.2
Total income (cumulative percentage)
Total population (cumuative percentage)
Which of the following is an absolute measure of poverty?
A)Gini co-efficient
B)Per capita income
C)HiLo ratio
D)Hoover index
E)Theil index
Total income (cumulative percentage)
Total population (cumuative percentage)
Which of the following is an absolute measure of poverty?
A)Gini co-efficient
B)Per capita income
C)HiLo ratio
D)Hoover index
E)Theil index
Unlock Deck
Unlock for access to all 85 flashcards in this deck.
Unlock Deck
k this deck
39
The figure given below shows the Lorenz curves of two countries (Country A and Country B).Figure 19.2
Total income (cumulative percentage)
Total population (cumuative percentage)
Per capita income is calculated as:
A)national income divided by number of households.
B)national income divided by number of people.
C)number of households divided by national income.
D)number of people divided by national income.
E)number of people divided by domestic income.
Unlock Deck
Unlock for access to all 85 flashcards in this deck.
Unlock Deck
k this deck
40
The figure given below shows the Lorenz curves of two countries (Country A and Country B).Figure 19.2
Total income (cumulative percentage)
Total population (cumuative percentage)
In Figure 19.2, the richest 20 percent of the population in Country B receive:
A)20 percent of the national income.
B)60 percent of the national income.
C)50 percent of the national income.
D)40 percent of the national income.
E)80 percent of the national income.
Unlock Deck
Unlock for access to all 85 flashcards in this deck.
Unlock Deck
k this deck
41
The figure given below shows the Lorenz curves of two countries (Country A and Country B).Figure 19.2
Total income (cumulative percentage)
Total population (cumuative percentage)
Which of the following tax structures helps in reducing income inequality?
A)Proportional tax structure
B)Regressive tax structure
C)Indirect tax structure
D)Progressive tax structure
E)A combination of proportional and regressive tax structure.
Unlock Deck
Unlock for access to all 85 flashcards in this deck.
Unlock Deck
k this deck
42
The figure given below shows the Lorenz curves of two countries (Country A and Country B).Figure 19.2
Total income (cumulative percentage)
Total population (cumuative percentage)
Which of the following statements in the context of poverty in the U.S. is true?
A)Families headed by males are likely to be poor.
B)Caucasian Americans carry a much heavier burden of poverty compared to the native Americans.
C)Education and technical skills do not affect employment in the United States of America.
D)Females tend to have a greater literacy rate than males in the United States of America.
E)Minorities, young and disabled have a higher likelihood to fall into poverty
Unlock Deck
Unlock for access to all 85 flashcards in this deck.
Unlock Deck
k this deck
43
The figure given below shows the Lorenz curves of two countries (Country A and Country B).Figure 19.2
Total income (cumulative percentage)
Total population (cumuative percentage)
Which of the following are most likely to be in poverty?
A)Families headed by a male
B)White males
C)Disabled people
D)Married couples
E)People with a college degree
Total income (cumulative percentage)
Total population (cumuative percentage)
Which of the following are most likely to be in poverty?
A)Families headed by a male
B)White males
C)Disabled people
D)Married couples
E)People with a college degree
Unlock Deck
Unlock for access to all 85 flashcards in this deck.
Unlock Deck
k this deck
44
The table given below shows the absolute tax amounts under five different tax policies for respective income levels.Table 19.2
_____ is the largest social insurance program in the U.S.
A)Medicaid
B)The food stamp program
C)Supplementary security insurance
D)The Head Start program
E)Old-Age, Survivors, and Disability Insurance
_____ is the largest social insurance program in the U.S.
A)Medicaid
B)The food stamp program
C)Supplementary security insurance
D)The Head Start program
E)Old-Age, Survivors, and Disability Insurance
Unlock Deck
Unlock for access to all 85 flashcards in this deck.
Unlock Deck
k this deck
45
The table given below shows the absolute tax amounts under five different tax policies for respective income levels.Table 19.2
Transfer programs are so named because they transfer:
A)the burden of poverty alleviation from the church to the state.
B)the poverty from the country side to the city.
C)the responsibility for maintaining minimum standards of living from the federal government to state governments.
D)income from the relatively high-income people to relatively low-income people.
E)the incidence of poverty from predominantly ethnic groups to the majority white population.
Unlock Deck
Unlock for access to all 85 flashcards in this deck.
Unlock Deck
k this deck
46
The table given below shows the absolute tax amounts under five different tax policies for respective income levels.Table 19.2
The main transfer programs of the U.S. government include each of the following, except:
A)social insurance.
B)cash welfare or public assistance.
C)in-kind transfers.
D)veterans' benefits.
E)employment programs.
The main transfer programs of the U.S. government include each of the following, except:
A)social insurance.
B)cash welfare or public assistance.
C)in-kind transfers.
D)veterans' benefits.
E)employment programs.
Unlock Deck
Unlock for access to all 85 flashcards in this deck.
Unlock Deck
k this deck
47
The figure given below shows the Lorenz curves of two countries (Country A and Country B).Figure 19.2
Total income (cumulative percentage)
Total population (cumuative percentage)
If an individual who earns $20,000 pays $2,000 in taxes and another individual who earns $100,000 pays $10,000 in taxes, then these individuals are being taxed under a _______ tax system.
A)toll
B)regressive
C)progressive
D)proportional
E)negative income
Unlock Deck
Unlock for access to all 85 flashcards in this deck.
Unlock Deck
k this deck
48
The table given below shows the absolute tax amounts under five different tax policies for respective income levels.Table 19.2
An imposition of tax by the government for funding welfare programs raises the cost of labor to firms as:
A)the demand for labor increases.
B)the demand for labor decreases.
C)the supply of labor decreases.
D)the supply of labor increases.
E)the opportunity cost of leisure increases.
An imposition of tax by the government for funding welfare programs raises the cost of labor to firms as:
A)the demand for labor increases.
B)the demand for labor decreases.
C)the supply of labor decreases.
D)the supply of labor increases.
E)the opportunity cost of leisure increases.
Unlock Deck
Unlock for access to all 85 flashcards in this deck.
Unlock Deck
k this deck
49
The table given below shows the absolute tax amounts under five different tax policies for respective income levels.Table 19.2
Refer to Table 19.2. Which of the tax policies is an example of a proportional tax?
A)Alpha
B)Gamma
C)Eta
D)Beta
E)Delta
Refer to Table 19.2. Which of the tax policies is an example of a proportional tax?
A)Alpha
B)Gamma
C)Eta
D)Beta
E)Delta
Unlock Deck
Unlock for access to all 85 flashcards in this deck.
Unlock Deck
k this deck
50
The table given below shows the absolute tax amounts under five different tax policies for respective income levels.Table 19.2
Refer to Table 19.2. The tax structure which leads to maximum income inequality is:
A)Beta.
B)Alpha.
C)Eta.
D)Gamma.
E)Delta.
Refer to Table 19.2. The tax structure which leads to maximum income inequality is:
A)Beta.
B)Alpha.
C)Eta.
D)Gamma.
E)Delta.
Unlock Deck
Unlock for access to all 85 flashcards in this deck.
Unlock Deck
k this deck
51
The table given below shows the absolute tax amounts under five different tax policies for respective income levels.Table 19.2
Unemployment insurance provided by the U.S. government is usually funded by:
A)the excise duties imposed on the import of foreign goods.
B)the national tax on payrolls levied on firms.
C)external borrowing by the U.S. government.
D)printing new money.
E)selling off government bonds.
Unemployment insurance provided by the U.S. government is usually funded by:
A)the excise duties imposed on the import of foreign goods.
B)the national tax on payrolls levied on firms.
C)external borrowing by the U.S. government.
D)printing new money.
E)selling off government bonds.
Unlock Deck
Unlock for access to all 85 flashcards in this deck.
Unlock Deck
k this deck
52
The table given below shows the absolute tax amounts under five different tax policies for respective income levels.Table 19.2
Which of the following is true of transfer programs?
A)They involve redistributing income from lower-income individuals to higher-income individuals.
B)They place a high implicit tax on work.
C)They increase the opportunity cost of leisure.
D)They indirectly help in decreasing the unemployment rate in an economy.
E)They result in an increased productivity of labor and a rise in the total output of an economy.
Unlock Deck
Unlock for access to all 85 flashcards in this deck.
Unlock Deck
k this deck
53
The table given below shows the absolute tax amounts under five different tax policies for respective income levels.Table 19.2
The largest in-kind transfer received by the poor households in the U.S. is:
A)Old-Age, Survivors, and Disability Insurance.
B)the Head Start special education program for poor children.
C)Medicaid, which provides long-term medical care for the poor.
D)the food stamp program, which distributes food coupons to poor households.
E)Temporary Assistance for Needy Families.
Unlock Deck
Unlock for access to all 85 flashcards in this deck.
Unlock Deck
k this deck
54
The table given below shows the absolute tax amounts under five different tax policies for respective income levels.Table 19.2
Supplementary Security Incomes are provided by the U.S. government to those who:
A)regularly pay a social security tax.
B)are below 65 years of age.
C)lack the required education to be absorbed in the job market.
D)earn less than $4,500 per year.
E)are temporarily unemployed.
Supplementary Security Incomes are provided by the U.S. government to those who:
A)regularly pay a social security tax.
B)are below 65 years of age.
C)lack the required education to be absorbed in the job market.
D)earn less than $4,500 per year.
E)are temporarily unemployed.
Unlock Deck
Unlock for access to all 85 flashcards in this deck.
Unlock Deck
k this deck
55
The figure given below shows the Lorenz curves of two countries (Country A and Country B).Figure 19.2
Total income (cumulative percentage)
Total population (cumuative percentage)
In a progressive tax structure:
A)both the tax rate and absolute tax amount increase with an increase in income.
B)the tax rate remains constant, but the absolute tax amount increases with an increase in income.
C)both the tax rate and absolute tax amount decline with an increase in income.
D)the tax rate falls,but the absolute tax amount increases with an increase in income.
E)the tax rate increases, but the absolute tax amount decreases with an increase in income.
Unlock Deck
Unlock for access to all 85 flashcards in this deck.
Unlock Deck
k this deck
56
The table given below shows the absolute tax amounts under five different tax policies for respective income levels.Table 19.2
Which of the following tax structures creates a disincentive to earn more?
A)Proportional tax structure
B)Regressive tax structure
C)Digressive tax structure
D)Progressive tax structure
E)A combination of proportional and regressive tax structure
Which of the following tax structures creates a disincentive to earn more?
A)Proportional tax structure
B)Regressive tax structure
C)Digressive tax structure
D)Progressive tax structure
E)A combination of proportional and regressive tax structure
Unlock Deck
Unlock for access to all 85 flashcards in this deck.
Unlock Deck
k this deck
57
The table given below shows the absolute tax amounts under five different tax policies for respective income levels.Table 19.2
Taxes are one method of funding the poverty alleviation programs by the government. Which of the following is an important impact of taxes?
A)Taxes increase workers' incentives to work for longer hours.
B)Taxes raise the disposable income of the workers.
C)Imposition of taxes makes the government popular among the people.
D)Taxes reduce the opportunity cost of leisure.
E)Taxes reduce the demand for labor.
Unlock Deck
Unlock for access to all 85 flashcards in this deck.
Unlock Deck
k this deck
58
The table given below shows the absolute tax amounts under five different tax policies for respective income levels.Table 19.2
Refer to Table 19.2. Which of the following tax policies is regressive by nature?
A)Alpha
B)Beta
C)Gamma
D)Delta
E)Eta
Refer to Table 19.2. Which of the following tax policies is regressive by nature?
A)Alpha
B)Beta
C)Gamma
D)Delta
E)Eta
Unlock Deck
Unlock for access to all 85 flashcards in this deck.
Unlock Deck
k this deck
59
The table given below shows the absolute tax amounts under five different tax policies for respective income levels.Table 19.2
Refer to Table 19.2. The _____ is an example of a progressive tax structure.
A)tax policy Eta
B)tax policy Delta
C)tax policy Alpha
D)tax policy Beta
E)tax policy Gamma
Refer to Table 19.2. The _____ is an example of a progressive tax structure.
A)tax policy Eta
B)tax policy Delta
C)tax policy Alpha
D)tax policy Beta
E)tax policy Gamma
Unlock Deck
Unlock for access to all 85 flashcards in this deck.
Unlock Deck
k this deck
60
The table given below shows the absolute tax amounts under five different tax policies for respective income levels.Table 19.2
Unemployment compensation programs tend to increase the unemployment rate because:
A)they increase the opportunity cost of leisure.
B)they provide benefits only to unemployed people under the age of 18.
C)they legally fix the minimum wage that has to be paid to labor.
D)they allow unemployed persons to become more selective in what job offer they accept.
E)they do not provide benefits to labor engaged in the manufacturing sectors of the economy.
Unlock Deck
Unlock for access to all 85 flashcards in this deck.
Unlock Deck
k this deck
61
The table given below shows the absolute tax amounts under five different tax policies for respective income levels.Table 19.2
The longer the time period considered, the greater the mobility within an income distribution.
The longer the time period considered, the greater the mobility within an income distribution.
Unlock Deck
Unlock for access to all 85 flashcards in this deck.
Unlock Deck
k this deck
62
The table given below shows the absolute tax amounts under five different tax policies for respective income levels.Table 19.2
The income tax structure in the United States is regressive in nature.
The income tax structure in the United States is regressive in nature.
Unlock Deck
Unlock for access to all 85 flashcards in this deck.
Unlock Deck
k this deck
63
The table given below shows the absolute tax amounts under five different tax policies for respective income levels.Table 19.2
Which of the following transfer programs in the U.S. is funded by a national tax but administered by state governments?
A)Social security
B)Veterans' Administration Benefit program
C)Unemployment insurance
D)Food stamps
E)National Guard activities
Which of the following transfer programs in the U.S. is funded by a national tax but administered by state governments?
A)Social security
B)Veterans' Administration Benefit program
C)Unemployment insurance
D)Food stamps
E)National Guard activities
Unlock Deck
Unlock for access to all 85 flashcards in this deck.
Unlock Deck
k this deck
64
The table given below shows the absolute tax amounts under five different tax policies for respective income levels.Table 19.2
Unemployment insurance programs provide benefits to permanently unemployed people.
Unemployment insurance programs provide benefits to permanently unemployed people.
Unlock Deck
Unlock for access to all 85 flashcards in this deck.
Unlock Deck
k this deck
65
The table given below shows the absolute tax amounts under five different tax policies for respective income levels.Table 19.2
Before-tax incomes are a better measure of income as compared to after-tax incomes.
Before-tax incomes are a better measure of income as compared to after-tax incomes.
Unlock Deck
Unlock for access to all 85 flashcards in this deck.
Unlock Deck
k this deck
66
The table given below shows the absolute tax amounts under five different tax policies for respective income levels.Table 19.2
Someone who has the desire to work but has no exceptional abilities and has not acquired the skills necessary for a well-paying job is likely to escape poverty completely.
Someone who has the desire to work but has no exceptional abilities and has not acquired the skills necessary for a well-paying job is likely to escape poverty completely.
Unlock Deck
Unlock for access to all 85 flashcards in this deck.
Unlock Deck
k this deck
67
The table given below shows the absolute tax amounts under five different tax policies for respective income levels.Table 19.2
A proportional tax is a tax whose rate increases as the tax base widens.
A proportional tax is a tax whose rate increases as the tax base widens.
Unlock Deck
Unlock for access to all 85 flashcards in this deck.
Unlock Deck
k this deck
68
The table given below shows the absolute tax amounts under five different tax policies for respective income levels.Table 19.2
The farther the Lorenz curve from the line of perfect equality, the lower is the income inequality.
The farther the Lorenz curve from the line of perfect equality, the lower is the income inequality.
Unlock Deck
Unlock for access to all 85 flashcards in this deck.
Unlock Deck
k this deck
69
The table given below shows the absolute tax amounts under five different tax policies for respective income levels.Table 19.2
Which of the following results in the superstar effect?
A)An increase in the minimum wage for sports stars
B)A decrease in the demand for televisions
C)A technological improvement due to which a baseball game can be broadcast across the world
D)A rise in the unemployment rate in the service sector of an economy
E)A decline in the returns to capital in an economy
Unlock Deck
Unlock for access to all 85 flashcards in this deck.
Unlock Deck
k this deck
70
The table given below shows the absolute tax amounts under five different tax policies for respective income levels.Table 19.2
Government policies designed to change the distribution of income to one that is more equal involve taking from the rich and giving to the poor.
Government policies designed to change the distribution of income to one that is more equal involve taking from the rich and giving to the poor.
Unlock Deck
Unlock for access to all 85 flashcards in this deck.
Unlock Deck
k this deck
71
The table given below shows the absolute tax amounts under five different tax policies for respective income levels.Table 19.2
It is often found that there is a sufficient mobility within the income distribution such that a person in the lowest quintile of income can move to the higher ones and vice versa.
It is often found that there is a sufficient mobility within the income distribution such that a person in the lowest quintile of income can move to the higher ones and vice versa.
Unlock Deck
Unlock for access to all 85 flashcards in this deck.
Unlock Deck
k this deck
72
The table given below shows the absolute tax amounts under five different tax policies for respective income levels.Table 19.2
The size of a family or household does not affect the data used to measure income inequality.
The size of a family or household does not affect the data used to measure income inequality.
Unlock Deck
Unlock for access to all 85 flashcards in this deck.
Unlock Deck
k this deck
73
The table given below shows the absolute tax amounts under five different tax policies for respective income levels.Table 19.2
The "Robin Hood" tax policy, which taxes the rich to give to the poor, is best described by economists as:
A)a proportional tax policy.
B)a regressive tax policy.
C)a poll tax policy.
D)a progressive tax policy.
E)a capital tax policy.
The "Robin Hood" tax policy, which taxes the rich to give to the poor, is best described by economists as:
A)a proportional tax policy.
B)a regressive tax policy.
C)a poll tax policy.
D)a progressive tax policy.
E)a capital tax policy.
Unlock Deck
Unlock for access to all 85 flashcards in this deck.
Unlock Deck
k this deck
74
The table given below shows the absolute tax amounts under five different tax policies for respective income levels.Table 19.2
At each point on the line of income equality, the percentage of total population and the percentage of total income are equal.
At each point on the line of income equality, the percentage of total population and the percentage of total income are equal.
Unlock Deck
Unlock for access to all 85 flashcards in this deck.
Unlock Deck
k this deck
75
The table given below shows the absolute tax amounts under five different tax policies for respective income levels.Table 19.2
Rising income inequality is driven by:
A)an increase in employment in the manufacturing sector of an economy.
B)a progressive tax structure.
C)a rising demand for unskilled, cheap labor.
D)a technological advancement.
E)a fall in capital's share of national income.
Rising income inequality is driven by:
A)an increase in employment in the manufacturing sector of an economy.
B)a progressive tax structure.
C)a rising demand for unskilled, cheap labor.
D)a technological advancement.
E)a fall in capital's share of national income.
Unlock Deck
Unlock for access to all 85 flashcards in this deck.
Unlock Deck
k this deck
76
The table given below shows the absolute tax amounts under five different tax policies for respective income levels.Table 19.2
The poverty threshold is often determined in terms of the expenditure on meals that meet a predetermined nutritional standard.
The poverty threshold is often determined in terms of the expenditure on meals that meet a predetermined nutritional standard.
Unlock Deck
Unlock for access to all 85 flashcards in this deck.
Unlock Deck
k this deck
77
The table given below shows the absolute tax amounts under five different tax policies for respective income levels.Table 19.2
If everyone in an economy had equal income, the Lorenz curve would be a curve that intersects the line of income equality at the point at which 50 percent of the population earns 50 percent of the income.
If everyone in an economy had equal income, the Lorenz curve would be a curve that intersects the line of income equality at the point at which 50 percent of the population earns 50 percent of the income.
Unlock Deck
Unlock for access to all 85 flashcards in this deck.
Unlock Deck
k this deck
78
The table given below shows the absolute tax amounts under five different tax policies for respective income levels.Table 19.2
Economic stagnation and recession result in unemployment and poverty.
Economic stagnation and recession result in unemployment and poverty.
Unlock Deck
Unlock for access to all 85 flashcards in this deck.
Unlock Deck
k this deck
79
The table given below shows the absolute tax amounts under five different tax policies for respective income levels.Table 19.2
A proportional tax tends to:
A)reduce income inequality.
B)increase overall income inequality.
C)leave the income distribution essentially unchanged.
D)increase income inequality among the rich.
E)generate additional tax revenues for the government.
A proportional tax tends to:
A)reduce income inequality.
B)increase overall income inequality.
C)leave the income distribution essentially unchanged.
D)increase income inequality among the rich.
E)generate additional tax revenues for the government.
Unlock Deck
Unlock for access to all 85 flashcards in this deck.
Unlock Deck
k this deck
80
The table given below shows the absolute tax amounts under five different tax policies for respective income levels.Table 19.2
Those who argue that welfare programs are a drag on the economy are of the view that welfare programs funded by taxes:
A)reduce the opportunity cost of labor.
B)raise the incidence of poverty and income inequality.
C)raise the incentive to work.
D)reduce the tax-liability of the tax-payers.
E)reduce the demand for labor.
Unlock Deck
Unlock for access to all 85 flashcards in this deck.
Unlock Deck
k this deck
Unlock Deck
Unlock for access to all 85 flashcards in this deck.


