Deck 6: Rom Demand to Welfare
Full screen (f)
Question
Question
Question
Question
Question
Question
Question
Question
Question
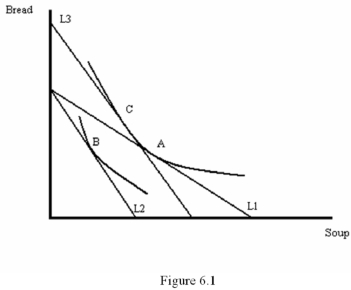
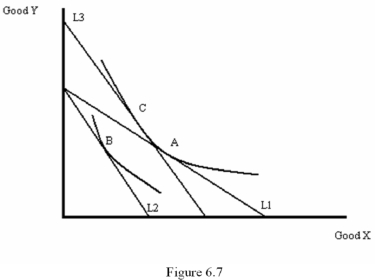
Refer to Figure 6.1.Point C represents the
A) Uncompensated effect on an increase in the price of soup
B) Compensated effect on a decrease in the price of soup
C) Uncompensated effect on a decrease in the price of soup
D) Compensated effect on an increase in the price of soup
Question
Question
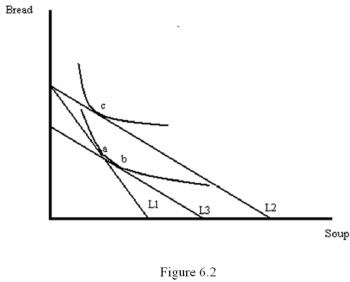
Figure 6.2 illustrates a change in the price of soup.From the graph,we can conclude that
A) The price of soup has increased and soup is a Giffen good
B) The price of soup has fallen and soup is a Giffen good
C) The price of soup has fallen and soup is a normal good
D) The price of soup has fallen and bread is a Giffen good
Question
Refer to Figure 6.1.Point B represents the
A) Uncompensated effect of an increase in the price of bread
B) Uncompensated effect of a decrease in the price of soup
C) Uncompensated effect of an increase in the price of soup
D) Compensated effect of an increase in the price of soup
Question
Refer to Figure 6.1.Which change in budget lines represents compensation?
A) L1 to L2
B) L2 to L3
C) L3 to L2
D) L1 to L3
Question
Refer to Figure 6.1.The substitution effect is shown by the movement
A) From bundle A to bundle C
B) From bundle A to bundle B
C) From bundle B to bundle C
D) From bundle C to bundle B
Question
Question
Question
Question
Question
According to Figure 6.1,
A) Soup is a normal good
B) Soup is an inferior good
C) Soup is a Giffen good
D) Bread is an inferior good
Question
Refer to Figure 6.1.The income effect is shown by the movement
A) From bundle A to bundle C
B) From bundle A to bundle B
C) From bundle B to bundle C
D) From bundle C to bundle B
Question
Question
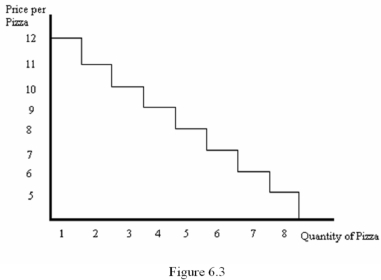
Refer to Figure 6.4.If the price is $1,500,then consumer surplus is equal to
A) $175,000
B) $535,000
C) $1,000
D) $262,500
Question
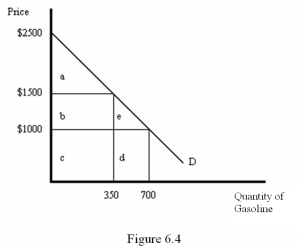
Refer to Figure 6.3.Suppose the price of pizza is $9.75.Then consumer surplus is ______.
A) $3.75
B) $3.50
C) $29.25
D) $33.00
Question
Question
Refer to Figure 6.3.Suppose the price of pizza is $8.50.Then the consumer will purchase _____ pizzas and the net benefit is ______.
A) 5; $9.50
B) 4; $8.00
C) 5; $3.50
D) 4; $9.50
Question
Question
Question
Question
Question
Question
Question
Question
Question
Question
Refer to Figure 6.4.If the price is $1,000,then expenditures are represented by the area
A) c + d
B) c
C) b + c
D) a + b + c
Question
Question
Refer to Figure 6.4.If the price is $1,000,then consumer surplus is given by the area represented by
A) c + d
B) b
C) b + c
D) a + b + e
Question
Refer to Figure 6.4.What area represents the change in consumer surplus when the price increases from $1,000 to $1,500?
A) b
B) b + e
C) b + c
D) a + b
Question
Question
Question
Question
Question
Question
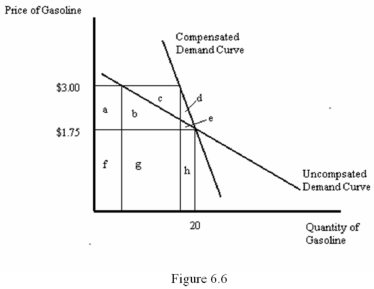
Refer to Figure 6.6.What area represents the compensation for reduced consumption that results from an increase in the price of gasoline from $1.75 to $3.00 per gallon?
A) a + b
B) a + b + e
C) c + d + e
D) d + e
Question
Question
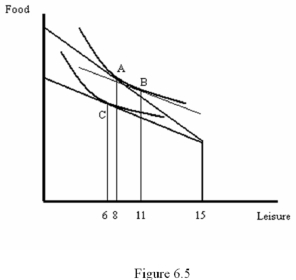
Refer to Figure 6.5.The substitution effect is shown by the movement
A) From point A to point B
B) From point A to point C
C) From point B to point C
D) From point B to point A
Question
Question
Refer to Figure 6.6.What area represents the compensation for an increase in the price of gasoline from $1.75 to $3.00 per gallon?
A) a + b + c + d + e
B) f + g + h
C) a + b + c
D) d + e
Question
Question
Question
Using a graph,explain both the substitution effect and income effect that result from an increase in the price of a normal good.
B.
C. The income effect is then shown by the movement from point C to point
B.
C. The income effect is then shown by the movement from point C to point
Question
Question
Question
Question
Question
Question
Question
Refer to Figure 6.5.By how many hours does leisure change as a result of the income effect?
A) 2
B) 3
C) 4
D) 5
Question
Question
Question
Question
Question
Question
Question
Question

Unlock Deck
Sign up to unlock the cards in this deck!
Unlock Deck
Unlock Deck
1/66
Play
Full screen (f)
Deck 6: Rom Demand to Welfare
1
A change in price that is accompanied by a change in income to leave the consumer's well-being unaffected is called:
A) An uncompensated price change
B) A compensated price change
C) An income adjusted price change
D) The income effect
A) An uncompensated price change
B) A compensated price change
C) An income adjusted price change
D) The income effect
A compensated price change
2
When the price of a good decreases,
A) The good becomes less expensive relative to other goods and the consumer's purchasing power increases
B) The good becomes less expensive relative to other goods and the consumer's purchasing power decreases
C) The good becomes more expensive relative to other goods and the consumer's purchasing power increases
D) The good becomes more expensive relative to other goods and the consumer's purchasing power decreases
The good becomes less expensive relative to other goods and the consumer's purchasing power increases
3
Which of the following does NOT describe a compensating variation?
A) The amount of money that exactly compensates a consumer for a change in economic circumstances
B) The amount of money that produces an equivalent effect on a consumer's well-being
C) The most some one (someone) is willing to pay to experience something beneficial
D) The least someone is willing to pay to experience something harmful
The amount of money that produces an equivalent effect on a consumer's well-being
4
Which of the following is correct?
A) The effect of a compensated price change equals the effect of an uncompensated price change plus the effect of providing compensation
B) The effect of a compensated price change equals the effect of an uncompensated price change plus the effect of removing compensation
C) The effect of an uncompensated price change equals the effect of an uncompensated price change plus the effect of providing compensation
D) The effect of a compensated price change equals the substitution effect of the price change plus the income effect of the price change
Unlock Deck
Unlock for access to all 66 flashcards in this deck.
Unlock Deck
k this deck
5
What must occur for a good to violate the Law of Demand?
A) The good must be normal and the income effect must be larger than the substitution effect
B) The good must be normal and the substitution effect must be larger than the income effect
C) The good must be inferior and the income effect must be larger than the substitution effect
D) The good must be inferior and the substitution effect must be larger than the income effect
Unlock Deck
Unlock for access to all 66 flashcards in this deck.
Unlock Deck
k this deck
6
Which of the following does NOT occur when the price of a good increases?
A) The good becomes more expensive relative to all other goods
B) The consumer's purchasing power increases
C) Consumers shift their purchases away from the more expensive good
D) The consumer is effectively poorer than before the increase in price
A) The good becomes more expensive relative to all other goods
B) The consumer's purchasing power increases
C) Consumers shift their purchases away from the more expensive good
D) The consumer is effectively poorer than before the increase in price
Unlock Deck
Unlock for access to all 66 flashcards in this deck.
Unlock Deck
k this deck
7
What effect does a compensated price change have on a consumer's well-being?
A) The consumer's well-being increases
B) The consumer's well-being decreases
C) The consumer's well-being is unaffected
D) The effect of the consumer's well-being can not be determined
A) The consumer's well-being increases
B) The consumer's well-being decreases
C) The consumer's well-being is unaffected
D) The effect of the consumer's well-being can not be determined
Unlock Deck
Unlock for access to all 66 flashcards in this deck.
Unlock Deck
k this deck
8
A compensated increase in the price of a good
A) Causes the consumer to buy more of the good if the income effect is larger than the substitution effect
B) Causes the consumer to buy more of the good if the income effect is smaller than the substitution effect
C) Always causes the consumer to buy more of that good
D) Always causes the consumer to buy less of that good
Unlock Deck
Unlock for access to all 66 flashcards in this deck.
Unlock Deck
k this deck
9
Refer to Figure 6.1.Point C represents the
A) Uncompensated effect on an increase in the price of soup
B) Compensated effect on a decrease in the price of soup
C) Uncompensated effect on a decrease in the price of soup
D) Compensated effect on an increase in the price of soup
Unlock Deck
Unlock for access to all 66 flashcards in this deck.
Unlock Deck
k this deck
10
If a good is normal,then the income effect is _____ for a price increase and _____ for a price decrease.
A) Positive; negative
B) Positive; positive
C) Negative; negative
D) Negative; positive
A) Positive; negative
B) Positive; positive
C) Negative; negative
D) Negative; positive
Unlock Deck
Unlock for access to all 66 flashcards in this deck.
Unlock Deck
k this deck
11
Figure 6.2 illustrates a change in the price of soup.From the graph,we can conclude that
A) The price of soup has increased and soup is a Giffen good
B) The price of soup has fallen and soup is a Giffen good
C) The price of soup has fallen and soup is a normal good
D) The price of soup has fallen and bread is a Giffen good
Unlock Deck
Unlock for access to all 66 flashcards in this deck.
Unlock Deck
k this deck
12
Refer to Figure 6.1.Point B represents the
A) Uncompensated effect of an increase in the price of bread
B) Uncompensated effect of a decrease in the price of soup
C) Uncompensated effect of an increase in the price of soup
D) Compensated effect of an increase in the price of soup
Unlock Deck
Unlock for access to all 66 flashcards in this deck.
Unlock Deck
k this deck
13
Refer to Figure 6.1.Which change in budget lines represents compensation?
A) L1 to L2
B) L2 to L3
C) L3 to L2
D) L1 to L3
Unlock Deck
Unlock for access to all 66 flashcards in this deck.
Unlock Deck
k this deck
14
Refer to Figure 6.1.The substitution effect is shown by the movement
A) From bundle A to bundle C
B) From bundle A to bundle B
C) From bundle B to bundle C
D) From bundle C to bundle B
Unlock Deck
Unlock for access to all 66 flashcards in this deck.
Unlock Deck
k this deck
15
Which of the following statements about the income effect of a price change is NOT true?
A) It affects consumption by removing compensation
B) It always involves a parallel shift in the budget line
C) It isolates the influence of a change in relative prices
D) It reflects the fact that a price change affects a consumer's purchasing power
A) It affects consumption by removing compensation
B) It always involves a parallel shift in the budget line
C) It isolates the influence of a change in relative prices
D) It reflects the fact that a price change affects a consumer's purchasing power
Unlock Deck
Unlock for access to all 66 flashcards in this deck.
Unlock Deck
k this deck
16
The effect of a compensated price change is known as:
A) The price effect of a price change
B) The income effect of a price change
C) The substitution effect of a price change
D) The replacement effect of a price change
A) The price effect of a price change
B) The income effect of a price change
C) The substitution effect of a price change
D) The replacement effect of a price change
Unlock Deck
Unlock for access to all 66 flashcards in this deck.
Unlock Deck
k this deck
17
For what type of good do the substitution and income effects work in opposite directions?
A) Normal goods
B) Inferior goods
C) Giffen goods
D) The substitution and income effects never work in opposite directions
A) Normal goods
B) Inferior goods
C) Giffen goods
D) The substitution and income effects never work in opposite directions
Unlock Deck
Unlock for access to all 66 flashcards in this deck.
Unlock Deck
k this deck
18
If a good is _______,the income effect is negative for a price increase and positive for a price decrease.
A) Inferior
B) Superior
C) Normal
D) Giffen
A) Inferior
B) Superior
C) Normal
D) Giffen
Unlock Deck
Unlock for access to all 66 flashcards in this deck.
Unlock Deck
k this deck
19
According to Figure 6.1,
A) Soup is a normal good
B) Soup is an inferior good
C) Soup is a Giffen good
D) Bread is an inferior good
Unlock Deck
Unlock for access to all 66 flashcards in this deck.
Unlock Deck
k this deck
20
Refer to Figure 6.1.The income effect is shown by the movement
A) From bundle A to bundle C
B) From bundle A to bundle B
C) From bundle B to bundle C
D) From bundle C to bundle B
Unlock Deck
Unlock for access to all 66 flashcards in this deck.
Unlock Deck
k this deck
21
The substitution bias refers to
A) The failure of the Laspeyres index to capture a consumer's tendency to purchase the same bundle of goods as prices change
B) The substitution effect is positive for a price increase
C) The substitution effect is negative for an inferior good
D) The failure of the Laspeyres index to capture a consumer's tendency to substitute away from goods that have become more expensive
Unlock Deck
Unlock for access to all 66 flashcards in this deck.
Unlock Deck
k this deck
22
Refer to Figure 6.4.If the price is $1,500,then consumer surplus is equal to
A) $175,000
B) $535,000
C) $1,000
D) $262,500
Unlock Deck
Unlock for access to all 66 flashcards in this deck.
Unlock Deck
k this deck
23
Refer to Figure 6.3.Suppose the price of pizza is $9.75.Then consumer surplus is ______.
A) $3.75
B) $3.50
C) $29.25
D) $33.00
Unlock Deck
Unlock for access to all 66 flashcards in this deck.
Unlock Deck
k this deck
24
The amount of money actually received in a particular period is called
A) Nominal income
B) Real income
C) A cost-of-living index
D) Consumer surplus
A) Nominal income
B) Real income
C) A cost-of-living index
D) Consumer surplus
Unlock Deck
Unlock for access to all 66 flashcards in this deck.
Unlock Deck
k this deck
25
Refer to Figure 6.3.Suppose the price of pizza is $8.50.Then the consumer will purchase _____ pizzas and the net benefit is ______.
A) 5; $9.50
B) 4; $8.00
C) 5; $3.50
D) 4; $9.50
Unlock Deck
Unlock for access to all 66 flashcards in this deck.
Unlock Deck
k this deck
26
Constructing an accurate cost-of-living index is difficult because
A) Consumers have different tastes
B) Prices of different goods change by different proportions
C) Prices of different goods change by the same proportions
D) Real and nominal income tend to move together
A) Consumers have different tastes
B) Prices of different goods change by different proportions
C) Prices of different goods change by the same proportions
D) Real and nominal income tend to move together
Unlock Deck
Unlock for access to all 66 flashcards in this deck.
Unlock Deck
k this deck
27
When prices are rising,
A) The Laspeyres index tends to overstate the increase in the cost of living because of the substitution bias
B) The Laspeyres index tends to understate the increase in the cost of living because of the substitution bias
C) The Laspeyres index tends to overstate the increase in the cost of living because of the compensating variation bias
D) The Laspeyres index tends to understate the increase in the cost of living because of the consumer preference bias
Unlock Deck
Unlock for access to all 66 flashcards in this deck.
Unlock Deck
k this deck
28
Suppose Eddie's demand curve for text messages is T = 150-500Pt,where T stands for the number of text messages and Pt represents the price of text messages.What is Eddie's consumer surplus if Pt = $.10 per message?
A) $5
B) $10
C) $20
D) $50
A) $5
B) $10
C) $20
D) $50
Unlock Deck
Unlock for access to all 66 flashcards in this deck.
Unlock Deck
k this deck
29
Suppose a consumer's nominal income is $50,000 and the cost-of-living index is 1.3.The consumer's real income is
A) $50,000
B) $65,000
C) $53,000
D) $38, 462
A) $50,000
B) $65,000
C) $53,000
D) $38, 462
Unlock Deck
Unlock for access to all 66 flashcards in this deck.
Unlock Deck
k this deck
30
______ is a fixed-weight index that is based on a consumption bundle actually purchased in the base year.
A) A Laspeyres price index
B) Compensating variation
C) Real income
D) The inflation rate
A) A Laspeyres price index
B) Compensating variation
C) Real income
D) The inflation rate
Unlock Deck
Unlock for access to all 66 flashcards in this deck.
Unlock Deck
k this deck
31
The amount of money received in a particular period adjusted for changes in purchasing power is called
A) Nominal income
B) Real income
C) A cost-of-living index
D) Consumer surplus
A) Nominal income
B) Real income
C) A cost-of-living index
D) Consumer surplus
Unlock Deck
Unlock for access to all 66 flashcards in this deck.
Unlock Deck
k this deck
32
The amount of compensation associated with the income effect of a price change is called
A) A compensating variation
B) An income effect
C) Consumer surplus
D) A subsidy
A) A compensating variation
B) An income effect
C) Consumer surplus
D) A subsidy
Unlock Deck
Unlock for access to all 66 flashcards in this deck.
Unlock Deck
k this deck
33
The relative cost of achieving a fixed standard of living in different situations is called
A) A cost of living index
B) Compensating variation
C) Real income
D) Consumer surplus
A) A cost of living index
B) Compensating variation
C) Real income
D) Consumer surplus
Unlock Deck
Unlock for access to all 66 flashcards in this deck.
Unlock Deck
k this deck
34
Consumer surplus is
A) The amount of purchasing power a consumer receives when the price of a good falls
B) The amount of money that exactly compensates a consumer for a change in circumstances
C) The net benefit a consumer receives from participating in the market for some good
D) Negative whenever the price of a good increases
Unlock Deck
Unlock for access to all 66 flashcards in this deck.
Unlock Deck
k this deck
35
Refer to Figure 6.4.If the price is $1,000,then expenditures are represented by the area
A) c + d
B) c
C) b + c
D) a + b + c
Unlock Deck
Unlock for access to all 66 flashcards in this deck.
Unlock Deck
k this deck
36
The change in the cost of living over time is referred to as
A) Inflation
B) Substitution bias
C) A fixed-weight price index
D) Real income
A) Inflation
B) Substitution bias
C) A fixed-weight price index
D) Real income
Unlock Deck
Unlock for access to all 66 flashcards in this deck.
Unlock Deck
k this deck
37
Refer to Figure 6.4.If the price is $1,000,then consumer surplus is given by the area represented by
A) c + d
B) b
C) b + c
D) a + b + e
Unlock Deck
Unlock for access to all 66 flashcards in this deck.
Unlock Deck
k this deck
38
Refer to Figure 6.4.What area represents the change in consumer surplus when the price increases from $1,000 to $1,500?
A) b
B) b + e
C) b + c
D) a + b
Unlock Deck
Unlock for access to all 66 flashcards in this deck.
Unlock Deck
k this deck
39
______ measures the percent change in the cost of a fixed consumption bundle.
A) A fixed-weight price index
B) Substitution bias
C) Compensating variation
D) Real income
A) A fixed-weight price index
B) Substitution bias
C) Compensating variation
D) Real income
Unlock Deck
Unlock for access to all 66 flashcards in this deck.
Unlock Deck
k this deck
40
Suppose the base year for a Laspeyres index is 2001.The value of the index is 1.3 in 2004 and 1.6 in 2006.By how much did the cost of the bundle increase between 2004 and 2006?
A).3%
B) 23%
C).23%
D) 60%
A).3%
B) 23%
C).23%
D) 60%
Unlock Deck
Unlock for access to all 66 flashcards in this deck.
Unlock Deck
k this deck
41
For low wages,the leisure demand curve slopes ______; for higher wages it slopes ______.
A) Upward; downward
B) Downward; upward
C) Downward; downward
D) Upward; upward
A) Upward; downward
B) Downward; upward
C) Downward; downward
D) Upward; upward
Unlock Deck
Unlock for access to all 66 flashcards in this deck.
Unlock Deck
k this deck
42
When income effects are small,
A) There is no difference between the uncompensated demand curve and the uncompensated demand curve
B) The uncompensated demand curve will be relatively far from the compensated demand curve
C) The compensated demand curve will intersect the uncompensated demand curve
D) The uncompensated demand curve lies close to the compensated demand curve
Unlock Deck
Unlock for access to all 66 flashcards in this deck.
Unlock Deck
k this deck
43
A demand curve that shows the relationship between the price of a good and the amount of the good consumed holding the consumer's well-being fixed and allowing their to income (to)vary is called
A) An uncompensated demand curve
B) A compensated demand curve
C) A Marshallian demand curve
D) A derived demand curve
A) An uncompensated demand curve
B) A compensated demand curve
C) A Marshallian demand curve
D) A derived demand curve
Unlock Deck
Unlock for access to all 66 flashcards in this deck.
Unlock Deck
k this deck
44
Refer to Figure 6.6.What area represents the compensation for reduced consumption that results from an increase in the price of gasoline from $1.75 to $3.00 per gallon?
A) a + b
B) a + b + e
C) c + d + e
D) d + e
Unlock Deck
Unlock for access to all 66 flashcards in this deck.
Unlock Deck
k this deck
45
The demand curve for leisure will slope upward if leisure is a ______ good and the income effect of a wage change is relatively _______.
A) Normal; large
B) Inferior; large
C) Normal; small
D) Inferior; small
A) Normal; large
B) Inferior; large
C) Normal; small
D) Inferior; small
Unlock Deck
Unlock for access to all 66 flashcards in this deck.
Unlock Deck
k this deck
46
Refer to Figure 6.5.The substitution effect is shown by the movement
A) From point A to point B
B) From point A to point C
C) From point B to point C
D) From point B to point A
Unlock Deck
Unlock for access to all 66 flashcards in this deck.
Unlock Deck
k this deck
47
A demand curve that shows the relationship between the price of a good and the amount of the good consumed holding the consumer's income fixed and allowing their well-being to vary is called
A) An uncompensated demand curve
B) A compensated demand curve
C) A Hicksian demand curve
D) A derived demand curve
A) An uncompensated demand curve
B) A compensated demand curve
C) A Hicksian demand curve
D) A derived demand curve
Unlock Deck
Unlock for access to all 66 flashcards in this deck.
Unlock Deck
k this deck
48
Refer to Figure 6.6.What area represents the compensation for an increase in the price of gasoline from $1.75 to $3.00 per gallon?
A) a + b + c + d + e
B) f + g + h
C) a + b + c
D) d + e
Unlock Deck
Unlock for access to all 66 flashcards in this deck.
Unlock Deck
k this deck
49
Suppose that an individual has chosen not to work.Then a change in the wage rate
A) Creates a substitution effect, but no income effect
B) Creates an income effect, but no substitution effect
C) Creates both and income and substitution effect
D) Creates neither an income effect nor a substitution effect
A) Creates a substitution effect, but no income effect
B) Creates an income effect, but no substitution effect
C) Creates both and income and substitution effect
D) Creates neither an income effect nor a substitution effect
Unlock Deck
Unlock for access to all 66 flashcards in this deck.
Unlock Deck
k this deck
50
What is the difference between approximate and exact consumer surplus?
A) Approximate consumer surplus is calculated using an uncompensated demand curve, while exact consumer surplus is calculated using a compensated demand curve
B) Approximate consumer surplus is calculated using a compensated demand curve, while exact consumer surplus is calculated using an uncompensated demand curve
C) There is no difference between approximate and exact consumer surplus
D) Approximate consumer surplus can be measured, while exact consumer surplus can not be measured
Unlock Deck
Unlock for access to all 66 flashcards in this deck.
Unlock Deck
k this deck
51
Using a graph,explain both the substitution effect and income effect that result from an increase in the price of a normal good.
B.
C. The income effect is then shown by the movement from point C to point
B.
C. The income effect is then shown by the movement from point C to point
Unlock Deck
Unlock for access to all 66 flashcards in this deck.
Unlock Deck
k this deck
52
Because individuals initially own more time than they consume and sell the difference to their employers,
A) The direction of the income effect is the opposite than it is for other goods
B) The direction of the income effect is the same as it is for other goods
C) There is no income effect resulting from a change in the individual's wage rate
D) The income effect of a wage change is relatively small
A) The direction of the income effect is the opposite than it is for other goods
B) The direction of the income effect is the same as it is for other goods
C) There is no income effect resulting from a change in the individual's wage rate
D) The income effect of a wage change is relatively small
Unlock Deck
Unlock for access to all 66 flashcards in this deck.
Unlock Deck
k this deck
53
Which of the following best describes labour force participation rates for men and women over the period 1960 to 2000?
A) Labour force participation rates for both men and women increased
B) Labour force participation rates for both men and women decreased
C) Labour force participation rates for men increased while labour force participation rates for women decreased
D) Labour force participation rates for men declined while labour force participation rates for women increased
Unlock Deck
Unlock for access to all 66 flashcards in this deck.
Unlock Deck
k this deck
54
If a good is inferior,then whenever the compensated demand curve intersects the uncompensated demand curve,
A) The uncompensated demand curve is steeper than the compensated demand curve
B) The compensated demand curve is steeper than the uncompensated demand curve
C) Both curves will have the same slope
D) The compensated demand curve will be upward-sloping
A) The uncompensated demand curve is steeper than the compensated demand curve
B) The compensated demand curve is steeper than the uncompensated demand curve
C) Both curves will have the same slope
D) The compensated demand curve will be upward-sloping
Unlock Deck
Unlock for access to all 66 flashcards in this deck.
Unlock Deck
k this deck
55
For a normal good,the income and substitution effects work in the ______ direction.Therefore,a change in price produces a ______ change in uncompensated demand than in compensated demand.
A) Opposite; smaller
B) Opposite; larger
C) Same; smaller
D) Same; larger
A) Opposite; smaller
B) Opposite; larger
C) Same; smaller
D) Same; larger
Unlock Deck
Unlock for access to all 66 flashcards in this deck.
Unlock Deck
k this deck
56
For low wages,the labour supply curve slopes ______; for higher wages it slopes ______.
A) Upward; downward
B) Downward; upward
C) Downward; downward
D) Upward; upward
A) Upward; downward
B) Downward; upward
C) Downward; downward
D) Upward; upward
Unlock Deck
Unlock for access to all 66 flashcards in this deck.
Unlock Deck
k this deck
57
A consumer's ______ determines the location of their uncompensated demand curve,while the level of their ______ determines the location of their compensated demand curve.
A) Income; well-being
B) Well-being; income
C) Indifference curves; income
D) Preferences; well-being
A) Income; well-being
B) Well-being; income
C) Indifference curves; income
D) Preferences; well-being
Unlock Deck
Unlock for access to all 66 flashcards in this deck.
Unlock Deck
k this deck
58
Refer to Figure 6.5.By how many hours does leisure change as a result of the income effect?
A) 2
B) 3
C) 4
D) 5
Unlock Deck
Unlock for access to all 66 flashcards in this deck.
Unlock Deck
k this deck
59
Which of the following statements is true,assuming leisure is a normal good?
A) If the income effect is sufficiently large, the labour supply curve will bend backwards
B) If the income effect is sufficiently small, the labour supply curve will bend backwards
C) If the income effect is sufficiently large, the labour supply curve will slope down
D) If the income effect is sufficiently large, the labour supply curve will shift to the left
Unlock Deck
Unlock for access to all 66 flashcards in this deck.
Unlock Deck
k this deck
60
If a person attaches more importance to leisure than they do to labour,then their indifference curves
A) Will lie closer to the labour axis
B) Will lie closer to the leisure axis
C) Will be positively-sloped
D) Will be L-shaped
A) Will lie closer to the labour axis
B) Will lie closer to the leisure axis
C) Will be positively-sloped
D) Will be L-shaped
Unlock Deck
Unlock for access to all 66 flashcards in this deck.
Unlock Deck
k this deck
61
Suppose an individual consumes just pizza and soda.Using a graph,explain how the substitution bias causes the Laspeyres price index to overstate the true change in the cost of living resulting from an increase in the price of pizza.
Unlock Deck
Unlock for access to all 66 flashcards in this deck.
Unlock Deck
k this deck
62
Define consumer surplus.Using a graph,explain the change in consumer surplus that would result from a decrease in the price of a gasoline.
Unlock Deck
Unlock for access to all 66 flashcards in this deck.
Unlock Deck
k this deck
63
Madison has an income of $50,which she spends on Pizza (P)and soft drinks (S).Her marginal rate of substitution is MRSPS = S/P.The price of pizza (PP)is $5 and the price of soft drinks (PS)is $2.50.Finally,the formula for her indifference curves is given by S = 2U/P.
a)Find Madison's uncompensated demand curve for pizza.
b)Find Madison's compensated demand curve for pizza.
a)Find Madison's uncompensated demand curve for pizza.
b)Find Madison's compensated demand curve for pizza.
Unlock Deck
Unlock for access to all 66 flashcards in this deck.
Unlock Deck
k this deck
64
Suppose that high-definition television sets (HDTVs)are normal goods.Would the compensated demand curve for HDTVs be flatter or steeper than the uncompensated demand curve? Explain your answer using a carefully-labeled graph.
Unlock Deck
Unlock for access to all 66 flashcards in this deck.
Unlock Deck
k this deck
65
Assume an individual has 14 hours per day for either work or leisure.Using an indifference curve graph,derive an individual's labour supply curve.In your answer,explain what might cause the individual's labour supply curve to eventually bend backwards.
Unlock Deck
Unlock for access to all 66 flashcards in this deck.
Unlock Deck
k this deck
66
Suppose that Amber's demand for gasoline is given by G = 1000 - 200PG,where G stands for gallons of gas and PG represents the price of gas.
a)Suppose gas sells for $2 per gallon.What is Amber's consumer surplus? Illustrate your answer graphically.
b)Suppose the price of gas rises to $3 per gallon.What is the change in Amber's consumer surplus? Illustrate this change in your graph.
a)Suppose gas sells for $2 per gallon.What is Amber's consumer surplus? Illustrate your answer graphically.
b)Suppose the price of gas rises to $3 per gallon.What is the change in Amber's consumer surplus? Illustrate this change in your graph.
Unlock Deck
Unlock for access to all 66 flashcards in this deck.
Unlock Deck
k this deck
Unlock Deck
Unlock for access to all 66 flashcards in this deck.


