Deck 5: Constraints, Choices, and Demand
Full screen (f)
Question
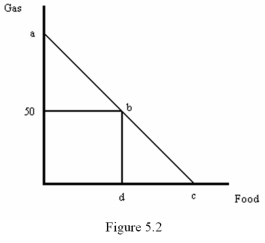
Refer to Figure 5.2.Suppose the price of gas is $3,the price of food is $5 and the consumer's income is $300.If the government rations gas to 50 gallons,how much food will the consumer buy?
A) 30
B) 50
C) 60
D) 15
Question
Question
Question
Question
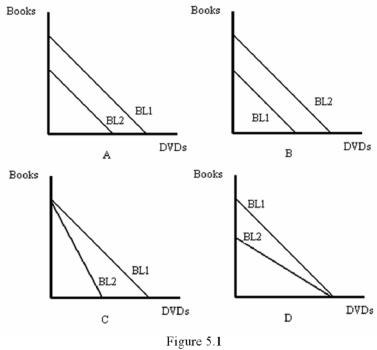
Refer to Figure 5.1.Which graph represents an increase in the consumer's income?
A) A
B) B
C) C
D) D
Question
Refer to Figure 5.1.Which graph most likely represents a doubling of the prices of both Books and DVDs?
A) A
B) B
C) C
D) D
Question
Question
Question
Question
Question
Question
Refer to Figure 5.2.If the government rations gas to 50 gallons,the consumer's budget line would be given by the line
A) Abc
B) Abd
C) 50bd
D) 50bc
Question
Question
Question
Question
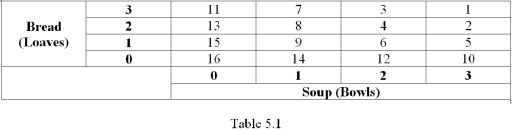
Refer to Table 5.1,which shows Madeline's preference ranking for various consumption bundles of bread and soup.If the price of soup is $3 per bowl,the price of bread is $3 per loaf and Madeline's income is $9 per day,which combination of bread and soup will she choose?
A) 2 loaves of bread and 1 bowl of soup
B) 1 loaf of bread and 2 bowls of soup
C) 3 loaves of bread and 0 bowls of soup
D) 0 loaves of bread and 3 bowls of soup
Question
Question
Question
Question
Refer to Figure 5.1.Which graph represents an increase in the price of DVDs?
A) A
B) B
C) C
D) D
Question
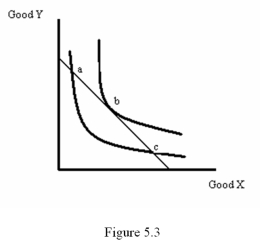
Refer to Figure 5.3.Which of the following statements is false?
A) Points a, b and c all represent best choices for the consumer
B) Point a violates the No Overlap Rule
C) Point b satisfies the tangency requirement
D) Point c violates the No Overlap Rule
Question
Question
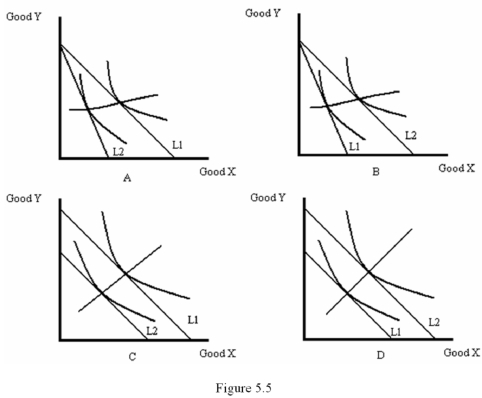
Refer to Figure 5.5.Which diagram shows the income-consumption curve resulting from a decrease in income?
A) A
B) B
C) C
D) D
Question
Refer to Figure 5.5.Which diagram shows the price-consumption curve resulting from a decrease in the price of good X?
A) A
B) B
C) C
D) D
Question
Question
Question
Question
Question
Question
Question
Question
Question
Question
Question
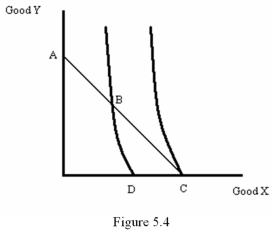
Refer to Figure 5.4.Which consumption bundle would maximize the consumer's utility?
A) A
B) B
C) C
D) D
Question
Question
Question
Question
Question
Question
Question
Question
Question
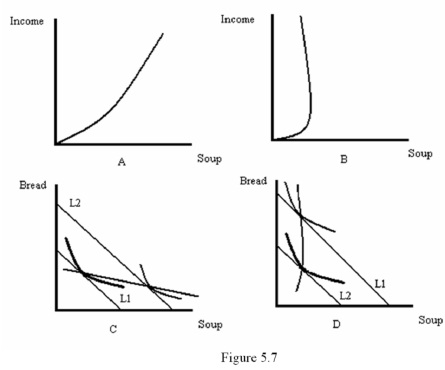
Refer to Figure 5.7.Which diagram best represents an Engle curve where soup is a normal good?
A) A
B) B
C) C
D) D
Question
Question
When the price elasticity of demand is large in magnitude,a _____ increase in the price leads to a _____ reduction in the amount purchased and the demand curve is relatively ______.
A) Slight; substantial; steep
B) Slight; slight; flat
C) Large; slight; steep
D) Slight; substantial; flat
Question
When the price elasticity of demand is small in magnitude,a _____ increase in the price leads to a _____ reduction in the amount purchased and the demand curve is relatively ______.
A) Slight; substantial; steep
B) Slight; slight; flat
C) Large; slight; steep
D) Slight; substantial; flat
Question
Question
Question
Question
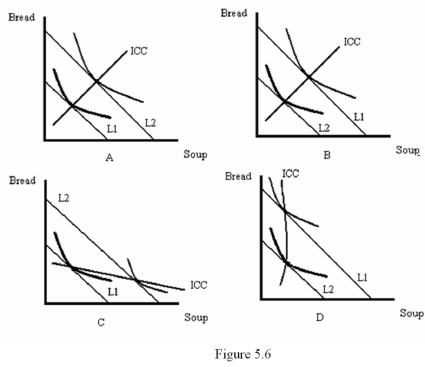
Refer to Figure 5.6.Which diagram shows an increase in income with both bread and soup being normal goods?
A) A
B) B
C) C
D) D
Question
Question
Question
Refer to Figure 5.6.Which diagram shows an increase in income with bread being inferior and soup being normal?
A) A
B) B
C) C
D) D
Question
Question
Question
Question
Question
Refer to Figure 5.7.Which diagram best represents an income-consumption curve where soup is a normal good?
A) A
B) B
C) C
D) D
Question
Refer to Figure 5.6.Which diagram shows a decrease in income with bread being normal and soup being inferior?
A) A
B) B
C) C
D) D
Question
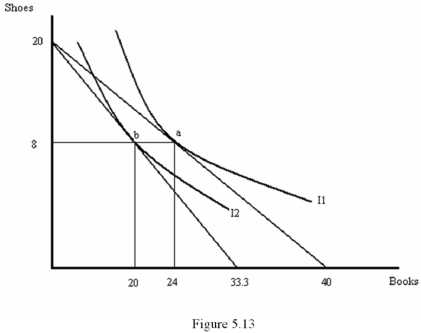
Nicole's income is $1,000 per month.She spends all of it on shoes (S)and books (B).Shoes cost $50 and books cost $25.Her marginal rate of substitution for shoes with books is MRSSB = 2B/3S.Illustrate her utility-maximizing combination of shoes and books and draw her price-consumption curve if the price of books rises to $30.
B. M = PS (2/3)(PB/PS)B + PBB, which implies B = (3/5) (M/PB ) =
B. When PB = $30, B = 20. The new utility-maximizing combination of books and shoes is represented by point b in Figure 5.13. Connecting points a and b gives the price-consumption curve.
B. M = PS (2/3)(PB/PS)B + PBB, which implies B = (3/5) (M/PB ) =
B. When PB = $30, B = 20. The new utility-maximizing combination of books and shoes is represented by point b in Figure 5.13. Connecting points a and b gives the price-consumption curve.
Question
Question
Question
Question
Question
Question
Question

Unlock Deck
Sign up to unlock the cards in this deck!
Unlock Deck
Unlock Deck
1/68
Play
Full screen (f)
Deck 5: Constraints, Choices, and Demand
1
Refer to Figure 5.2.Suppose the price of gas is $3,the price of food is $5 and the consumer's income is $300.If the government rations gas to 50 gallons,how much food will the consumer buy?
A) 30
B) 50
C) 60
D) 15
30
2
A consumer's budget constraint is determined by
A) The consumer's income
B) The consumer's income and preferences
C) The consumer's income and the prices of the goods they buy
D) The consumer's preferences and the prices of the goods they buy
A) The consumer's income
B) The consumer's income and preferences
C) The consumer's income and the prices of the goods they buy
D) The consumer's preferences and the prices of the goods they buy
The consumer's income and the prices of the goods they buy
3
Choices that do not exhaust the consumer's budget line to the ______ of the budget line.
A) Southwest
B) Northeast
C) Northwest
D) Southeast
A) Southwest
B) Northeast
C) Northwest
D) Southeast
Southwest
4
An increase in the price of the good measured along the vertical axis will cause the budget line to
A) Shift outward
B) Shift inward
C) Become steeper
D) Become flatter
A) Shift outward
B) Shift inward
C) Become steeper
D) Become flatter
Unlock Deck
Unlock for access to all 68 flashcards in this deck.
Unlock Deck
k this deck
5
Refer to Figure 5.1.Which graph represents an increase in the consumer's income?
A) A
B) B
C) C
D) D
Unlock Deck
Unlock for access to all 68 flashcards in this deck.
Unlock Deck
k this deck
6
Refer to Figure 5.1.Which graph most likely represents a doubling of the prices of both Books and DVDs?
A) A
B) B
C) C
D) D
Unlock Deck
Unlock for access to all 68 flashcards in this deck.
Unlock Deck
k this deck
7
An increase in a consumer's income will cause the budget line to
A) Shift outward
B) Shift inward
C) Become steeper
D) Become flatter
A) Shift outward
B) Shift inward
C) Become steeper
D) Become flatter
Unlock Deck
Unlock for access to all 68 flashcards in this deck.
Unlock Deck
k this deck
8
Terry buys 10 pounds of cheese and 12 boxes of crackers each month.A pound of cheese costs $5 and a box of crackers costs $3.If she is maximizing her utility,what is her monthly income?
A) $86
B) $90
C) $80
D) There is not enough information to determine her monthly income
A) $86
B) $90
C) $80
D) There is not enough information to determine her monthly income
Unlock Deck
Unlock for access to all 68 flashcards in this deck.
Unlock Deck
k this deck
9
Consumption bundles that lie above the boundary established by the budget line
A) Are affordable for the consumer
B) Are preferred by the consumer but are not affordable
C) Are not preferred by the consumer
D) Do not exhaust the consumer's income
A) Are affordable for the consumer
B) Are preferred by the consumer but are not affordable
C) Are not preferred by the consumer
D) Do not exhaust the consumer's income
Unlock Deck
Unlock for access to all 68 flashcards in this deck.
Unlock Deck
k this deck
10
Suppose a consumer buys pizza (P)and soft drinks (S).The price of pizza is $10,the price of soft drinks is $2 and the consumer's income is $100.If pizza is measured on the vertical axis and soft drinks are measured on the horizontal axis,then the consumer's budget constraint is given by
A) P = 10 - (1/5)S
B) S = 10 - (1/5)P
C) P = 100 - 5S
D) P = 10 - 5S
A) P = 10 - (1/5)S
B) S = 10 - (1/5)P
C) P = 100 - 5S
D) P = 10 - 5S
Unlock Deck
Unlock for access to all 68 flashcards in this deck.
Unlock Deck
k this deck
11
The price of bread is $1.50 per pound and the price of butter is $3 per pound.Steve has an income of $30,with which he buys 4 pounds of bread.How many pounds of butter does he buy,assuming he buys nothing else?
A) 8
B) 12
C) 4
D) There is not enough information to answer the question
A) 8
B) 12
C) 4
D) There is not enough information to answer the question
Unlock Deck
Unlock for access to all 68 flashcards in this deck.
Unlock Deck
k this deck
12
Refer to Figure 5.2.If the government rations gas to 50 gallons,the consumer's budget line would be given by the line
A) Abc
B) Abd
C) 50bd
D) 50bc
Unlock Deck
Unlock for access to all 68 flashcards in this deck.
Unlock Deck
k this deck
13
Suppose a consumer buy books and DVDs.The price of a book is $10,the price of a DVD is $20 and the consumer's income is $400.If books are measured on the vertical axis and DVDs are measured on the horizontal axis,then the budget line intersects the vertical axis at
A) 40
B) 20
C) 10
D) 400
A) 40
B) 20
C) 10
D) 400
Unlock Deck
Unlock for access to all 68 flashcards in this deck.
Unlock Deck
k this deck
14
If prices and income all change by the same proportion
A) The budget line shifts out
B) The budget line shifts in
C) The budget line rotates outward
D) The budget line doesn't change
A) The budget line shifts out
B) The budget line shifts in
C) The budget line rotates outward
D) The budget line doesn't change
Unlock Deck
Unlock for access to all 68 flashcards in this deck.
Unlock Deck
k this deck
15
Suppose a consumer purchases pizza and soft drinks.If pizza is measured on the vertical axis and soft drinks are measured on the horizontal axis,then the slope of the budget line is equal to
A) The price of pizza divided by the price of soft drinks
B) The price of soft drinks divided by the price of pizza
C) The price of pizza divided by the price of soft drinks times negative one
D) The price of soft drinks divided by the price of pizza times negative one
A) The price of pizza divided by the price of soft drinks
B) The price of soft drinks divided by the price of pizza
C) The price of pizza divided by the price of soft drinks times negative one
D) The price of soft drinks divided by the price of pizza times negative one
Unlock Deck
Unlock for access to all 68 flashcards in this deck.
Unlock Deck
k this deck
16
Refer to Table 5.1,which shows Madeline's preference ranking for various consumption bundles of bread and soup.If the price of soup is $3 per bowl,the price of bread is $3 per loaf and Madeline's income is $9 per day,which combination of bread and soup will she choose?
A) 2 loaves of bread and 1 bowl of soup
B) 1 loaf of bread and 2 bowls of soup
C) 3 loaves of bread and 0 bowls of soup
D) 0 loaves of bread and 3 bowls of soup
Unlock Deck
Unlock for access to all 68 flashcards in this deck.
Unlock Deck
k this deck
17
Suppose a consumer buy books and DVDs.The price of a book is $10,the price of a DVD is $20 and the consumer's income is $400.If books are measured on the vertical axis and DVDs are measured on the horizontal axis,then the slope of the budget line is
A) 2
B) -2
C) 1/2
D) -1/2
A) 2
B) -2
C) 1/2
D) -1/2
Unlock Deck
Unlock for access to all 68 flashcards in this deck.
Unlock Deck
k this deck
18
A consumer's budget constraint is
A) A positively sloped line
B) A negatively sloped line
C) Convex
D) A vertical line at the level of the consumer's income
A) A positively sloped line
B) A negatively sloped line
C) Convex
D) A vertical line at the level of the consumer's income
Unlock Deck
Unlock for access to all 68 flashcards in this deck.
Unlock Deck
k this deck
19
An increase in the price of the good measured on the vertical axis will cause the budget line to
A) Shift outward
B) Become steeper
C) Become flatter
D) Shift inward
A) Shift outward
B) Become steeper
C) Become flatter
D) Shift inward
Unlock Deck
Unlock for access to all 68 flashcards in this deck.
Unlock Deck
k this deck
20
Refer to Figure 5.1.Which graph represents an increase in the price of DVDs?
A) A
B) B
C) C
D) D
Unlock Deck
Unlock for access to all 68 flashcards in this deck.
Unlock Deck
k this deck
21
Refer to Figure 5.3.Which of the following statements is false?
A) Points a, b and c all represent best choices for the consumer
B) Point a violates the No Overlap Rule
C) Point b satisfies the tangency requirement
D) Point c violates the No Overlap Rule
Unlock Deck
Unlock for access to all 68 flashcards in this deck.
Unlock Deck
k this deck
22
A utility function is a mathematical function that assigns values to consumption bundles to represent the
A) Consumer's income
B) Consumer's preferences
C) Marginal rate of substitution
D) Prices of the goods in the consumption bundle
A) Consumer's income
B) Consumer's preferences
C) Marginal rate of substitution
D) Prices of the goods in the consumption bundle
Unlock Deck
Unlock for access to all 68 flashcards in this deck.
Unlock Deck
k this deck
23
Refer to Figure 5.5.Which diagram shows the income-consumption curve resulting from a decrease in income?
A) A
B) B
C) C
D) D
Unlock Deck
Unlock for access to all 68 flashcards in this deck.
Unlock Deck
k this deck
24
Refer to Figure 5.5.Which diagram shows the price-consumption curve resulting from a decrease in the price of good X?
A) A
B) B
C) C
D) D
Unlock Deck
Unlock for access to all 68 flashcards in this deck.
Unlock Deck
k this deck
25
Which of the following statements is true?
A) Corner solutions always satisfy the tangency condition
B) Interior solutions may or may not satisfy the tangency condition
C) Interior solutions always satisfy the tangency condition
D) Whenever the consumer purchases good X but not good Y, then MRSXY <= PX/PY at the chosen bundle
A) Corner solutions always satisfy the tangency condition
B) Interior solutions may or may not satisfy the tangency condition
C) Interior solutions always satisfy the tangency condition
D) Whenever the consumer purchases good X but not good Y, then MRSXY <= PX/PY at the chosen bundle
Unlock Deck
Unlock for access to all 68 flashcards in this deck.
Unlock Deck
k this deck
26
At a boundary choice,
A) The tangency condition always applies
B) There are affordable bundles containing a little bit more of that good and a little bit less of it
C) The consumer's best choice lies below the budget line
D) There are no affordable bundles that contain either a little bit more or a little bit less of some good
Unlock Deck
Unlock for access to all 68 flashcards in this deck.
Unlock Deck
k this deck
27
Whenever a consumer purchases good X but not good Y,then
A) MRSXY >= PX/PY at the chosen bundle
B) MRSXY <= PX/PY at the chosen bundle
C) MRSXY = PX/PY at the chosen bundle
D) MRSXY = -PX/PY at the chosen bundle
A) MRSXY >= PX/PY at the chosen bundle
B) MRSXY <= PX/PY at the chosen bundle
C) MRSXY = PX/PY at the chosen bundle
D) MRSXY = -PX/PY at the chosen bundle
Unlock Deck
Unlock for access to all 68 flashcards in this deck.
Unlock Deck
k this deck
28
Boundary solutions arise when
A) A good provides a consumer with little value per dollar relative to other alternatives
B) A consumer has a very low level of income
C) Indifference curves are convex
D) Indifference curves exhibit increasing MRS
A) A good provides a consumer with little value per dollar relative to other alternatives
B) A consumer has a very low level of income
C) Indifference curves are convex
D) Indifference curves exhibit increasing MRS
Unlock Deck
Unlock for access to all 68 flashcards in this deck.
Unlock Deck
k this deck
29
When indifference curves have ________ marginal rates of substitution,any interior choice that satisfies the tangency condition is the best affordable choice.
A) Constant
B) Increasing
C) Declining
D) Positive
A) Constant
B) Increasing
C) Declining
D) Positive
Unlock Deck
Unlock for access to all 68 flashcards in this deck.
Unlock Deck
k this deck
30
If everyone in an economy buys and sells goods at market-wide prices
A) People will pay the same prices, so everyone's marginal rate of substitution will be the same
B) People will pay the same prices, but will have different marginal rates of substitution
C) People will pay different prices, but will have the same marginal rates of substitution
D) People will pay different prices and therefore will have different marginal rates of substitution
Unlock Deck
Unlock for access to all 68 flashcards in this deck.
Unlock Deck
k this deck
31
Hailey's income is $40 per week.She spends all of it on coffee (C)and doughnuts (D).Coffee costs $2 per cup and doughnuts cost $1 each.Her marginal rate of substitution for coffee with doughnuts is D/C.How many cups of coffee and how many doughnuts will she purchase each week?
A) 15 cups of coffee and 10 doughnuts
B) 10 cups of coffee and 20 doughnuts
C) 20 cups of coffee and 10 doughnuts
D) 5 cups of coffee and 30 doughnuts
A) 15 cups of coffee and 10 doughnuts
B) 10 cups of coffee and 20 doughnuts
C) 20 cups of coffee and 10 doughnuts
D) 5 cups of coffee and 30 doughnuts
Unlock Deck
Unlock for access to all 68 flashcards in this deck.
Unlock Deck
k this deck
32
A curve that describes the relationship between the price of a good and the amount a particular consumer purchases (holding the consumer's income,preferences and all other prices fixed)is called
A) A price-consumption curve
B) An individual demand curve
C) An income-consumption curve
D) A budget line
A) A price-consumption curve
B) An individual demand curve
C) An income-consumption curve
D) A budget line
Unlock Deck
Unlock for access to all 68 flashcards in this deck.
Unlock Deck
k this deck
33
Suppose that soup is measured on the horizontal axis and bread is measured on the vertical axis.At an interior solution
A) MRSSB = PS/PB
B) MRSSB = - PS/PB
C) MRSSB = PB/PS
D) MRSSB = - PB/PS
A) MRSSB = PS/PB
B) MRSSB = - PS/PB
C) MRSSB = PB/PS
D) MRSSB = - PB/PS
Unlock Deck
Unlock for access to all 68 flashcards in this deck.
Unlock Deck
k this deck
34
The curve that shows how the best affordable consumption bundle changes as the price of a good changes (holding the consumer's income,preferences and all other prices fixed)is called
A) A price-consumption curve
B) An individual demand curve
C) An income-consumption curve
D) A budget line
A) A price-consumption curve
B) An individual demand curve
C) An income-consumption curve
D) A budget line
Unlock Deck
Unlock for access to all 68 flashcards in this deck.
Unlock Deck
k this deck
35
Refer to Figure 5.4.Which consumption bundle would maximize the consumer's utility?
A) A
B) B
C) C
D) D
Unlock Deck
Unlock for access to all 68 flashcards in this deck.
Unlock Deck
k this deck
36
Which of the following conditions must hold if a consumer is maximizing their utility?
A) MUX x PX = MUY x PY
B) MUX = MUY
C) MUX/PY = MUY/PX
D) MUX/PX = MUY/PY
A) MUX x PX = MUY x PY
B) MUX = MUY
C) MUX/PY = MUY/PX
D) MUX/PX = MUY/PY
Unlock Deck
Unlock for access to all 68 flashcards in this deck.
Unlock Deck
k this deck
37
When the government provides food stamps to low-income households,
A) The household definitely purchases more food
B) The household purchases less food
C) Purchases of food may increase or decrease
D) The household's utility is greater than if they received cash aid
A) The household definitely purchases more food
B) The household purchases less food
C) Purchases of food may increase or decrease
D) The household's utility is greater than if they received cash aid
Unlock Deck
Unlock for access to all 68 flashcards in this deck.
Unlock Deck
k this deck
38
According to the No-Overlap Rule,
A) The area above the indifference curve that runs through the consumer's best bundle does not overlap with the area below the budget line
B) The area above the indifference curve that runs through the consumer's best bundle does not overlap with the area above the budget line
C) The area above the indifference curve that runs through the consumer's best bundle should overlap with the area below the budget line
D) The area above the indifference curve that runs through any bundle other than the consumer's best bundle does not overlap with the area below the budget line
Unlock Deck
Unlock for access to all 68 flashcards in this deck.
Unlock Deck
k this deck
39
An affordable consumption bundle is an interior choice if
A) It lies below the budget line
B) For each good, there are affordable bundles containing a little bit more of that good and a little bit less of the other good
C) For each good, there are no other affordable bundles containing a little bit more of that good and a little bit less of the other good
D) It exhausts the consumer's income
Unlock Deck
Unlock for access to all 68 flashcards in this deck.
Unlock Deck
k this deck
40
Mike's income is $450 per month.He spends all of it on books (B)and CDs (C).Books cost $10 and CD's cost $15.His preferences correspond to the utility function U(B,C)= BxC.For that utility function,the marginal benefit of books is C and the marginal benefit of CDs is B. How many books and how many CDs will he purchase in a month?
A) 10 CDs and 30 Books
B) 30 CDs and 10 Books
C) 20 CDs and 15 Books
D) 15 CDs and 30 Books
A) 10 CDs and 30 Books
B) 30 CDs and 10 Books
C) 20 CDs and 15 Books
D) 15 CDs and 30 Books
Unlock Deck
Unlock for access to all 68 flashcards in this deck.
Unlock Deck
k this deck
41
If a good is normal,then the Engel curve
A) Slopes upward
B) Slopes downward
C) Is vertical
D) Is horizontal
A) Slopes upward
B) Slopes downward
C) Is vertical
D) Is horizontal
Unlock Deck
Unlock for access to all 68 flashcards in this deck.
Unlock Deck
k this deck
42
A curve that shows how the best available consumption bundle changes as income changes (holding the consumer's preferences and all other prices fixed)is called
A) A price-consumption curve
B) An individual demand curve
C) An income-consumption curve
D) A budget line
A) A price-consumption curve
B) An individual demand curve
C) An income-consumption curve
D) A budget line
Unlock Deck
Unlock for access to all 68 flashcards in this deck.
Unlock Deck
k this deck
43
If the income-consumption path slopes down,then
A) Both goods are inferior
B) Both goods are normal
C) One good is normal and the other good is inferior
D) We can't tell anything about whether the goods are normal or inferior
A) Both goods are inferior
B) Both goods are normal
C) One good is normal and the other good is inferior
D) We can't tell anything about whether the goods are normal or inferior
Unlock Deck
Unlock for access to all 68 flashcards in this deck.
Unlock Deck
k this deck
44
Refer to Figure 5.7.Which diagram best represents an Engle curve where soup is a normal good?
A) A
B) B
C) C
D) D
Unlock Deck
Unlock for access to all 68 flashcards in this deck.
Unlock Deck
k this deck
45
If an increase in the price of one good causes the demand curve for another good to shift to the left,then the two goods are
A) Substitutes
B) Complements
C) Normal
D) Unrelated
A) Substitutes
B) Complements
C) Normal
D) Unrelated
Unlock Deck
Unlock for access to all 68 flashcards in this deck.
Unlock Deck
k this deck
46
When the price elasticity of demand is large in magnitude,a _____ increase in the price leads to a _____ reduction in the amount purchased and the demand curve is relatively ______.
A) Slight; substantial; steep
B) Slight; slight; flat
C) Large; slight; steep
D) Slight; substantial; flat
Unlock Deck
Unlock for access to all 68 flashcards in this deck.
Unlock Deck
k this deck
47
When the price elasticity of demand is small in magnitude,a _____ increase in the price leads to a _____ reduction in the amount purchased and the demand curve is relatively ______.
A) Slight; substantial; steep
B) Slight; slight; flat
C) Large; slight; steep
D) Slight; substantial; flat
Unlock Deck
Unlock for access to all 68 flashcards in this deck.
Unlock Deck
k this deck
48
If the income-consumption path slopes upward,then
A) Both goods are normal goods
B) Both goods are inferior goods
C) The goods are substitutes
D) The goods are complements
A) Both goods are normal goods
B) Both goods are inferior goods
C) The goods are substitutes
D) The goods are complements
Unlock Deck
Unlock for access to all 68 flashcards in this deck.
Unlock Deck
k this deck
49
If an increase in the price of one good causes the demand curve for another good to shift to the right,then the two goods are
A) Substitutes
B) Complements
C) Normal
D) Unrelated
A) Substitutes
B) Complements
C) Normal
D) Unrelated
Unlock Deck
Unlock for access to all 68 flashcards in this deck.
Unlock Deck
k this deck
50
If two goods are substitutes,then an increase in the price of one will cause
A) A leftward shift of the demand curve for the other good
B) A rightward shift of the demand curve for the other good
C) A movement up and to the left along the demand curve for the other good
D) A movement down and to the right along the demand curve for the other good
A) A leftward shift of the demand curve for the other good
B) A rightward shift of the demand curve for the other good
C) A movement up and to the left along the demand curve for the other good
D) A movement down and to the right along the demand curve for the other good
Unlock Deck
Unlock for access to all 68 flashcards in this deck.
Unlock Deck
k this deck
51
Refer to Figure 5.6.Which diagram shows an increase in income with both bread and soup being normal goods?
A) A
B) B
C) C
D) D
Unlock Deck
Unlock for access to all 68 flashcards in this deck.
Unlock Deck
k this deck
52
A curve that describes the relationship between income and the amount of a good consumed (holding the consumer's preferences and all other prices fixed)is called
A) A price-consumption curve
B) The Engel curve
C) An income-consumption curve
D) A budget line
A) A price-consumption curve
B) The Engel curve
C) An income-consumption curve
D) A budget line
Unlock Deck
Unlock for access to all 68 flashcards in this deck.
Unlock Deck
k this deck
53
In Canada provincial regulatory boards set tiered prices for electricity.These tiered prices lead to budget lines that are
A) Upward-sloping
B) Kinked
C) Horizontal at a specific level of electricity consumption
D) Vertical at a specific level of electricity consumption
A) Upward-sloping
B) Kinked
C) Horizontal at a specific level of electricity consumption
D) Vertical at a specific level of electricity consumption
Unlock Deck
Unlock for access to all 68 flashcards in this deck.
Unlock Deck
k this deck
54
Refer to Figure 5.6.Which diagram shows an increase in income with bread being inferior and soup being normal?
A) A
B) B
C) C
D) D
Unlock Deck
Unlock for access to all 68 flashcards in this deck.
Unlock Deck
k this deck
55
Suppose that books are measured on the horizontal axis and CD's are measured on the vertical axis.As long as the law of demand holds for books,than an increase in the price of books will generate a price-consumption path that traces a path
A) To the left
B) To the right
C) Upward
D) Downward
A) To the left
B) To the right
C) Upward
D) Downward
Unlock Deck
Unlock for access to all 68 flashcards in this deck.
Unlock Deck
k this deck
56
When a good is normal,
A) An increase in income raises consumption at each price, so the demand curve shifts to the left
B) An increase in income raises consumption at each price, so the demand curve shifts to the right
C) A decrease in income lowers consumption at each price, so the demand curve shifts to the right
D) An increase in income lowers consumption at each price, so the demand curve shifts to the left
Unlock Deck
Unlock for access to all 68 flashcards in this deck.
Unlock Deck
k this deck
57
If a change in the price of one good does not cause a shift in the demand curve of another good,then the two goods are
A) Substitutes
B) Complements
C) Normal
D) Not related
A) Substitutes
B) Complements
C) Normal
D) Not related
Unlock Deck
Unlock for access to all 68 flashcards in this deck.
Unlock Deck
k this deck
58
Which of the following statements is true?
A) No good can be inferior at all levels of income
B) The income elasticity of demand is negative for normal goods
C) It is possible for a good to be inferior at all income levels
D) It is possible for all of the goods a consumer buys to be inferior
A) No good can be inferior at all levels of income
B) The income elasticity of demand is negative for normal goods
C) It is possible for a good to be inferior at all income levels
D) It is possible for all of the goods a consumer buys to be inferior
Unlock Deck
Unlock for access to all 68 flashcards in this deck.
Unlock Deck
k this deck
59
Refer to Figure 5.7.Which diagram best represents an income-consumption curve where soup is a normal good?
A) A
B) B
C) C
D) D
Unlock Deck
Unlock for access to all 68 flashcards in this deck.
Unlock Deck
k this deck
60
Refer to Figure 5.6.Which diagram shows a decrease in income with bread being normal and soup being inferior?
A) A
B) B
C) C
D) D
Unlock Deck
Unlock for access to all 68 flashcards in this deck.
Unlock Deck
k this deck
61
Nicole's income is $1,000 per month.She spends all of it on shoes (S)and books (B).Shoes cost $50 and books cost $25.Her marginal rate of substitution for shoes with books is MRSSB = 2B/3S.Illustrate her utility-maximizing combination of shoes and books and draw her price-consumption curve if the price of books rises to $30.
B. M = PS (2/3)(PB/PS)B + PBB, which implies B = (3/5) (M/PB ) =
B. When PB = $30, B = 20. The new utility-maximizing combination of books and shoes is represented by point b in Figure 5.13. Connecting points a and b gives the price-consumption curve.
B. M = PS (2/3)(PB/PS)B + PBB, which implies B = (3/5) (M/PB ) =
B. When PB = $30, B = 20. The new utility-maximizing combination of books and shoes is represented by point b in Figure 5.13. Connecting points a and b gives the price-consumption curve.
Unlock Deck
Unlock for access to all 68 flashcards in this deck.
Unlock Deck
k this deck
62
Stewie spends all of his income on movie rentals (R)and noodles (N).His marginal rate of substitution for rentals with noodles is given by MRSRN = 20/ÖR.Suppose that movies rent for $2 and noodles cost $1.Plot his income-consumption curve,his Engle curve for movie rentals and his Engel curve for noodles.
Unlock Deck
Unlock for access to all 68 flashcards in this deck.
Unlock Deck
k this deck
63
Using carefully-labeled graphs,explain how an individual demand curve is derived from the utility-maximizing behavior of a consumer.
Unlock Deck
Unlock for access to all 68 flashcards in this deck.
Unlock Deck
k this deck
64
Suppose that steak is a normal good and vegetables are inferior goods.Using a carefully-labeled diagram,illustrate the income-consumption curve that would result from an increase in a consumer's income.
Unlock Deck
Unlock for access to all 68 flashcards in this deck.
Unlock Deck
k this deck
65
The revealed preference approach refers to
A) Asking consumer to reveal their preferences using survey methods
B) Estimating demand curves by using data on individual consumers
C) A statistical method used to estimate demand curves
D) A method of gathering information about consumer's preferences by observing their actual choices
A) Asking consumer to reveal their preferences using survey methods
B) Estimating demand curves by using data on individual consumers
C) A statistical method used to estimate demand curves
D) A method of gathering information about consumer's preferences by observing their actual choices
Unlock Deck
Unlock for access to all 68 flashcards in this deck.
Unlock Deck
k this deck
66
Suppose that an individual consumes just hamburgers and soft drinks.Using a carefully-labeled diagram,derive the price-consumption curve that would result from a decrease in the price of hamburgers.
Unlock Deck
Unlock for access to all 68 flashcards in this deck.
Unlock Deck
k this deck
67
Using a carefully-labeled diagram,explain an Engel curve for a good that is initially a normal good,but eventually becomes an inferior good.
Unlock Deck
Unlock for access to all 68 flashcards in this deck.
Unlock Deck
k this deck
68
The price of CDs is $15 and the price of pizzas is $10.Derek spends all of his income buying 2 CDs and 6 pizzas per week (and nothing else).Determine Derek's income,draw his budget line and represent his utility-maximizing point using an indifference curve.
Unlock Deck
Unlock for access to all 68 flashcards in this deck.
Unlock Deck
k this deck
Unlock Deck
Unlock for access to all 68 flashcards in this deck.


