Deck 3: Demand, Supply, and Market Equilibrium
Full screen (f)
Question
Question
Question
Question
Question
Question
Question
Question
Question
Question
Question
Question
The table below shows the weekly demand for hamburger in a market where there are just three buyers.  Refer to the above table. At a price of $6, the weekly market quantity demanded for hamburger is:
A) 17
B) 23
C) 18
D) 24
Refer to the above table. At a price of $6, the weekly market quantity demanded for hamburger is:A) 17
B) 23
C) 18
D) 24
Question
Question
Question
Question
Question
Question
The table below shows the weekly demand for hamburger in a market where there are just three buyers.  Refer to the above table. If the price of hamburger falls from $5 to $3, then the weekly market quantity demanded will:
A) Increase from 24 to 52
B) Decrease from 52 to 24
C) Increase from 120 to 156
D) Increase from 29 to 55
Refer to the above table. If the price of hamburger falls from $5 to $3, then the weekly market quantity demanded will:A) Increase from 24 to 52
B) Decrease from 52 to 24
C) Increase from 120 to 156
D) Increase from 29 to 55
Question
Question
The table below shows the weekly demand for hamburger in a market where there are just three buyers. 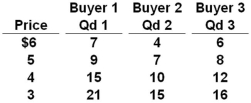 Refer to the above table. If there were 200 buyers in the market, each with a demand schedule identical to Buyer 2 in the table above, then the weekly quantity of hamburger demanded in the market at a price of $4 would be:
A) 8,000
B) 2,000
C) 7,400
D) 4,000
Refer to the above table. If there were 200 buyers in the market, each with a demand schedule identical to Buyer 2 in the table above, then the weekly quantity of hamburger demanded in the market at a price of $4 would be:A) 8,000
B) 2,000
C) 7,400
D) 4,000
Question
Use the following graph of the demand for coffee:  Refer to the above diagram of three demand curves for coffee. Which of the following would cause a shift in coffee demand from D1 to D3?
A) A decrease in the cost of producing coffee
B) A scientific report stating that coffee improves memory
C) A decrease in the prices of cream and sugar
D) A decrease in the price of tea
Refer to the above diagram of three demand curves for coffee. Which of the following would cause a shift in coffee demand from D1 to D3?A) A decrease in the cost of producing coffee
B) A scientific report stating that coffee improves memory
C) A decrease in the prices of cream and sugar
D) A decrease in the price of tea
Question
Question
Question
Question
Question
Question
Use the following graph of the demand for coffee:  Refer to the above diagram of three demand curves for coffee. Which of the following would cause a shift in coffee demand from D1 to D2?
A) A decrease in the price of tea
B) An increase in consumer incomes
C) An increase in the prices of cream and sugar
D) A decrease in the price of coffee
Refer to the above diagram of three demand curves for coffee. Which of the following would cause a shift in coffee demand from D1 to D2?A) A decrease in the price of tea
B) An increase in consumer incomes
C) An increase in the prices of cream and sugar
D) A decrease in the price of coffee
Question
Question
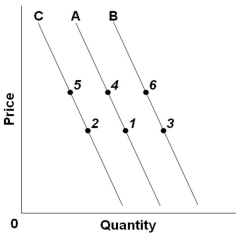 Refer to the above graph with three demand curves. An increase in price, other factors constant, would cause a change from:
A) Point 4 to point 5
B) Point 3 to point 6
C) Point 1 to point 5
D) Point 2 to point 4
Question
Question
 Refer to the above graph with three demand curves. A "decrease in demand" would be illustrated as a change from:
A) Point 1 to point 4
B) Point 1 to point 3
C) Line C to B
D) Line A to C
Question
Question
Question
Question
Question
 Refer to the above graph with three demand curves. An "increase in quantity demanded" would be illustrated by a change from:
A) Point 4 to point 6
B) Point 5 to point 1
C) Point 4 to point 1
D) Point 2 to point 5
Question
Question
Question
Question
Use the following graph of the demand for coffee: 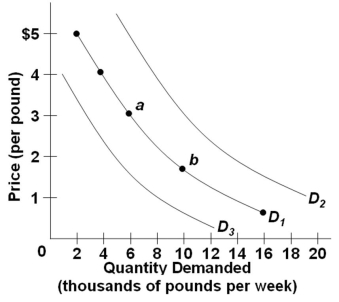 Refer to the above diagram of three demand curves for coffee. An increase in the price of coffee, other factors constant, would cause a:
A) Shift from D1 to D3
B) Shift from D1 to D2
C) Movement from point a to point b
D) Movement from point b to point a
Refer to the above diagram of three demand curves for coffee. An increase in the price of coffee, other factors constant, would cause a:A) Shift from D1 to D3
B) Shift from D1 to D2
C) Movement from point a to point b
D) Movement from point b to point a
Question
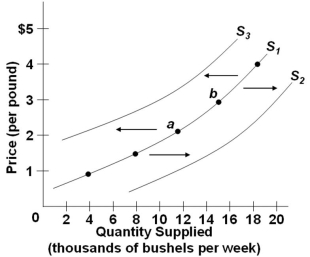 Refer to the diagram above, which shows three supply curves for corn. A movement from point a to point b is caused by a change in the:
A) Price of resources used to produce corn
B) Number of corn farmers
C) Price of corn in the market
D) Technology of corn farming
Question
Question
Question
 Refer to the figure above, which shows three supply curves for corn. Which of the following would cause the supply of corn to shift from S1 to S2?
A) An increase in the price of fertilizer
B) A change in consumer tastes away from cornbread
C) A decrease in consumer incomes, assuming corn is a normal good
D) The development of a more effective insecticide against corn rootworm
Question
Question
Question
 Refer to the diagram above, which shows three supply curves for corn. Which of the following would cause the supply of corn to shift from S1 to S3?
A) A decrease in the cost of equipment used in corn farming
B) An increase in the price of soybeans
C) A decrease in the price of corn
D) An increase in the number of acres of farmland allocated to corn
Question
Question
Question
Question
Question
Question
Question
Question
Question
Question
Question
Question
Question
Question
 Refer to the above diagram for the milk market. In this market, the equilibrium price is ____ and equilibrium quantity is ___.
A) $1.50 per gallon; 28 million gallons
B) $1.50 per gallon; 30 million gallons
C) $28 per gallon; 150 million gallons
D) $1.00 per gallon; 35 million gallons
Question
 Refer to the above diagram of the market for corn. If the price in this market is at $4 per bushel, then there will be a:
A) Surplus and the price will tend to rise
B) Shortage and the price will tend to rise
C) Surplus and the price will tend to fall
D) Shortage and the price will tend to fall
Question
Question
 Refer to the above table. At a price of $15 per unit, which of the following would exist?
A) A shortage of 1,600 units
B) A surplus of 1,000 units
C) A shortage of 1,000 units
D) A surplus of 600 units
Question
 Refer to the above graph. An increase in price, other factors constant, would cause a change from:
A) Point 5 to point 1
B) Point 4 to point 5
C) Point 1 to point 6
D) Point 3 to point 4
Question
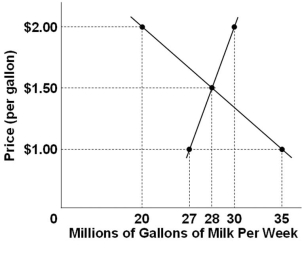 Refer to the above diagram for the milk market. If the price were $2 per gallon, then there would be a:
A) Shortage of 20 million gallons
B) Shortage of 10 million gallons
C) Surplus of 10 million gallons
D) Surplus of 30 million gallons
Question
Question
Question
 Refer to the above diagram for the milk market. There would be a shortage of milk whenever the price is:
A) Higher than $1.50 per gallon
B) Higher than $2.00 per gallon
C) Lower than $1.50 per gallon
D) Lower than $2.00 per gallon
Question
Question
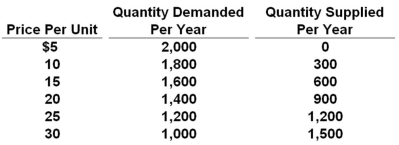 Refer to the above table. In this competitive market, the price and quantity will settle at:
A) $10 and 2,000 units
B) $15 and 1,600 units
C) $20 and 900 units
D) $25 and 1,200 units
Question
Question
Question
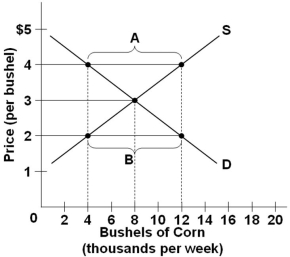 Refer to the above diagram illustrating the market for corn. If the price in this market is fixed at $2 per bushel, then:
A) Sellers will not be able to sell all the corn that they intended to sell
B) Sellers will quickly run out of corn that they bring to market
C) Buyers will find too much corn in the market
D) Buyers will be able to get as much corn as they wish to buy
Question
 Refer to the above diagram of the market for corn. There will be a surplus of 8 thousand bushels at the price of:
A) $4/bushel
B) $3/bushel
C) $2/bushel
D) $5/bushel
Question
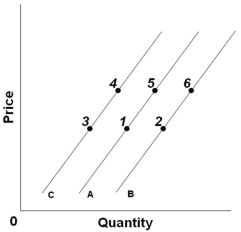 Refer to the above graph. A decrease in supply would best be reflected by a change from:
A) Point 2 to point 1
B) Point 5 to point 1
C) Point 5 to point 2
D) Point 3 to point 6
Question
 Refer to the above table. A surplus of 500 units will occur when the price is:
A) $10 per unit
B) $15 per unit
C) $20 per unit
D) $30 per unit
Question
Question
Question

Unlock Deck
Sign up to unlock the cards in this deck!
Unlock Deck
Unlock Deck
1/202
Play
Full screen (f)
Deck 3: Demand, Supply, and Market Equilibrium
1
An increase in the demand for MP3 music indicates that more are:
A) Purchased even if prices of MP3 music stayed the same
B) Demanded because MP3 music prices decreased
C) Demanded because sellers are selling more MP3 music
D) Purchased because sellers are putting MP3 music on sale
A) Purchased even if prices of MP3 music stayed the same
B) Demanded because MP3 music prices decreased
C) Demanded because sellers are selling more MP3 music
D) Purchased because sellers are putting MP3 music on sale
Purchased even if prices of MP3 music stayed the same
2
The horizontal axis of a graph that shows a market demand curve indicates the:
A) Different prices at which various levels of output can be sold
B) Number of consumers who are in the market for this product
C) Various quantities of output at which the market will be cleared
D) Quantities which consumers will be willing and able to buy at various prices
A) Different prices at which various levels of output can be sold
B) Number of consumers who are in the market for this product
C) Various quantities of output at which the market will be cleared
D) Quantities which consumers will be willing and able to buy at various prices
Quantities which consumers will be willing and able to buy at various prices
3
A higher price reduces the quantity demanded for a product because:
A) The purchasing power of individuals increases
B) The financial assets of individuals increase
C) Individuals will buy more of the product and less of its substitutes
D) Individuals can afford less of the product and will switch to substitutes
A) The purchasing power of individuals increases
B) The financial assets of individuals increase
C) Individuals will buy more of the product and less of its substitutes
D) Individuals can afford less of the product and will switch to substitutes
Individuals can afford less of the product and will switch to substitutes
4
Which statement best illustrates the concept of diminishing marginal utility?
A) As one consumes more hamburgers per week, one would be willing to pay a higher price for additional hamburgers
B) Some consumers will receive less satisfaction from consuming hamburgers than from consuming fried chicken
C) A typical consumer will receive less satisfaction from consuming the fourth hamburger than from the third hamburger in a week
D) A decrease in the price of hamburgers will cause consumers to buy more hamburgers because they can afford to buy more
Unlock Deck
Unlock for access to all 202 flashcards in this deck.
Unlock Deck
k this deck
5
The market demand schedule or curve for a product shows the relationship between how much of the product buyers are willing and able to buy and the:
A) Product's price
B) Buyers' incomes
C) Cost of producing the product
D) Time period, say, from one month to the next
A) Product's price
B) Buyers' incomes
C) Cost of producing the product
D) Time period, say, from one month to the next
Unlock Deck
Unlock for access to all 202 flashcards in this deck.
Unlock Deck
k this deck
6
Other things being equal, the law of demand suggests that as:
A) The demand for iPads increases, this will cause the price to increase
B) Income increases, the quantity of iPads demanded will increase
C) The price of iPads decreases, the quantity demanded will increase
D) The price of iPads decreases, the quantity demanded will decrease
A) The demand for iPads increases, this will cause the price to increase
B) Income increases, the quantity of iPads demanded will increase
C) The price of iPads decreases, the quantity demanded will increase
D) The price of iPads decreases, the quantity demanded will decrease
Unlock Deck
Unlock for access to all 202 flashcards in this deck.
Unlock Deck
k this deck
7
All markets involve the following elements, except:
A) Demand or buyers
B) Face-to-face negotiation
C) Prices of goods and services
D) Supply or sellers
A) Demand or buyers
B) Face-to-face negotiation
C) Prices of goods and services
D) Supply or sellers
Unlock Deck
Unlock for access to all 202 flashcards in this deck.
Unlock Deck
k this deck
8
The following are explanations of the Law of Demand, except:
A) Expectations effect
B) Diminishing marginal utility
C) Income effect
D) Substitution effect
A) Expectations effect
B) Diminishing marginal utility
C) Income effect
D) Substitution effect
Unlock Deck
Unlock for access to all 202 flashcards in this deck.
Unlock Deck
k this deck
9
When high-school and college graduates apply for jobs in the labor markets,
A) Job applicants are the "buyers" while employers are the "sellers".
B) Job applicants are the "sellers" while employers are the "buyers".
C) Job applicants and employers are both "sellers".
D) Job applicants and employers are both "buyers".
A) Job applicants are the "buyers" while employers are the "sellers".
B) Job applicants are the "sellers" while employers are the "buyers".
C) Job applicants and employers are both "sellers".
D) Job applicants and employers are both "buyers".
Unlock Deck
Unlock for access to all 202 flashcards in this deck.
Unlock Deck
k this deck
10
A result of a fall in the price of gasoline, consumers can afford to buy more gasoline for more driving trips. This is an illustration of:
A) The income effect
B) The substitution effect
C) Diminishing marginal utility
D) Consumer sovereignty
A) The income effect
B) The substitution effect
C) Diminishing marginal utility
D) Consumer sovereignty
Unlock Deck
Unlock for access to all 202 flashcards in this deck.
Unlock Deck
k this deck
11
As a result of a decrease in the price of online streaming movies, consumers download more movies online and buy fewer DVDs. This is an illustration of:
A) Consumer sovereignty
B) The income effect
C) The substitution effect
D) Diminishing marginal utility
A) Consumer sovereignty
B) The income effect
C) The substitution effect
D) Diminishing marginal utility
Unlock Deck
Unlock for access to all 202 flashcards in this deck.
Unlock Deck
k this deck
12
The table below shows the weekly demand for hamburger in a market where there are just three buyers. Refer to the above table. At a price of $6, the weekly market quantity demanded for hamburger is:
A) 17
B) 23
C) 18
D) 24
Refer to the above table. At a price of $6, the weekly market quantity demanded for hamburger is:A) 17
B) 23
C) 18
D) 24
Unlock Deck
Unlock for access to all 202 flashcards in this deck.
Unlock Deck
k this deck
13
In understanding and analyzing "demand," we focus on how much of a product the buyers are:
A) Willing and wanting to buy
B) Actually buying now and in the recent past
C) Able to buy with their given income
D) Willing and able to buy
A) Willing and wanting to buy
B) Actually buying now and in the recent past
C) Able to buy with their given income
D) Willing and able to buy
Unlock Deck
Unlock for access to all 202 flashcards in this deck.
Unlock Deck
k this deck
14
Which of the following is consistent with the law of demand?
A) A decrease in the price of tacos causes sellers to want to sell less
B) An increase in the people's craving for pizza causes buyers to buy more pizza
C) An increase in the price of hamburgers causes buyers to buy fewer hamburgers
D) A decrease in the price of egg rolls causes a decrease in the quantity of egg rolls demanded
Unlock Deck
Unlock for access to all 202 flashcards in this deck.
Unlock Deck
k this deck
15
The idea of the Law of Demand, as applied to electric cars, assumes which of the following to be constant?
A) Price of electric cars
B) Price of gasoline cars
C) Quantity of electric cars demanded by buyers
D) How much sellers are charging customers for electric cars
A) Price of electric cars
B) Price of gasoline cars
C) Quantity of electric cars demanded by buyers
D) How much sellers are charging customers for electric cars
Unlock Deck
Unlock for access to all 202 flashcards in this deck.
Unlock Deck
k this deck
16
When economists describe "a market," they mean:
A) A place where stocks and bonds are traded
B) A communication network that allow individuals to keep in touch with each other
C) A hypothetical place where the production of goods and services takes place
D) A system that allows buyers and sellers to interact with one another
A) A place where stocks and bonds are traded
B) A communication network that allow individuals to keep in touch with each other
C) A hypothetical place where the production of goods and services takes place
D) A system that allows buyers and sellers to interact with one another
Unlock Deck
Unlock for access to all 202 flashcards in this deck.
Unlock Deck
k this deck
17
In order to derive a market demand curve from individuals' demand curves, we add up the:
A) Various individuals' quantities demanded at each price level
B) Various prices that each buyer is willing and able to pay
C) Incomes of all buyers, assuming that their tastes remain constant
D) Total number of buyers in the market at each time period
A) Various individuals' quantities demanded at each price level
B) Various prices that each buyer is willing and able to pay
C) Incomes of all buyers, assuming that their tastes remain constant
D) Total number of buyers in the market at each time period
Unlock Deck
Unlock for access to all 202 flashcards in this deck.
Unlock Deck
k this deck
18
The table below shows the weekly demand for hamburger in a market where there are just three buyers. Refer to the above table. If the price of hamburger falls from $5 to $3, then the weekly market quantity demanded will:
A) Increase from 24 to 52
B) Decrease from 52 to 24
C) Increase from 120 to 156
D) Increase from 29 to 55
Refer to the above table. If the price of hamburger falls from $5 to $3, then the weekly market quantity demanded will:A) Increase from 24 to 52
B) Decrease from 52 to 24
C) Increase from 120 to 156
D) Increase from 29 to 55
Unlock Deck
Unlock for access to all 202 flashcards in this deck.
Unlock Deck
k this deck
19
When economists speak of "demand" in a particular market, they refer to:
A) The whole demand curve or schedule
B) One point on the demand curve
C) One price-quantity combination on the demand schedule
D) How much of an item buyers want to buy at a given price
A) The whole demand curve or schedule
B) One point on the demand curve
C) One price-quantity combination on the demand schedule
D) How much of an item buyers want to buy at a given price
Unlock Deck
Unlock for access to all 202 flashcards in this deck.
Unlock Deck
k this deck
20
The table below shows the weekly demand for hamburger in a market where there are just three buyers. Refer to the above table. If there were 200 buyers in the market, each with a demand schedule identical to Buyer 2 in the table above, then the weekly quantity of hamburger demanded in the market at a price of $4 would be:
A) 8,000
B) 2,000
C) 7,400
D) 4,000
Refer to the above table. If there were 200 buyers in the market, each with a demand schedule identical to Buyer 2 in the table above, then the weekly quantity of hamburger demanded in the market at a price of $4 would be:A) 8,000
B) 2,000
C) 7,400
D) 4,000
Unlock Deck
Unlock for access to all 202 flashcards in this deck.
Unlock Deck
k this deck
21
Use the following graph of the demand for coffee: Refer to the above diagram of three demand curves for coffee. Which of the following would cause a shift in coffee demand from D1 to D3?
A) A decrease in the cost of producing coffee
B) A scientific report stating that coffee improves memory
C) A decrease in the prices of cream and sugar
D) A decrease in the price of tea
Refer to the above diagram of three demand curves for coffee. Which of the following would cause a shift in coffee demand from D1 to D3?A) A decrease in the cost of producing coffee
B) A scientific report stating that coffee improves memory
C) A decrease in the prices of cream and sugar
D) A decrease in the price of tea
Unlock Deck
Unlock for access to all 202 flashcards in this deck.
Unlock Deck
k this deck
22
Suppose that goods A and B are close substitutes. If the price of good A falls, then we would expect an:
A) Increase in the demand for A and an increase in the quantity of B demanded
B) Increase in the demand for A and a decrease in the quantity of B demanded
C) Increase in the quantity of A demanded and a decrease in the demand for B
D) Increase in the demand for good A as well as for good B
A) Increase in the demand for A and an increase in the quantity of B demanded
B) Increase in the demand for A and a decrease in the quantity of B demanded
C) Increase in the quantity of A demanded and a decrease in the demand for B
D) Increase in the demand for good A as well as for good B
Unlock Deck
Unlock for access to all 202 flashcards in this deck.
Unlock Deck
k this deck
23
Which of the following is not a determinant of demand for laptop computers?
A) Income of buyers of laptop computers
B) The cost of inputs for producing laptop computers
C) The prices of related goods such as software and iPads
D) Expectations about the future price of laptop computers
A) Income of buyers of laptop computers
B) The cost of inputs for producing laptop computers
C) The prices of related goods such as software and iPads
D) Expectations about the future price of laptop computers
Unlock Deck
Unlock for access to all 202 flashcards in this deck.
Unlock Deck
k this deck
24
When economists say that the demand for a product has decreased, they mean that:
A) The demand curve has shifted to the right
B) The product has become particularly scarce for some reason
C) The product has become more expensive and thus consumers are buying less of it
D) Consumers are now willing and able to buy less of this product at each possible price
A) The demand curve has shifted to the right
B) The product has become particularly scarce for some reason
C) The product has become more expensive and thus consumers are buying less of it
D) Consumers are now willing and able to buy less of this product at each possible price
Unlock Deck
Unlock for access to all 202 flashcards in this deck.
Unlock Deck
k this deck
25
Which of the following factors is a "demand shifter" for new houses?
A) The price of lumber
B) Wages for construction workers
C) The price of new houses
D) The interest rates on mortgage loans
A) The price of lumber
B) Wages for construction workers
C) The price of new houses
D) The interest rates on mortgage loans
Unlock Deck
Unlock for access to all 202 flashcards in this deck.
Unlock Deck
k this deck
26
Which would be a likely cause of an increase in the demand for pizza?
A) A reduced desire for take-out and fast-food dining
B) A decrease in the price of hamburger sandwiches
C) A decrease in the prices of cheese, pepperoni, and mushrooms
D) A health report showing eating pizza reduces stress
A) A reduced desire for take-out and fast-food dining
B) A decrease in the price of hamburger sandwiches
C) A decrease in the prices of cheese, pepperoni, and mushrooms
D) A health report showing eating pizza reduces stress
Unlock Deck
Unlock for access to all 202 flashcards in this deck.
Unlock Deck
k this deck
27
Use the following graph of the demand for coffee: Refer to the above diagram of three demand curves for coffee. Which of the following would cause a shift in coffee demand from D1 to D2?
A) A decrease in the price of tea
B) An increase in consumer incomes
C) An increase in the prices of cream and sugar
D) A decrease in the price of coffee
Refer to the above diagram of three demand curves for coffee. Which of the following would cause a shift in coffee demand from D1 to D2?A) A decrease in the price of tea
B) An increase in consumer incomes
C) An increase in the prices of cream and sugar
D) A decrease in the price of coffee
Unlock Deck
Unlock for access to all 202 flashcards in this deck.
Unlock Deck
k this deck
28
For most products, purchases tend to fall with decreases in buyers' incomes. Such products are known as:
A) Inferior goods
B) Direct goods
C) Average goods
D) Normal goods
A) Inferior goods
B) Direct goods
C) Average goods
D) Normal goods
Unlock Deck
Unlock for access to all 202 flashcards in this deck.
Unlock Deck
k this deck
29
Refer to the above graph with three demand curves. An increase in price, other factors constant, would cause a change from:A) Point 4 to point 5
B) Point 3 to point 6
C) Point 1 to point 5
D) Point 2 to point 4
Unlock Deck
Unlock for access to all 202 flashcards in this deck.
Unlock Deck
k this deck
30
Which of the following would best be classified as a complement for new houses/homes?
A) Lumber or steel
B) Construction equipment
C) Mortgage loans
D) Rental apartments
A) Lumber or steel
B) Construction equipment
C) Mortgage loans
D) Rental apartments
Unlock Deck
Unlock for access to all 202 flashcards in this deck.
Unlock Deck
k this deck
31
Refer to the above graph with three demand curves. A "decrease in demand" would be illustrated as a change from:A) Point 1 to point 4
B) Point 1 to point 3
C) Line C to B
D) Line A to C
Unlock Deck
Unlock for access to all 202 flashcards in this deck.
Unlock Deck
k this deck
32
Which of the following will not cause a change in the demand for product A?
A) A change in the number of buyers
B) A change in the price of A
C) A decline in consumer incomes
D) A decrease in the price of close-substitute product B
A) A change in the number of buyers
B) A change in the price of A
C) A decline in consumer incomes
D) A decrease in the price of close-substitute product B
Unlock Deck
Unlock for access to all 202 flashcards in this deck.
Unlock Deck
k this deck
33
Which of the following goods would most probably be an inferior good?
A) French wines
B) Generic beer
C) Theater tickets
D) Steak
A) French wines
B) Generic beer
C) Theater tickets
D) Steak
Unlock Deck
Unlock for access to all 202 flashcards in this deck.
Unlock Deck
k this deck
34
If product Y is an inferior good, a decrease in consumer incomes will:
A) Make buyers want to buy less of Product Y
B) Not affect the sales of product Y
C) Shift the demand curve for product Y to the left
D) Shift the demand curve for product Y to the right
A) Make buyers want to buy less of Product Y
B) Not affect the sales of product Y
C) Shift the demand curve for product Y to the left
D) Shift the demand curve for product Y to the right
Unlock Deck
Unlock for access to all 202 flashcards in this deck.
Unlock Deck
k this deck
35
An increase in the price of digital cameras will result in a(n):
A) Shift of the demand curve for digital cameras to the left
B) Decrease in the demand for digital cameras
C) Shift of the demand curve for digital cameras to the right
D) Movement up and to the left along the demand curve for digital cameras
A) Shift of the demand curve for digital cameras to the left
B) Decrease in the demand for digital cameras
C) Shift of the demand curve for digital cameras to the right
D) Movement up and to the left along the demand curve for digital cameras
Unlock Deck
Unlock for access to all 202 flashcards in this deck.
Unlock Deck
k this deck
36
Refer to the above graph with three demand curves. An "increase in quantity demanded" would be illustrated by a change from:A) Point 4 to point 6
B) Point 5 to point 1
C) Point 4 to point 1
D) Point 2 to point 5
Unlock Deck
Unlock for access to all 202 flashcards in this deck.
Unlock Deck
k this deck
37
If the price of gasoline increases significantly, then we'd expect the demand curve for large trucks and SUVs to:
A) Shift to the right
B) Shift to the left
C) Become upward-sloping
D) Not shift, but there will be a movement along that demand curve
A) Shift to the right
B) Shift to the left
C) Become upward-sloping
D) Not shift, but there will be a movement along that demand curve
Unlock Deck
Unlock for access to all 202 flashcards in this deck.
Unlock Deck
k this deck
38
Which of the following factors will decrease the current demand for a product?
A) An expected increase in the future price of the product
B) A decrease in the current price of a substitute product
C) A decrease in the current price of a complementary product
D) An increase in the current price of a substitute product
A) An expected increase in the future price of the product
B) A decrease in the current price of a substitute product
C) A decrease in the current price of a complementary product
D) An increase in the current price of a substitute product
Unlock Deck
Unlock for access to all 202 flashcards in this deck.
Unlock Deck
k this deck
39
Which of the following pairs are not considered to be complementary goods?
A) Steel and cars
B) Digital cameras and memory cards
C) Gasoline and motor oil
D) Fertilizer and irrigation systems
A) Steel and cars
B) Digital cameras and memory cards
C) Gasoline and motor oil
D) Fertilizer and irrigation systems
Unlock Deck
Unlock for access to all 202 flashcards in this deck.
Unlock Deck
k this deck
40
Use the following graph of the demand for coffee: Refer to the above diagram of three demand curves for coffee. An increase in the price of coffee, other factors constant, would cause a:
A) Shift from D1 to D3
B) Shift from D1 to D2
C) Movement from point a to point b
D) Movement from point b to point a
Refer to the above diagram of three demand curves for coffee. An increase in the price of coffee, other factors constant, would cause a:A) Shift from D1 to D3
B) Shift from D1 to D2
C) Movement from point a to point b
D) Movement from point b to point a
Unlock Deck
Unlock for access to all 202 flashcards in this deck.
Unlock Deck
k this deck
41
Refer to the diagram above, which shows three supply curves for corn. A movement from point a to point b is caused by a change in the:A) Price of resources used to produce corn
B) Number of corn farmers
C) Price of corn in the market
D) Technology of corn farming
Unlock Deck
Unlock for access to all 202 flashcards in this deck.
Unlock Deck
k this deck
42
If the price of a product decreases, we would expect:
A) Demand to increase
B) Quantity supplied to decrease
C) Supply to decrease
D) Quantity supplied to increase
A) Demand to increase
B) Quantity supplied to decrease
C) Supply to decrease
D) Quantity supplied to increase
Unlock Deck
Unlock for access to all 202 flashcards in this deck.
Unlock Deck
k this deck
43
If farmers withhold some of their current corn harvest from the market because they anticipate a higher price of corn in the near future, then this would cause a(n):
A) Rightward shift in the current supply of corn
B) Movement up along the current supply curve of corn
C) Leftward shift in the current supply of corn
D) Movement down along the current supply curve of corn
A) Rightward shift in the current supply of corn
B) Movement up along the current supply curve of corn
C) Leftward shift in the current supply of corn
D) Movement down along the current supply curve of corn
Unlock Deck
Unlock for access to all 202 flashcards in this deck.
Unlock Deck
k this deck
44
Refer to the figure above, which shows three supply curves for corn. Which of the following would cause the supply of corn to shift from S1 to S2?A) An increase in the price of fertilizer
B) A change in consumer tastes away from cornbread
C) A decrease in consumer incomes, assuming corn is a normal good
D) The development of a more effective insecticide against corn rootworm
Unlock Deck
Unlock for access to all 202 flashcards in this deck.
Unlock Deck
k this deck
45
Which statement is true about supply?
A) There is an inverse relationship between price and quantity supplied
B) Supply refers to the amount of inventory that sellers have in their warehouses
C) As price decreases, producers are willing to put more of the good on the market for sale
D) To entice producers to offer more of a good on the market for sale, price must rise
Unlock Deck
Unlock for access to all 202 flashcards in this deck.
Unlock Deck
k this deck
46
A fall in the price of milk, used in the production of ice cream, will:
A) Decrease the supply of ice cream
B) Increase the supply of ice cream
C) Cause a movement along the supply curve of ice cream
D) Have no effect on the supply of ice cream
A) Decrease the supply of ice cream
B) Increase the supply of ice cream
C) Cause a movement along the supply curve of ice cream
D) Have no effect on the supply of ice cream
Unlock Deck
Unlock for access to all 202 flashcards in this deck.
Unlock Deck
k this deck
47
Refer to the diagram above, which shows three supply curves for corn. Which of the following would cause the supply of corn to shift from S1 to S3?A) A decrease in the cost of equipment used in corn farming
B) An increase in the price of soybeans
C) A decrease in the price of corn
D) An increase in the number of acres of farmland allocated to corn
Unlock Deck
Unlock for access to all 202 flashcards in this deck.
Unlock Deck
k this deck
48
Which of the following would cause a leftward shift in the supply curve for car washes?
A) An increase in the number of cars in the city
B) A decrease in taxes on car washes
C) An increase in the price of car washing equipment
D) A decrease in the price of water
A) An increase in the number of cars in the city
B) A decrease in taxes on car washes
C) An increase in the price of car washing equipment
D) A decrease in the price of water
Unlock Deck
Unlock for access to all 202 flashcards in this deck.
Unlock Deck
k this deck
49
A leftward shift of the supply curve for oil in the United States is most likely to result from:
A) A decrease in the fees that oil companies must pay for drilling licenses
B) An increase in the subsidy for oil exploration and drilling
C) A decrease in the world price of oil
D) An increase in the costs of exploration and drilling for oil
A) A decrease in the fees that oil companies must pay for drilling licenses
B) An increase in the subsidy for oil exploration and drilling
C) A decrease in the world price of oil
D) An increase in the costs of exploration and drilling for oil
Unlock Deck
Unlock for access to all 202 flashcards in this deck.
Unlock Deck
k this deck
50
Which would cause an increase in the supply curve of cell-phone services?
A) A decrease in the wages of phone-company workers
B) An increase in the price of cell-phone services
C) An increase in the taxes paid by cell-phone service providers
D) A decrease in a subsidy given to cell-phone service providers
A) A decrease in the wages of phone-company workers
B) An increase in the price of cell-phone services
C) An increase in the taxes paid by cell-phone service providers
D) A decrease in a subsidy given to cell-phone service providers
Unlock Deck
Unlock for access to all 202 flashcards in this deck.
Unlock Deck
k this deck
51
All of the following would affect the position of the supply curve for cranberries, except the:
A) Popularity of cranberry drinks
B) Price of agricultural land for cranberries
C) Cost of fertilizers for cranberry production
D) Development of a new pest control for cranberries
A) Popularity of cranberry drinks
B) Price of agricultural land for cranberries
C) Cost of fertilizers for cranberry production
D) Development of a new pest control for cranberries
Unlock Deck
Unlock for access to all 202 flashcards in this deck.
Unlock Deck
k this deck
52
Plastics manufacturers can make either toys or plastic containers. If the prices and profitability of plastic toys increase, then the:
A) Demand for plastic containers will decrease
B) Supply of plastic containers will increase
C) Demand for plastic containers will increase
D) Supply of plastic containers will decrease
A) Demand for plastic containers will decrease
B) Supply of plastic containers will increase
C) Demand for plastic containers will increase
D) Supply of plastic containers will decrease
Unlock Deck
Unlock for access to all 202 flashcards in this deck.
Unlock Deck
k this deck
53
If the price of Pepsi decreases, other factors constant, then we'd expect to see a consequent shift of the demand curve for:
A) Coke to the left
B) Coke to the right
C) Pepsi to the left
D) Pepsi to the right
A) Coke to the left
B) Coke to the right
C) Pepsi to the left
D) Pepsi to the right
Unlock Deck
Unlock for access to all 202 flashcards in this deck.
Unlock Deck
k this deck
54
Which of the following will not cause the supply curve to shift?
A) A change in the costs of resources needed to produce the good
B) A technological change in the production of the good
C) A change in the price of the good
D) A change in the prices of other goods that producers could be producing
A) A change in the costs of resources needed to produce the good
B) A technological change in the production of the good
C) A change in the price of the good
D) A change in the prices of other goods that producers could be producing
Unlock Deck
Unlock for access to all 202 flashcards in this deck.
Unlock Deck
k this deck
55
Suppose that a more efficient way to produce a good is discovered, thus lowering production costs for the good. This will cause a(n):
A) Increase in supply
B) Decrease in supply
C) Increase in quantity supplied
D) Decrease in quantity supplied
A) Increase in supply
B) Decrease in supply
C) Increase in quantity supplied
D) Decrease in quantity supplied
Unlock Deck
Unlock for access to all 202 flashcards in this deck.
Unlock Deck
k this deck
56
An "increase in the quantity supplied" suggests a:
A) Rightward shift of the supply curve
B) Movement down along the supply curve
C) Movement up along the supply curve
D) Leftward shift of the supply curve
A) Rightward shift of the supply curve
B) Movement down along the supply curve
C) Movement up along the supply curve
D) Leftward shift of the supply curve
Unlock Deck
Unlock for access to all 202 flashcards in this deck.
Unlock Deck
k this deck
57
Which of the following is a determinant of supply?
A) Tastes and preferences
B) Price of a complementary good
C) Consumer income
D) Product taxes and subsidies
A) Tastes and preferences
B) Price of a complementary good
C) Consumer income
D) Product taxes and subsidies
Unlock Deck
Unlock for access to all 202 flashcards in this deck.
Unlock Deck
k this deck
58
"Price" in the statement of the Law of Supply refers to:
A) The amount that buyers are willing and able to pay for each unit of the product
B) The cost of producing each unit of the product
C) The total revenues that sellers receives for selling a given quantity of the product
D) The total amount that buyers pay in order to acquire a given quantity of the product
Unlock Deck
Unlock for access to all 202 flashcards in this deck.
Unlock Deck
k this deck
59
All of the following are assumed to be constant when the supply curve for a product is drawn, except the:
A) Price of the product
B) State of technology
C) Number of producers
D) Price of inputs used to make the product
A) Price of the product
B) State of technology
C) Number of producers
D) Price of inputs used to make the product
Unlock Deck
Unlock for access to all 202 flashcards in this deck.
Unlock Deck
k this deck
60
In order to derive the market supply curve from individual supply curves, we add up the:
A) Various prices that individual sellers are charging for the product
B) Various quantities that individual sellers want to sell at specific price levels
C) Total number of sellers in the market at a given time
D) Costs that all individual sellers incur in producing the product
A) Various prices that individual sellers are charging for the product
B) Various quantities that individual sellers want to sell at specific price levels
C) Total number of sellers in the market at a given time
D) Costs that all individual sellers incur in producing the product
Unlock Deck
Unlock for access to all 202 flashcards in this deck.
Unlock Deck
k this deck
61
Refer to the above diagram for the milk market. In this market, the equilibrium price is ____ and equilibrium quantity is ___.A) $1.50 per gallon; 28 million gallons
B) $1.50 per gallon; 30 million gallons
C) $28 per gallon; 150 million gallons
D) $1.00 per gallon; 35 million gallons
Unlock Deck
Unlock for access to all 202 flashcards in this deck.
Unlock Deck
k this deck
62
Refer to the above diagram of the market for corn. If the price in this market is at $4 per bushel, then there will be a:A) Surplus and the price will tend to rise
B) Shortage and the price will tend to rise
C) Surplus and the price will tend to fall
D) Shortage and the price will tend to fall
Unlock Deck
Unlock for access to all 202 flashcards in this deck.
Unlock Deck
k this deck
63
There is a surplus of tomatoes in the market. This implies that:
A) The current price is set above the equilibrium level
B) The price will be rising, as a result
C) Supply of tomatoes is more than the demand
D) Quantity demanded is more than quantity supplied
A) The current price is set above the equilibrium level
B) The price will be rising, as a result
C) Supply of tomatoes is more than the demand
D) Quantity demanded is more than quantity supplied
Unlock Deck
Unlock for access to all 202 flashcards in this deck.
Unlock Deck
k this deck
64
Refer to the above table. At a price of $15 per unit, which of the following would exist?A) A shortage of 1,600 units
B) A surplus of 1,000 units
C) A shortage of 1,000 units
D) A surplus of 600 units
Unlock Deck
Unlock for access to all 202 flashcards in this deck.
Unlock Deck
k this deck
65
Refer to the above graph. An increase in price, other factors constant, would cause a change from:A) Point 5 to point 1
B) Point 4 to point 5
C) Point 1 to point 6
D) Point 3 to point 4
Unlock Deck
Unlock for access to all 202 flashcards in this deck.
Unlock Deck
k this deck
66
Refer to the above diagram for the milk market. If the price were $2 per gallon, then there would be a:A) Shortage of 20 million gallons
B) Shortage of 10 million gallons
C) Surplus of 10 million gallons
D) Surplus of 30 million gallons
Unlock Deck
Unlock for access to all 202 flashcards in this deck.
Unlock Deck
k this deck
67
There is a shortage in a market for a product when:
A) The current price is higher than the equilibrium price
B) Supply is less than demand
C) Quantity demanded is less than quantity supplied
D) Quantity demanded is greater than quantity supplied
A) The current price is higher than the equilibrium price
B) Supply is less than demand
C) Quantity demanded is less than quantity supplied
D) Quantity demanded is greater than quantity supplied
Unlock Deck
Unlock for access to all 202 flashcards in this deck.
Unlock Deck
k this deck
68
In competitive markets, a surplus or shortage will:
A) Never exist because the markets are always at equilibrium
B) Cause changes in the quantities demanded and supplied that tend to eliminate the surplus or shortage
C) Cause shifts in the demand and supply curves that tend to eliminate the surplus or shortage
D) Cause changes in the quantities demanded and supplied that tend to intensify the surplus or shortage
Unlock Deck
Unlock for access to all 202 flashcards in this deck.
Unlock Deck
k this deck
69
Refer to the above diagram for the milk market. There would be a shortage of milk whenever the price is:A) Higher than $1.50 per gallon
B) Higher than $2.00 per gallon
C) Lower than $1.50 per gallon
D) Lower than $2.00 per gallon
Unlock Deck
Unlock for access to all 202 flashcards in this deck.
Unlock Deck
k this deck
70
Picture a competitive market with the usual upsloping supply curve and downsloping demand curve. If the current price is creating a shortage, then market forces will cause the price to adjust and:
A) Quantity supplied will increase
B) Quantity supplied will decrease
C) Quantity demanded will increase
D) Demand will decrease
A) Quantity supplied will increase
B) Quantity supplied will decrease
C) Quantity demanded will increase
D) Demand will decrease
Unlock Deck
Unlock for access to all 202 flashcards in this deck.
Unlock Deck
k this deck
71
Refer to the above table. In this competitive market, the price and quantity will settle at:A) $10 and 2,000 units
B) $15 and 1,600 units
C) $20 and 900 units
D) $25 and 1,200 units
Unlock Deck
Unlock for access to all 202 flashcards in this deck.
Unlock Deck
k this deck
72
If there was initially a shortage in the market for a product, then:
A) Sellers will drive the price down
B) Sellers will drive the price up
C) Buyers will drive the price down
D) Buyers will drive the price up
A) Sellers will drive the price down
B) Sellers will drive the price up
C) Buyers will drive the price down
D) Buyers will drive the price up
Unlock Deck
Unlock for access to all 202 flashcards in this deck.
Unlock Deck
k this deck
73
If the market price is above the equilibrium price:
A) A shortage will occur and producers will produce more and lower prices
B) A surplus will occur and producers will produce less and lower prices
C) A surplus will result and consumers will bid prices up
D) Producers will make extremely high profits
A) A shortage will occur and producers will produce more and lower prices
B) A surplus will occur and producers will produce less and lower prices
C) A surplus will result and consumers will bid prices up
D) Producers will make extremely high profits
Unlock Deck
Unlock for access to all 202 flashcards in this deck.
Unlock Deck
k this deck
74
Refer to the above diagram illustrating the market for corn. If the price in this market is fixed at $2 per bushel, then:A) Sellers will not be able to sell all the corn that they intended to sell
B) Sellers will quickly run out of corn that they bring to market
C) Buyers will find too much corn in the market
D) Buyers will be able to get as much corn as they wish to buy
Unlock Deck
Unlock for access to all 202 flashcards in this deck.
Unlock Deck
k this deck
75
Refer to the above diagram of the market for corn. There will be a surplus of 8 thousand bushels at the price of:A) $4/bushel
B) $3/bushel
C) $2/bushel
D) $5/bushel
Unlock Deck
Unlock for access to all 202 flashcards in this deck.
Unlock Deck
k this deck
76
Refer to the above graph. A decrease in supply would best be reflected by a change from:A) Point 2 to point 1
B) Point 5 to point 1
C) Point 5 to point 2
D) Point 3 to point 6
Unlock Deck
Unlock for access to all 202 flashcards in this deck.
Unlock Deck
k this deck
77
Refer to the above table. A surplus of 500 units will occur when the price is:A) $10 per unit
B) $15 per unit
C) $20 per unit
D) $30 per unit
Unlock Deck
Unlock for access to all 202 flashcards in this deck.
Unlock Deck
k this deck
78
A market for a product reaches equilibrium when:
A) The actual quantity bought by buyers equals actual quantity sold by sellers
B) The price rises further after there is a surplus
C) Buyers intend to buy a quantity equal to the quantity that sellers intend to sell
D) Price falls further after there is a shortage
A) The actual quantity bought by buyers equals actual quantity sold by sellers
B) The price rises further after there is a surplus
C) Buyers intend to buy a quantity equal to the quantity that sellers intend to sell
D) Price falls further after there is a shortage
Unlock Deck
Unlock for access to all 202 flashcards in this deck.
Unlock Deck
k this deck
79
The market system automatically corrects a surplus condition in a competitive market by:
A) Raising the price of the commodity in question while increasing the quantity demanded
B) Raising the price of the commodity in question while decreasing the quantity demanded
C) Reducing the price of the commodity in question while increasing the quantity demanded
D) Reducing the price of the commodity in question while decreasing the quantity demanded
Unlock Deck
Unlock for access to all 202 flashcards in this deck.
Unlock Deck
k this deck
80
Last year the price of corn was $3 a bushel and the quantity of corn demanded was 10 million bushels. This year the price of corn was $4.00 a bushel and the quantity demanded was 9 million bushels. Is this evidence that law of demand does not apply to corn?
A) Yes, because there is a direct relationship between the price of corn and the quantity supplied
B) Yes, because there is an inverse relationship between the price of corn and the quantity demanded
C) No, because the other-things-equal assumption was violated over the two year period
D) No, because the evidence indicates that there is a shortage of corn
Unlock Deck
Unlock for access to all 202 flashcards in this deck.
Unlock Deck
k this deck
Unlock Deck
Unlock for access to all 202 flashcards in this deck.


