Deck 30: Income, Poverty, and Health Care
Full screen (f)
Question
Question
Question
Question
Question
Question
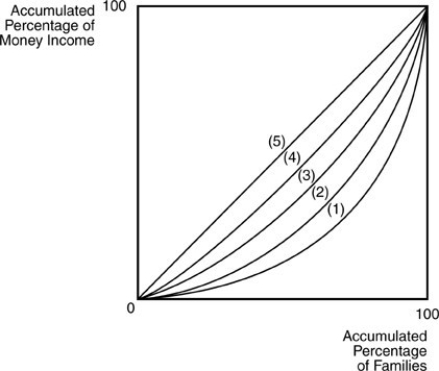
The most unequal distribution of income in the above figure exists in
A) country 4.
B) country 1.
C) country 5.
D) country 3.
Question
Question
Question
Question
Question
Question
Question
Question
Question
Question
Question
Question
Question
Question
Question
Question
Question
Question
Question
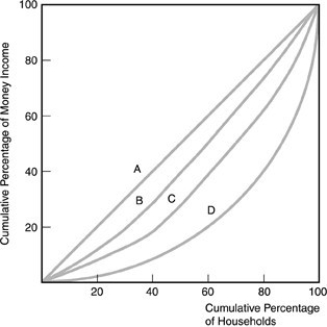
Refer to the above figure. Where are the poorest households represented on the graph?
A) The poorest households are to the left along the horizontal axis.
B) The poorest households are to the right along the horizontal axis.
C) The poorest households are all along the horizontal axis.
D) The poorest households are concentrated in the middle.
Question
Refer to the above figure. Which curve shows the most unequal distribution of income?
A) A
B) B
C) C
D) D
Question
Question
Question
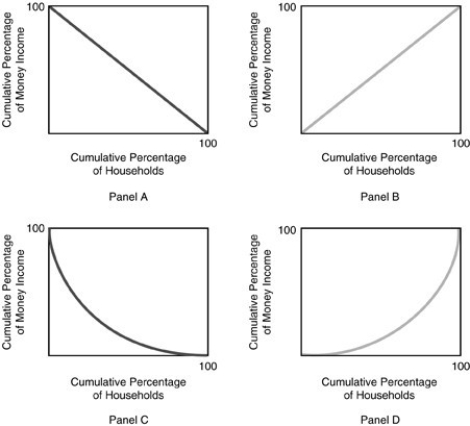
Refer to the above figure. Which of the above panels represents complete income equality?
A) Panel A
B) Panel B
C) Panel C
D) Panel D
Question
Question
Question
Question
Refer to the above figure. For which Lorenz curve does the richest 25 percent make 50 percent of the nation's money income?
A) A
B) B
C) C
D) D
Question
Refer to the above figure. Perfect income equality is shown by
A) the horizontal axis.
B) the vertical axis.
C) curve A.
D) curve D.
Question
Question
The above figure displays
A) income-inequality curves.
B) Gini Coefficients.
C) Lorenz curves.
D) Laffer curves.
Question
Question
Refer to the above figure. Which curve shows the second most unequal distribution of income?
A) A
B) B
C) C
D) D
Question
Refer to the above figure. For which Lorenz curve does the richest 40 percent make 50 percent of the nation's money income?
A) A
B) B
C) C
D) D
Question
Question
Question
Question
Question
Each of the curves plotted in the graph shown in the above figure is known as a
A) Laffer curve.
B) Phillips curve.
C) Keynesian curve.
D) Lorenz curve.
Question
Question
Question
Question
Question
Question
Question
Question
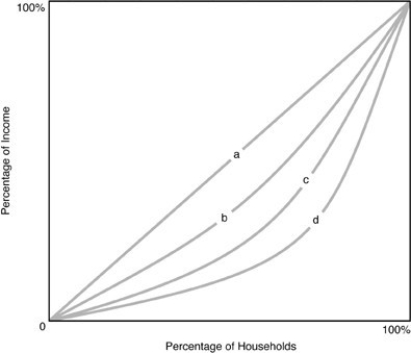
In the above figure, the curve that represents the second most income equality is
A) a.
B) b.
C) c.
D) d.
Question
In the above figure, the curve that represents the most income inequality is
A) a.
B) b.
C) c.
D) d.
Question
Refer to the above figure. Which of the above graphs represents an unequal income distribution?
A) Panel A
B) Panel B
C) Panel C
D) Panel D
Question
Question
Question
In the above figure, the curve that represents the most income equality is
A) a.
B) b.
C) c.
D) d.
Question
Question
Question
Question
Question
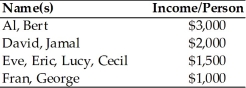
Use the information in the above table. If Income was evenly distributed, each person would receive
A) $9,000.
B) $2,500.
C) $1,800.
D) $1,000.
Question
Question
Question
Question
Question
Question
Question
Use the above table. What percentage of income is received by the poorest 20% of the population?
A) 20 percent
B) 13.3 percent
C) 11.1 percent
D) 7.0 percent
Question
Question
Use the above table. What percentage of income is received by the richest 20% of the population?
A) 33.33 percent
B) 16.67 percent
C) 11.11 percent
D) 40.00 percent
Question
Use the above table. What percentage of income is received by the poorest 60% of the population?
A) 27.78 percent
B) 33.33 percent
C) 44.44 percent
D) 55.56 percent
Question
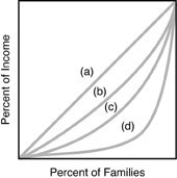
Use the above figure. Refer to the above diagram where curves (a) through (d) are for four different countries. Income is most unequally distributed in
A) Country A.
B) Country B.
C) Country C.
D) Country D.
Question
Question
Question
Question
Use the above figure. Refer to the above diagram where curves (a) through (d) are for four different countries. Income is third most unequally distributed in
A) Country A.
B) Country B.
C) Country C.
D) Country D.
Question
Use the information in the above table. The top 40 percent of the population earn
A) 66.7 percent of the income.
B) 55.5 percent of the income.
C) 50.0 percent of the income.
D) 44.4 percent of the income.
Question
Use the above figure. Refer to the above diagram where curves (a) through (d) are for four different countries. Income is equally distributed in
A) Country A.
B) Country B.
C) Country C.
D) Country D.
Question

Unlock Deck
Sign up to unlock the cards in this deck!
Unlock Deck
Unlock Deck
1/304
Play
Full screen (f)
Deck 30: Income, Poverty, and Health Care
1
The graph which represents the distribution of income in an economy is called the
A) Laffer curve.
B) Lorenz curve.
C) distribution curve.
D) aggregate demand curve.
A) Laffer curve.
B) Lorenz curve.
C) distribution curve.
D) aggregate demand curve.
B
2
The Lorenz curve is a geometric representation of
A) the profile of earnings for a "typical" family over time.
B) the standard of living experienced by the poor in a country.
C) the difference between pre-tax and post-tax income.
D) the distribution of income.
A) the profile of earnings for a "typical" family over time.
B) the standard of living experienced by the poor in a country.
C) the difference between pre-tax and post-tax income.
D) the distribution of income.
D
3
In a Lorenz curve, perfect income equality is represented by
A) a vertical line.
B) a horizontal line.
C) a rectangular hyperbola.
D) a 45-degree line originating from the origin.
A) a vertical line.
B) a horizontal line.
C) a rectangular hyperbola.
D) a 45-degree line originating from the origin.
D
4
According to the text, the highest 20 percent of U.S. income households earn about what percentage of total income today?
A) 10 percent
B) 20 percent
C) 50 percent
D) 95 percent
A) 10 percent
B) 20 percent
C) 50 percent
D) 95 percent
Unlock Deck
Unlock for access to all 304 flashcards in this deck.
Unlock Deck
k this deck
5
Which of the following would be considered income in kind?
A) tax refunds
B) food stamps
C) yard sales
D) reduction in the tax rates
A) tax refunds
B) food stamps
C) yard sales
D) reduction in the tax rates
Unlock Deck
Unlock for access to all 304 flashcards in this deck.
Unlock Deck
k this deck
6
The most unequal distribution of income in the above figure exists in
A) country 4.
B) country 1.
C) country 5.
D) country 3.
Unlock Deck
Unlock for access to all 304 flashcards in this deck.
Unlock Deck
k this deck
7
The more bowed the Lorenz curve, the
A) richer the society.
B) more unequal the distribution of money income.
C) poorer the society.
D) more equal the distribution of income.
A) richer the society.
B) more unequal the distribution of money income.
C) poorer the society.
D) more equal the distribution of income.
Unlock Deck
Unlock for access to all 304 flashcards in this deck.
Unlock Deck
k this deck
8
The country reflecting perfect income equality in the above figure is
A) country 4.
B) country 1.
C) country 5.
D) country 3.
A) country 4.
B) country 1.
C) country 5.
D) country 3.
Unlock Deck
Unlock for access to all 304 flashcards in this deck.
Unlock Deck
k this deck
9
The more bowed (skewed) the Lorenz curve
A) the more equal the distribution of income.
B) the greater the number of households in the society.
C) the more unequal the distribution of money income.
D) the greater the total income of the society.
A) the more equal the distribution of income.
B) the greater the number of households in the society.
C) the more unequal the distribution of money income.
D) the greater the total income of the society.
Unlock Deck
Unlock for access to all 304 flashcards in this deck.
Unlock Deck
k this deck
10
The Lorenz curve shows what portion of total money income is accounted for by
A) different proportions of a country's households.
B) only the wealthiest citizens.
C) only poor people.
D) taxpaying citizens only.
A) different proportions of a country's households.
B) only the wealthiest citizens.
C) only poor people.
D) taxpaying citizens only.
Unlock Deck
Unlock for access to all 304 flashcards in this deck.
Unlock Deck
k this deck
11
One reason some economists are critical of the Lorenz curve is because
A) it reflects income before taxes.
B) it reflects income after taxes.
C) it reflects only the top bracket of taxpayers.
D) it reflects only the poor in the country.
A) it reflects income before taxes.
B) it reflects income after taxes.
C) it reflects only the top bracket of taxpayers.
D) it reflects only the poor in the country.
Unlock Deck
Unlock for access to all 304 flashcards in this deck.
Unlock Deck
k this deck
12
In calculating income for the Lorenz curve, one factor that is omitted, is
A) capital gains income.
B) dividend payments.
C) in-kind transfer payments from the government.
D) pure economic rent.
A) capital gains income.
B) dividend payments.
C) in-kind transfer payments from the government.
D) pure economic rent.
Unlock Deck
Unlock for access to all 304 flashcards in this deck.
Unlock Deck
k this deck
13
The more bowed out the Lorenz curve, the
A) less equal the income distribution.
B) more equal the income distribution.
C) greater the overall wealth in the economy.
D) less the overall wealth in the economy.
A) less equal the income distribution.
B) more equal the income distribution.
C) greater the overall wealth in the economy.
D) less the overall wealth in the economy.
Unlock Deck
Unlock for access to all 304 flashcards in this deck.
Unlock Deck
k this deck
14
According to the text, today's Lorenz curve is
A) a straight line.
B) a vertical line.
C) more bowed than in 1929.
D) less bowed than in 1929.
A) a straight line.
B) a vertical line.
C) more bowed than in 1929.
D) less bowed than in 1929.
Unlock Deck
Unlock for access to all 304 flashcards in this deck.
Unlock Deck
k this deck
15
The Lorenz curve shows
A) the demand for jobs.
B) the supply of jobs.
C) the elasticity of jobs.
D) the distribution of income.
A) the demand for jobs.
B) the supply of jobs.
C) the elasticity of jobs.
D) the distribution of income.
Unlock Deck
Unlock for access to all 304 flashcards in this deck.
Unlock Deck
k this deck
16
Which of the following is NOT a correct criticism of the Lorenz curve?
A) It does not include payments in kind.
B) It does not deal with differences in family size.
C) It ignores the impact of age distribution on income distribution.
D) It refers to money income after taxes.
A) It does not include payments in kind.
B) It does not deal with differences in family size.
C) It ignores the impact of age distribution on income distribution.
D) It refers to money income after taxes.
Unlock Deck
Unlock for access to all 304 flashcards in this deck.
Unlock Deck
k this deck
17
A straight-line Lorenz curve shows
A) an equal distribution of money income.
B) a greater than proportionate share of income going to middle-income households.
C) a high incidence of absolute poverty.
D) a highly unequal distribution of income.
A) an equal distribution of money income.
B) a greater than proportionate share of income going to middle-income households.
C) a high incidence of absolute poverty.
D) a highly unequal distribution of income.
Unlock Deck
Unlock for access to all 304 flashcards in this deck.
Unlock Deck
k this deck
18
The less bowed the Lorenz Curve, the
A) more equal the income distribution.
B) less equal the income distribution.
C) greater the number of low-income people.
D) greater the number of high-income people.
A) more equal the income distribution.
B) less equal the income distribution.
C) greater the number of low-income people.
D) greater the number of high-income people.
Unlock Deck
Unlock for access to all 304 flashcards in this deck.
Unlock Deck
k this deck
19
Suppose 10 percent of the families receive 10 percent of the income, 20 percent of the families receive 20 percent of the income, and so forth. The Lorenz curve would be
A) a straight line at a 45-degree angle from the origin.
B) a straight line at a 30-degree angle from the origin.
C) the most bowed curve possible.
D) the horizontal axis.
A) a straight line at a 45-degree angle from the origin.
B) a straight line at a 30-degree angle from the origin.
C) the most bowed curve possible.
D) the horizontal axis.
Unlock Deck
Unlock for access to all 304 flashcards in this deck.
Unlock Deck
k this deck
20
The distribution of income in one nation can be illustrated by the
A) Laffer curve.
B) aggregate demand curve.
C) Lorenz curve.
D) Phillips curve.
A) Laffer curve.
B) aggregate demand curve.
C) Lorenz curve.
D) Phillips curve.
Unlock Deck
Unlock for access to all 304 flashcards in this deck.
Unlock Deck
k this deck
21
The way income is allocated among the population is called the
A) income curve.
B) income spread.
C) distribution of income.
D) Gini allocation.
A) income curve.
B) income spread.
C) distribution of income.
D) Gini allocation.
Unlock Deck
Unlock for access to all 304 flashcards in this deck.
Unlock Deck
k this deck
22
If everyone earned the same income, the Lorenz curve would be
A) a rectangular hyperbola.
B) a straight line from the origin at a 45-degree angle.
C) the horizontal axis.
D) very bowed from the diagonal.
A) a rectangular hyperbola.
B) a straight line from the origin at a 45-degree angle.
C) the horizontal axis.
D) very bowed from the diagonal.
Unlock Deck
Unlock for access to all 304 flashcards in this deck.
Unlock Deck
k this deck
23
Some economists criticize the Lorenz curve because it
A) accounts for differences in the size of households when it should not.
B) does not include the cumulative percentage of households.
C) does not include unreported income earned in the underground economy.
D) represents the inequality of lifetime income when it should just look at a specific time period.
Unlock Deck
Unlock for access to all 304 flashcards in this deck.
Unlock Deck
k this deck
24
A Lorenz curve that represents an unequal income distribution is
A) a straight line starting at the origin.
B) a straight line starting at 100%
C) a bowed curved.
D) a line that has a kink in the middle of it.
A) a straight line starting at the origin.
B) a straight line starting at 100%
C) a bowed curved.
D) a line that has a kink in the middle of it.
Unlock Deck
Unlock for access to all 304 flashcards in this deck.
Unlock Deck
k this deck
25
Refer to the above figure. Where are the poorest households represented on the graph?
A) The poorest households are to the left along the horizontal axis.
B) The poorest households are to the right along the horizontal axis.
C) The poorest households are all along the horizontal axis.
D) The poorest households are concentrated in the middle.
Unlock Deck
Unlock for access to all 304 flashcards in this deck.
Unlock Deck
k this deck
26
Refer to the above figure. Which curve shows the most unequal distribution of income?
A) A
B) B
C) C
D) D
Unlock Deck
Unlock for access to all 304 flashcards in this deck.
Unlock Deck
k this deck
27
Which of the following is the best definition of what economists define as total income?
A) payment for labor services
B) payment for labor services and for ownership of other factors of production
C) payment for labor services, for use of other factors of production, and gifts and government transfers
D) inheritance
A) payment for labor services
B) payment for labor services and for ownership of other factors of production
C) payment for labor services, for use of other factors of production, and gifts and government transfers
D) inheritance
Unlock Deck
Unlock for access to all 304 flashcards in this deck.
Unlock Deck
k this deck
28
The more bowed out the Lorenz curve is, the
A) more equal the distribution of income.
B) less equal the distribution of income.
C) richer the society.
D) poorer the society.
A) more equal the distribution of income.
B) less equal the distribution of income.
C) richer the society.
D) poorer the society.
Unlock Deck
Unlock for access to all 304 flashcards in this deck.
Unlock Deck
k this deck
29
Refer to the above figure. Which of the above panels represents complete income equality?
A) Panel A
B) Panel B
C) Panel C
D) Panel D
Unlock Deck
Unlock for access to all 304 flashcards in this deck.
Unlock Deck
k this deck
30
When examining the financial status of households, wealth is
A) synonymous with income.
B) a flow variable whereas income is a stock variable.
C) a stock variable and includes both tangible assets and human capital.
D) not as important as income because wealth does not change over time.
A) synonymous with income.
B) a flow variable whereas income is a stock variable.
C) a stock variable and includes both tangible assets and human capital.
D) not as important as income because wealth does not change over time.
Unlock Deck
Unlock for access to all 304 flashcards in this deck.
Unlock Deck
k this deck
31
The Lorenz curve
A) shows what portion of the population are living in poverty and what portion are living in wealth.
B) shows what portion of total money income is accounted for by different proportions of the nation's households.
C) shows what portion of the population is working as professionals, white- and blue-collar, workers and workers at menial tasks.
D) breaks down the income levels of each group in the economy.
Unlock Deck
Unlock for access to all 304 flashcards in this deck.
Unlock Deck
k this deck
32
Since World War II, the share of total income going to the bottom 20 percent of U.S. households has
A) fallen by 20 percent.
B) increased by 10 percent.
C) remained constant.
D) more than doubled.
A) fallen by 20 percent.
B) increased by 10 percent.
C) remained constant.
D) more than doubled.
Unlock Deck
Unlock for access to all 304 flashcards in this deck.
Unlock Deck
k this deck
33
Refer to the above figure. For which Lorenz curve does the richest 25 percent make 50 percent of the nation's money income?
A) A
B) B
C) C
D) D
Unlock Deck
Unlock for access to all 304 flashcards in this deck.
Unlock Deck
k this deck
34
Refer to the above figure. Perfect income equality is shown by
A) the horizontal axis.
B) the vertical axis.
C) curve A.
D) curve D.
Unlock Deck
Unlock for access to all 304 flashcards in this deck.
Unlock Deck
k this deck
35
A Lorenz curve that is perfectly straight indicates
A) that society is very rich.
B) that a small portion of the population accounts for most of the income.
C) that a large portion of the population accounts for most of the income.
D) complete income equality.
A) that society is very rich.
B) that a small portion of the population accounts for most of the income.
C) that a large portion of the population accounts for most of the income.
D) complete income equality.
Unlock Deck
Unlock for access to all 304 flashcards in this deck.
Unlock Deck
k this deck
36
The above figure displays
A) income-inequality curves.
B) Gini Coefficients.
C) Lorenz curves.
D) Laffer curves.
Unlock Deck
Unlock for access to all 304 flashcards in this deck.
Unlock Deck
k this deck
37
Compared to a sampling of other developed nations, the U.S. income distribution is more unequal than many others. What accounts for this?
A) The lowest-income families in the United States earn much less than the lowest-income households in other nations.
B) Marginal income tax rates are much higher in the United States than in any other nation.
C) The highest-income families in the United States earn much more than the highest-income households in other nations.
D) Other nations manipulate their data to look better.
Unlock Deck
Unlock for access to all 304 flashcards in this deck.
Unlock Deck
k this deck
38
Refer to the above figure. Which curve shows the second most unequal distribution of income?
A) A
B) B
C) C
D) D
Unlock Deck
Unlock for access to all 304 flashcards in this deck.
Unlock Deck
k this deck
39
Refer to the above figure. For which Lorenz curve does the richest 40 percent make 50 percent of the nation's money income?
A) A
B) B
C) C
D) D
Unlock Deck
Unlock for access to all 304 flashcards in this deck.
Unlock Deck
k this deck
40
Some economists criticize the Lorenz curve because it
A) includes too many things in measuring income, such as food stamps, housing aid, and other government programs.
B) does not account for the effect of age on a family's income.
C) measures unreported income earned in the underground economy.
D) uses after-tax income when pre-tax income is more appropriate.
Unlock Deck
Unlock for access to all 304 flashcards in this deck.
Unlock Deck
k this deck
41
Which of the following statements is TRUE about income and wealth?
A) Income is a flow measure and wealth is a stock measure.
B) Income is a stock measure and wealth is a flow measure.
C) Both income and wealth are flow measures.
D) Both income and wealth are stock measures.
A) Income is a flow measure and wealth is a stock measure.
B) Income is a stock measure and wealth is a flow measure.
C) Both income and wealth are flow measures.
D) Both income and wealth are stock measures.
Unlock Deck
Unlock for access to all 304 flashcards in this deck.
Unlock Deck
k this deck
42
Income in the form of goods and services is
A) known as money income.
B) known as income in kind.
C) not considered income by economists.
D) not part of wealth.
A) known as money income.
B) known as income in kind.
C) not considered income by economists.
D) not part of wealth.
Unlock Deck
Unlock for access to all 304 flashcards in this deck.
Unlock Deck
k this deck
43
Changes in the Lorenz curve since 1929 in the United States indicate that
A) the distribution of income today is identical to what it was in 1929.
B) the distribution of income is slightly less equal today than in 1929.
C) the distribution of income is slightly more equal today than in 1929.
D) the distribution of income is much more equal today than it was in 1929.
A) the distribution of income today is identical to what it was in 1929.
B) the distribution of income is slightly less equal today than in 1929.
C) the distribution of income is slightly more equal today than in 1929.
D) the distribution of income is much more equal today than it was in 1929.
Unlock Deck
Unlock for access to all 304 flashcards in this deck.
Unlock Deck
k this deck
44
Each of the curves plotted in the graph shown in the above figure is known as a
A) Laffer curve.
B) Phillips curve.
C) Keynesian curve.
D) Lorenz curve.
Unlock Deck
Unlock for access to all 304 flashcards in this deck.
Unlock Deck
k this deck
45
Income in kind is defined as
A) income received in the form of a paycheck.
B) payment for services in the form of cash.
C) tips.
D) income received in the form of goods and services.
A) income received in the form of a paycheck.
B) payment for services in the form of cash.
C) tips.
D) income received in the form of goods and services.
Unlock Deck
Unlock for access to all 304 flashcards in this deck.
Unlock Deck
k this deck
46
All of the following are income in kind EXCEPT
A) income received from family members.
B) services produced in the home.
C) government provided food stamps.
D) government provided medical aid.
A) income received from family members.
B) services produced in the home.
C) government provided food stamps.
D) government provided medical aid.
Unlock Deck
Unlock for access to all 304 flashcards in this deck.
Unlock Deck
k this deck
47
All of the following are income in kind EXCEPT
A) government provided housing.
B) government provided education.
C) tips received by a waitress.
D) goods produced in the home.
A) government provided housing.
B) government provided education.
C) tips received by a waitress.
D) goods produced in the home.
Unlock Deck
Unlock for access to all 304 flashcards in this deck.
Unlock Deck
k this deck
48
Compared to the distribution of money income, the distribution of wealth is
A) about the same.
B) much more equal.
C) much less equal.
D) a little more equal.
A) about the same.
B) much more equal.
C) much less equal.
D) a little more equal.
Unlock Deck
Unlock for access to all 304 flashcards in this deck.
Unlock Deck
k this deck
49
Which of the following is NOT a true statement about the Lorenz curve?
A) The Lorenz curve includes both money income and income in kind.
B) The Lorenz curve does not include unreported income obtained from the underground economy.
C) The Lorenz curve does not consider different sizes of households.
D) The Lorenz curve does not consider age differences among wage earners.
Unlock Deck
Unlock for access to all 304 flashcards in this deck.
Unlock Deck
k this deck
50
The return on wealth is
A) a stock variable.
B) income.
C) equal to the opportunity cost of holding capital.
D) a stock or flow variable depending upon whether the wealth is in the form of bonds or other financial assets.
A) a stock variable.
B) income.
C) equal to the opportunity cost of holding capital.
D) a stock or flow variable depending upon whether the wealth is in the form of bonds or other financial assets.
Unlock Deck
Unlock for access to all 304 flashcards in this deck.
Unlock Deck
k this deck
51
When comparing the distribution of wealth to the distribution of income, it can be noted that
A) the distributions are about the same.
B) the measurement of income is much less accurate than the measurement of wealth.
C) the measurement of wealth is much less accurate than the measurement of income.
D) wealth does not generate income.
A) the distributions are about the same.
B) the measurement of income is much less accurate than the measurement of wealth.
C) the measurement of wealth is much less accurate than the measurement of income.
D) wealth does not generate income.
Unlock Deck
Unlock for access to all 304 flashcards in this deck.
Unlock Deck
k this deck
52
In the above figure, the curve that represents the second most income equality is
A) a.
B) b.
C) c.
D) d.
Unlock Deck
Unlock for access to all 304 flashcards in this deck.
Unlock Deck
k this deck
53
In the above figure, the curve that represents the most income inequality is
A) a.
B) b.
C) c.
D) d.
Unlock Deck
Unlock for access to all 304 flashcards in this deck.
Unlock Deck
k this deck
54
Refer to the above figure. Which of the above graphs represents an unequal income distribution?
A) Panel A
B) Panel B
C) Panel C
D) Panel D
Unlock Deck
Unlock for access to all 304 flashcards in this deck.
Unlock Deck
k this deck
55
All of the following are criticisms of the Lorenz curve EXCEPT
A) The Lorenz curve does not include in-kind transfers.
B) The Lorenz curve does not account for age differences.
C) The Lorenz curve does not account for differences in the sizes of families.
D) The Lorenz curve does not account for differences in education levels.
A) The Lorenz curve does not include in-kind transfers.
B) The Lorenz curve does not account for age differences.
C) The Lorenz curve does not account for differences in the sizes of families.
D) The Lorenz curve does not account for differences in education levels.
Unlock Deck
Unlock for access to all 304 flashcards in this deck.
Unlock Deck
k this deck
56
All of the following would show a more equal distribution than the distribution of money income EXCEPT
A) total income.
B) after-tax income.
C) wealth.
D) lifetime earnings.
A) total income.
B) after-tax income.
C) wealth.
D) lifetime earnings.
Unlock Deck
Unlock for access to all 304 flashcards in this deck.
Unlock Deck
k this deck
57
In the above figure, the curve that represents the most income equality is
A) a.
B) b.
C) c.
D) d.
Unlock Deck
Unlock for access to all 304 flashcards in this deck.
Unlock Deck
k this deck
58
Wealth is measured as
A) only tangible objects.
B) only buildings, machinery, land, cars, stocks and bonds.
C) only nonhuman wealth.
D) nonhuman and human wealth.
A) only tangible objects.
B) only buildings, machinery, land, cars, stocks and bonds.
C) only nonhuman wealth.
D) nonhuman and human wealth.
Unlock Deck
Unlock for access to all 304 flashcards in this deck.
Unlock Deck
k this deck
59
The richest 10 percent of U.S. houses hold more than two-thirds of all wealth. The problem with this statement is that
A) it does not consider an individual's current income.
B) it does not consider private and public pension plans.
C) it is based entirely on nonhuman wealth.
D) it is based entirely on human wealth.
A) it does not consider an individual's current income.
B) it does not consider private and public pension plans.
C) it is based entirely on nonhuman wealth.
D) it is based entirely on human wealth.
Unlock Deck
Unlock for access to all 304 flashcards in this deck.
Unlock Deck
k this deck
60
The common measure of wealth used in calculating the distribution of wealth includes
A) the amount an individual will not receive during retirement.
B) workers' claims on private pension funds.
C) financial assets.
D) human capital.
A) the amount an individual will not receive during retirement.
B) workers' claims on private pension funds.
C) financial assets.
D) human capital.
Unlock Deck
Unlock for access to all 304 flashcards in this deck.
Unlock Deck
k this deck
61
The distribution of money income can be represented graphically using
A) supply and demand diagrams.
B) a Lorenz curve.
C) a Keynesian curve.
D) a Distribution curve.
A) supply and demand diagrams.
B) a Lorenz curve.
C) a Keynesian curve.
D) a Distribution curve.
Unlock Deck
Unlock for access to all 304 flashcards in this deck.
Unlock Deck
k this deck
62
Use the information in the above table. If Income was evenly distributed, each person would receive
A) $9,000.
B) $2,500.
C) $1,800.
D) $1,000.
Unlock Deck
Unlock for access to all 304 flashcards in this deck.
Unlock Deck
k this deck
63
A Lorenz curve measures the ________ on the vertical axis.
A) cumulative percentage of money income
B) cumulative percentage of family wealth
C) cumulative percentage of families
D) demand of families on welfare
A) cumulative percentage of money income
B) cumulative percentage of family wealth
C) cumulative percentage of families
D) demand of families on welfare
Unlock Deck
Unlock for access to all 304 flashcards in this deck.
Unlock Deck
k this deck
64
All of the following are criticisms of the Lorenz curve analysis EXCEPT
A) income-in-kind is not figured in.
B) the inequality gap is not an issue that economists study.
C) different sizes of households are ignored.
D) it does not take into consideration lifetime earnings.
A) income-in-kind is not figured in.
B) the inequality gap is not an issue that economists study.
C) different sizes of households are ignored.
D) it does not take into consideration lifetime earnings.
Unlock Deck
Unlock for access to all 304 flashcards in this deck.
Unlock Deck
k this deck
65
The Lorenz curve is criticized for all of the following EXCEPT
A) that it excludes transfers-in-kind income.
B) that it does not account for the size differences of households.
C) that it does not account for age differences of households.
D) that it does not account for the impact of trade on the standard of living.
A) that it excludes transfers-in-kind income.
B) that it does not account for the size differences of households.
C) that it does not account for age differences of households.
D) that it does not account for the impact of trade on the standard of living.
Unlock Deck
Unlock for access to all 304 flashcards in this deck.
Unlock Deck
k this deck
66
If a nation's Lorenz curve lies on the 45 degree line of income equality, then
A) more of the nation's income is received by the lowest 25 percent of families than by the highest 25 percent.
B) every household's income level is different.
C) more of the nation's income is received by the highest 25 percent of families than by the lowest percent.
D) the income received by each 25 percent of families is 25 percent of the total income.
Unlock Deck
Unlock for access to all 304 flashcards in this deck.
Unlock Deck
k this deck
67
The Lorenz curve shows
A) how poverty rates change over time.
B) the percentage of population below the poverty line.
C) the degree of inequality in the income distribution.
D) the ratio of cash income to payments-in-kind.
A) how poverty rates change over time.
B) the percentage of population below the poverty line.
C) the degree of inequality in the income distribution.
D) the ratio of cash income to payments-in-kind.
Unlock Deck
Unlock for access to all 304 flashcards in this deck.
Unlock Deck
k this deck
68
A Lorenz curve measures the ________ on the horizontal axis.
A) cumulative percentage of family income
B) cumulative percentage of family wealth
C) cumulative percentage of families
D) demand of families on welfare
A) cumulative percentage of family income
B) cumulative percentage of family wealth
C) cumulative percentage of families
D) demand of families on welfare
Unlock Deck
Unlock for access to all 304 flashcards in this deck.
Unlock Deck
k this deck
69
Use the above table. What percentage of income is received by the poorest 20% of the population?
A) 20 percent
B) 13.3 percent
C) 11.1 percent
D) 7.0 percent
Unlock Deck
Unlock for access to all 304 flashcards in this deck.
Unlock Deck
k this deck
70
Wealth is considered to be a
A) nontaxable stream of funds.
B) flow.
C) stock.
D) resource.
A) nontaxable stream of funds.
B) flow.
C) stock.
D) resource.
Unlock Deck
Unlock for access to all 304 flashcards in this deck.
Unlock Deck
k this deck
71
Use the above table. What percentage of income is received by the richest 20% of the population?
A) 33.33 percent
B) 16.67 percent
C) 11.11 percent
D) 40.00 percent
Unlock Deck
Unlock for access to all 304 flashcards in this deck.
Unlock Deck
k this deck
72
Use the above table. What percentage of income is received by the poorest 60% of the population?
A) 27.78 percent
B) 33.33 percent
C) 44.44 percent
D) 55.56 percent
Unlock Deck
Unlock for access to all 304 flashcards in this deck.
Unlock Deck
k this deck
73
Use the above figure. Refer to the above diagram where curves (a) through (d) are for four different countries. Income is most unequally distributed in
A) Country A.
B) Country B.
C) Country C.
D) Country D.
Unlock Deck
Unlock for access to all 304 flashcards in this deck.
Unlock Deck
k this deck
74
The most widely used measure of income inequality is
A) the Bureau of Labor Statistics' cost-of-living index.
B) the Laffer curve.
C) the Lorenz curve.
D) the Gemini coefficient.
A) the Bureau of Labor Statistics' cost-of-living index.
B) the Laffer curve.
C) the Lorenz curve.
D) the Gemini coefficient.
Unlock Deck
Unlock for access to all 304 flashcards in this deck.
Unlock Deck
k this deck
75
Income-in-kind is
A) money income.
B) received in the form of goods and services.
C) income in dollars.
D) used to buy goods and services.
A) money income.
B) received in the form of goods and services.
C) income in dollars.
D) used to buy goods and services.
Unlock Deck
Unlock for access to all 304 flashcards in this deck.
Unlock Deck
k this deck
76
Income is considered to be a
A) nontaxable stream of funds.
B) flow.
C) stock.
D) resource.
A) nontaxable stream of funds.
B) flow.
C) stock.
D) resource.
Unlock Deck
Unlock for access to all 304 flashcards in this deck.
Unlock Deck
k this deck
77
Use the above figure. Refer to the above diagram where curves (a) through (d) are for four different countries. Income is third most unequally distributed in
A) Country A.
B) Country B.
C) Country C.
D) Country D.
Unlock Deck
Unlock for access to all 304 flashcards in this deck.
Unlock Deck
k this deck
78
Use the information in the above table. The top 40 percent of the population earn
A) 66.7 percent of the income.
B) 55.5 percent of the income.
C) 50.0 percent of the income.
D) 44.4 percent of the income.
Unlock Deck
Unlock for access to all 304 flashcards in this deck.
Unlock Deck
k this deck
79
Use the above figure. Refer to the above diagram where curves (a) through (d) are for four different countries. Income is equally distributed in
A) Country A.
B) Country B.
C) Country C.
D) Country D.
Unlock Deck
Unlock for access to all 304 flashcards in this deck.
Unlock Deck
k this deck
80
Which of the following statements regarding the Lorenz curve is FALSE?
A) A Lorenz curve is a geometric representation of the distribution of income.
B) A Lorenz curve that is perfectly straight represents complete income equality.
C) The less bowed is a Lorenz curve, the less equally income is distributed.
D) The more bowed is a Lorenz curve, the more unequally income is distributed.
Unlock Deck
Unlock for access to all 304 flashcards in this deck.
Unlock Deck
k this deck
Unlock Deck
Unlock for access to all 304 flashcards in this deck.


