Deck 36: Population Ecology
Full screen (f)
Question
Question
Question
Question
Question
Question
Question
Question
Question
Question
Question
Question
Question
Question
Question
Question
Question
Question
Question
Question
Question
Question
Question
Question
Question
Question
Question
Question
Question
Question
Question
Question
Question
Question
Question
Question
Question
Question
Question
Question
Question
Question
After reading the paragraph below, answer the questions that follow.
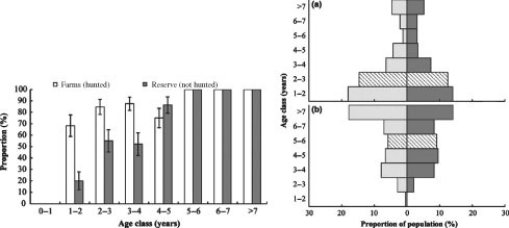
In southern Africa, jackals are major predators of livestock on farms. As a control measure, farmers often kill jackals they find on their farms. Scientists Liaan Minnie and colleagues predicted that increased mortality of jackals would result in altered life history traits of this carnivore species. To test their predictions, they compared the number of pregnant female jackals in different age classes in populations that were hunted (on farms) to those that were not hunted (in conservation reserves). The resulting pattern shown in the first graph is the proportion of females that are pregnant in each age class. The scientists also collected demographic data to construct age structure diagrams (second graph) of jackals in (a) hunted populations (farms) and (b) populations that were not hunted (reserves). In the age structure diagram, males are plotted on the left, females are plotted on the right, and the median age class is denoted with hatched bars.
 Source: Minnie, L., Gaylard, A., & Kerley, G. I. (2016). Compensatory life‐history responses of a mesopredator may undermine carnivore management efforts. Journal of Applied Ecology, 53(2), 379-387.
What are the management implications of this study?
A) The problem of jackals on farms may be exacerbated by hunting them because these populations of jackals are released from density-dependent limits on reproduction.
B) Hunting is an effective solution to reducing population growth of jackals because killing them shifts farm populations from K- to r-selected strategies.
C) Jackals can be successfully controlled on farms because hunting them results in a steady decrease of their intrinsic rate of increase.
D) Farm populations of jackals should not be hunted to prevent predation of livestock because density-dependent mortality factors will emerge.
In southern Africa, jackals are major predators of livestock on farms. As a control measure, farmers often kill jackals they find on their farms. Scientists Liaan Minnie and colleagues predicted that increased mortality of jackals would result in altered life history traits of this carnivore species. To test their predictions, they compared the number of pregnant female jackals in different age classes in populations that were hunted (on farms) to those that were not hunted (in conservation reserves). The resulting pattern shown in the first graph is the proportion of females that are pregnant in each age class. The scientists also collected demographic data to construct age structure diagrams (second graph) of jackals in (a) hunted populations (farms) and (b) populations that were not hunted (reserves). In the age structure diagram, males are plotted on the left, females are plotted on the right, and the median age class is denoted with hatched bars.
Source: Minnie, L., Gaylard, A., & Kerley, G. I. (2016). Compensatory life‐history responses of a mesopredator may undermine carnivore management efforts. Journal of Applied Ecology, 53(2), 379-387.What are the management implications of this study?
A) The problem of jackals on farms may be exacerbated by hunting them because these populations of jackals are released from density-dependent limits on reproduction.
B) Hunting is an effective solution to reducing population growth of jackals because killing them shifts farm populations from K- to r-selected strategies.
C) Jackals can be successfully controlled on farms because hunting them results in a steady decrease of their intrinsic rate of increase.
D) Farm populations of jackals should not be hunted to prevent predation of livestock because density-dependent mortality factors will emerge.
Question
After reading the paragraph below, answer the questions that follow.
In southern Africa, jackals are major predators of livestock on farms. As a control measure, farmers often kill jackals they find on their farms. Scientists Liaan Minnie and colleagues predicted that increased mortality of jackals would result in altered life history traits of this carnivore species. To test their predictions, they compared the number of pregnant female jackals in different age classes in populations that were hunted (on farms) to those that were not hunted (in conservation reserves). The resulting pattern shown in the first graph is the proportion of females that are pregnant in each age class. The scientists also collected demographic data to construct age structure diagrams (second graph) of jackals in (a) hunted populations (farms) and (b) populations that were not hunted (reserves). In the age structure diagram, males are plotted on the left, females are plotted on the right, and the median age class is denoted with hatched bars.
Source: Minnie, L., Gaylard, A., & Kerley, G. I. (2016). Compensatory life‐history responses of a mesopredator may undermine carnivore management efforts. Journal of Applied Ecology, 53(2), 379-387.
Jackals live in socially organized groups, with dominant females suppressing reproduction in nondominant (submissive) individuals. Examine the first graph, and select the explanation that best predicts the effect of dominance hierarchies on population growth in jackals.
A) On farms, older individuals suppress younger individuals from reproducing. A smaller proportion of pregnant females would make farm populations grow more slowly than reserve populations.
B) On farms, younger individuals suppress older individuals from reproducing. A smaller proportion of pregnant females would make farm populations grow more slowly than reserve populations.
C) On reserves, older individuals suppress younger individuals from reproducing. A smaller proportion of pregnant females would make reserve populations grow more slowly than farm populations.
D) On reserves, younger individuals suppress older individuals from reproducing. A smaller proportion of pregnant females would make reserve populations grow more slowly than farm populations.
In southern Africa, jackals are major predators of livestock on farms. As a control measure, farmers often kill jackals they find on their farms. Scientists Liaan Minnie and colleagues predicted that increased mortality of jackals would result in altered life history traits of this carnivore species. To test their predictions, they compared the number of pregnant female jackals in different age classes in populations that were hunted (on farms) to those that were not hunted (in conservation reserves). The resulting pattern shown in the first graph is the proportion of females that are pregnant in each age class. The scientists also collected demographic data to construct age structure diagrams (second graph) of jackals in (a) hunted populations (farms) and (b) populations that were not hunted (reserves). In the age structure diagram, males are plotted on the left, females are plotted on the right, and the median age class is denoted with hatched bars.
Source: Minnie, L., Gaylard, A., & Kerley, G. I. (2016). Compensatory life‐history responses of a mesopredator may undermine carnivore management efforts. Journal of Applied Ecology, 53(2), 379-387.Jackals live in socially organized groups, with dominant females suppressing reproduction in nondominant (submissive) individuals. Examine the first graph, and select the explanation that best predicts the effect of dominance hierarchies on population growth in jackals.
A) On farms, older individuals suppress younger individuals from reproducing. A smaller proportion of pregnant females would make farm populations grow more slowly than reserve populations.
B) On farms, younger individuals suppress older individuals from reproducing. A smaller proportion of pregnant females would make farm populations grow more slowly than reserve populations.
C) On reserves, older individuals suppress younger individuals from reproducing. A smaller proportion of pregnant females would make reserve populations grow more slowly than farm populations.
D) On reserves, younger individuals suppress older individuals from reproducing. A smaller proportion of pregnant females would make reserve populations grow more slowly than farm populations.
Question
After reading the paragraph below, answer the questions that follow.
In southern Africa, jackals are major predators of livestock on farms. As a control measure, farmers often kill jackals they find on their farms. Scientists Liaan Minnie and colleagues predicted that increased mortality of jackals would result in altered life history traits of this carnivore species. To test their predictions, they compared the number of pregnant female jackals in different age classes in populations that were hunted (on farms) to those that were not hunted (in conservation reserves). The resulting pattern shown in the first graph is the proportion of females that are pregnant in each age class. The scientists also collected demographic data to construct age structure diagrams (second graph) of jackals in (a) hunted populations (farms) and (b) populations that were not hunted (reserves). In the age structure diagram, males are plotted on the left, females are plotted on the right, and the median age class is denoted with hatched bars.
Source: Minnie, L., Gaylard, A., & Kerley, G. I. (2016). Compensatory life‐history responses of a mesopredator may undermine carnivore management efforts. Journal of Applied Ecology, 53(2), 379-387.
Jackals live in socially organized groups, which means the scientists found the jackals in a ________ dispersion pattern.
A) uniform
B) clumped
C) random
In southern Africa, jackals are major predators of livestock on farms. As a control measure, farmers often kill jackals they find on their farms. Scientists Liaan Minnie and colleagues predicted that increased mortality of jackals would result in altered life history traits of this carnivore species. To test their predictions, they compared the number of pregnant female jackals in different age classes in populations that were hunted (on farms) to those that were not hunted (in conservation reserves). The resulting pattern shown in the first graph is the proportion of females that are pregnant in each age class. The scientists also collected demographic data to construct age structure diagrams (second graph) of jackals in (a) hunted populations (farms) and (b) populations that were not hunted (reserves). In the age structure diagram, males are plotted on the left, females are plotted on the right, and the median age class is denoted with hatched bars.
Source: Minnie, L., Gaylard, A., & Kerley, G. I. (2016). Compensatory life‐history responses of a mesopredator may undermine carnivore management efforts. Journal of Applied Ecology, 53(2), 379-387.Jackals live in socially organized groups, which means the scientists found the jackals in a ________ dispersion pattern.
A) uniform
B) clumped
C) random
Question
Examine the age structure of Germany in the following figure. Which conclusion is not supported by the age structure? 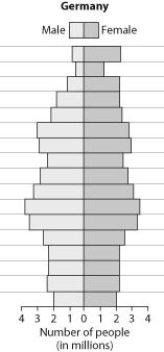
A) There will be large positive population growth in the near future.
B) There are more women than men between the ages of 60 and 70.
C) There will be small negative population growth in the near future.
D) There are more people between the ages of 25 to 39 then between 0 and 14.
A) There will be large positive population growth in the near future.
B) There are more women than men between the ages of 60 and 70.
C) There will be small negative population growth in the near future.
D) There are more people between the ages of 25 to 39 then between 0 and 14.
Question
After reading the paragraph below, answer the questions that follow.
In southern Africa, jackals are major predators of livestock on farms. As a control measure, farmers often kill jackals they find on their farms. Scientists Liaan Minnie and colleagues predicted that increased mortality of jackals would result in altered life history traits of this carnivore species. To test their predictions, they compared the number of pregnant female jackals in different age classes in populations that were hunted (on farms) to those that were not hunted (in conservation reserves). The resulting pattern shown in the first graph is the proportion of females that are pregnant in each age class. The scientists also collected demographic data to construct age structure diagrams (second graph) of jackals in (a) hunted populations (farms) and (b) populations that were not hunted (reserves). In the age structure diagram, males are plotted on the left, females are plotted on the right, and the median age class is denoted with hatched bars.
Source: Minnie, L., Gaylard, A., & Kerley, G. I. (2016). Compensatory life‐history responses of a mesopredator may undermine carnivore management efforts. Journal of Applied Ecology, 53(2), 379-387.
Interpret the age structure diagram for jackals on farms compared to reserves.
A) Jackal populations on farms should expand; jackal populations in reserves should decline.
B) Jackal populations on farms should decline; jackal populations in reserves should expand.
C) Jackal populations should decline on farms and reserves.
D) Jackal populations should expand on farms and reserves.
In southern Africa, jackals are major predators of livestock on farms. As a control measure, farmers often kill jackals they find on their farms. Scientists Liaan Minnie and colleagues predicted that increased mortality of jackals would result in altered life history traits of this carnivore species. To test their predictions, they compared the number of pregnant female jackals in different age classes in populations that were hunted (on farms) to those that were not hunted (in conservation reserves). The resulting pattern shown in the first graph is the proportion of females that are pregnant in each age class. The scientists also collected demographic data to construct age structure diagrams (second graph) of jackals in (a) hunted populations (farms) and (b) populations that were not hunted (reserves). In the age structure diagram, males are plotted on the left, females are plotted on the right, and the median age class is denoted with hatched bars.
Source: Minnie, L., Gaylard, A., & Kerley, G. I. (2016). Compensatory life‐history responses of a mesopredator may undermine carnivore management efforts. Journal of Applied Ecology, 53(2), 379-387.Interpret the age structure diagram for jackals on farms compared to reserves.
A) Jackal populations on farms should expand; jackal populations in reserves should decline.
B) Jackal populations on farms should decline; jackal populations in reserves should expand.
C) Jackal populations should decline on farms and reserves.
D) Jackal populations should expand on farms and reserves.
Question
Question
According to this graph of population growth in Mexico, in what year was the rate of population increase in Mexico the greatest? 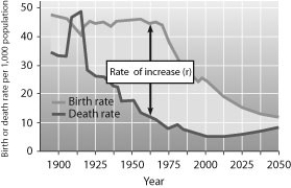
A) 1912
B) 1930
C) 1965
D) 2000
A) 1912
B) 1930
C) 1965
D) 2000
Question
After reading the paragraph below, answer the questions that follow.
An African family that has been displaced from their home by civil war is trying to select a new country in which to settle to gain better economic opportunities. Nigeria is a large country with rich natural resources, and the family is considering it for its new home. Among the data the family finds while researching Nigeria is the following diagram of the current age structure of the country.
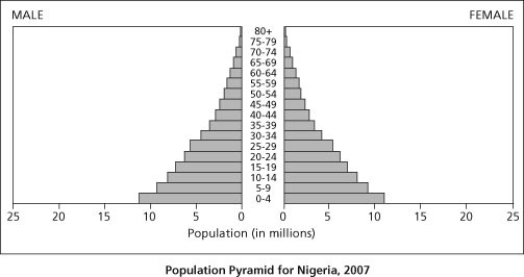
The age structure data for Nigeria shows that the country has many more individuals under the age of 15 than over the age of 40. What does this imply about the future population of Nigeria?
A) The population will probably remain stable.
B) The population will probably decrease.
C) The population will probably grow rapidly.
D) The number of older people will probably increase rapidly.
An African family that has been displaced from their home by civil war is trying to select a new country in which to settle to gain better economic opportunities. Nigeria is a large country with rich natural resources, and the family is considering it for its new home. Among the data the family finds while researching Nigeria is the following diagram of the current age structure of the country.
The age structure data for Nigeria shows that the country has many more individuals under the age of 15 than over the age of 40. What does this imply about the future population of Nigeria?
A) The population will probably remain stable.
B) The population will probably decrease.
C) The population will probably grow rapidly.
D) The number of older people will probably increase rapidly.
Question
Question
After reading the paragraph below, answer the questions that follow.
An African family that has been displaced from their home by civil war is trying to select a new country in which to settle to gain better economic opportunities. Nigeria is a large country with rich natural resources, and the family is considering it for its new home. Among the data the family finds while researching Nigeria is the following diagram of the current age structure of the country.
Which statement about the age structure of Nigeria is true?
A) The populations of males and females ages 0 to 4 differ in size.
B) The population of males ages 15 to 19 is twice the population of females ages 5 to 9.
C) There are approximately 8 million males in Nigeria ages 0 to 14.
D) The population of females ages 40 to 44 is larger than the population of males ages 65 to 69.
Question
Question
After reading the paragraph below, answer the questions that follow.
An African family that has been displaced from their home by civil war is trying to select a new country in which to settle to gain better economic opportunities. Nigeria is a large country with rich natural resources, and the family is considering it for its new home. Among the data the family finds while researching Nigeria is the following diagram of the current age structure of the country.
Based on the age structure of the country, what situation would be most likely to occur over the next 20 years?
A) strong economic gains stimulated by population growth
B) an increased demand for resources based on population growth
C) a decreased demand for medical services due to the small number of elderly citizens
D) a decline in housing prices based on lack of demand
Question
Question
Question
Question
According to this graph of the population growth of fur seals, in what year did the population first reach its carrying capacity? 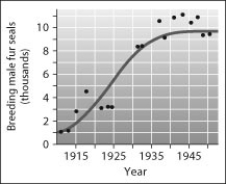
A) 1925
B) 1930
C) 1940
D) 1950
A) 1925
B) 1930
C) 1940
D) 1950

Unlock Deck
Sign up to unlock the cards in this deck!
Unlock Deck
Unlock Deck
1/57
Play
Full screen (f)
Deck 36: Population Ecology
1
A newly mated queen ant establishes an ant nest in an unoccupied patch of suitable habitat. The population of the nest grows quickly at first, then levels off at carrying capacity. Which of the following models best describes its population growth?
A) linear
B) logarithmic
C) logistic
D) exponential
A) linear
B) logarithmic
C) logistic
D) exponential
C
2
The maximum number of individuals a habitat can support is called its
A) reproductive potential.
B) carrying capacity.
C) community size.
D) density-dependent factor.
A) reproductive potential.
B) carrying capacity.
C) community size.
D) density-dependent factor.
B
3
Which is an example of a population?
A) all of the microorganisms on your skin
B) all of the students in your classroom
C) all students attending colleges and universities in your state
D) the various plants found in prairies in the western United States
A) all of the microorganisms on your skin
B) all of the students in your classroom
C) all students attending colleges and universities in your state
D) the various plants found in prairies in the western United States
B
4
The pattern of distribution for a certain species of kelp is clumped. The pattern of distribution for a population of snails that live on the kelp would be
A) clumped.
B) random.
C) uniform.
A) clumped.
B) random.
C) uniform.
Unlock Deck
Unlock for access to all 57 flashcards in this deck.
Unlock Deck
k this deck
5
To obtain optimal production in a small garden, one should
A) plant seeds in rows with minimal spacing between rows.
B) plant seeds in clumps with large spaces between clumps.
C) plant seeds in a uniform pattern throughout the garden.
D) sow seeds randomly throughout the garden.
A) plant seeds in rows with minimal spacing between rows.
B) plant seeds in clumps with large spaces between clumps.
C) plant seeds in a uniform pattern throughout the garden.
D) sow seeds randomly throughout the garden.
Unlock Deck
Unlock for access to all 57 flashcards in this deck.
Unlock Deck
k this deck
6
You drive through Iowa in the spring and notice that along a stretch of several kilometers, every third fence post has a male redwing blackbird perched on it defending its nesting territory. This is an example of
A) clumped dispersion.
B) random dispersion.
C) uniform dispersion.
A) clumped dispersion.
B) random dispersion.
C) uniform dispersion.
Unlock Deck
Unlock for access to all 57 flashcards in this deck.
Unlock Deck
k this deck
7
A survivorship curve that shows a population producing very few offspring, each of which has a high probability of surviving to adulthood, is typical of
A) sea stars.
B) elephants.
C) oysters.
D) rodents.
A) sea stars.
B) elephants.
C) oysters.
D) rodents.
Unlock Deck
Unlock for access to all 57 flashcards in this deck.
Unlock Deck
k this deck
8
If a population has a birth rate of 40 individuals per 1,000 per year and a death rate of 30 individuals per 1,000 per year, how will the population change each year? (Assume that the population is below carrying capacity and that there is no immigration or emigration.)
A) It will decrease by 70%.
B) It will increase by 1%.
C) It will increase by 5%.
D) It will increase by 100%.
A) It will decrease by 70%.
B) It will increase by 1%.
C) It will increase by 5%.
D) It will increase by 100%.
Unlock Deck
Unlock for access to all 57 flashcards in this deck.
Unlock Deck
k this deck
9
A tidal wave wipes out the entire population of mice living on an island. This is an example of
A) Type III survivorship.
B) a density-dependent effect.
C) the effects of abiotic factors.
D) the interaction between density-dependent and abiotic factors.
A) Type III survivorship.
B) a density-dependent effect.
C) the effects of abiotic factors.
D) the interaction between density-dependent and abiotic factors.
Unlock Deck
Unlock for access to all 57 flashcards in this deck.
Unlock Deck
k this deck
10
A group of individuals of a single species that occupy the same general area defines a
A) population.
B) community.
C) subspecies.
D) clone.
A) population.
B) community.
C) subspecies.
D) clone.
Unlock Deck
Unlock for access to all 57 flashcards in this deck.
Unlock Deck
k this deck
11
A Type I survivorship curve is associated with which of the following life history traits?
A) parents providing extended care for their young
B) large numbers of offspring being produced
C) infant mortality being much greater than adult mortality
D) a short life span for most individuals
A) parents providing extended care for their young
B) large numbers of offspring being produced
C) infant mortality being much greater than adult mortality
D) a short life span for most individuals
Unlock Deck
Unlock for access to all 57 flashcards in this deck.
Unlock Deck
k this deck
12
A human population will achieve zero population growth if
A) no couple has more than 2 children.
B) couples have an average of about 2.25 children each (to account for some children who do not survive to reproduce).
C) no couple has more than 1 child.
D) the birth rate equals the intrinsic rate of increase r.
A) no couple has more than 2 children.
B) couples have an average of about 2.25 children each (to account for some children who do not survive to reproduce).
C) no couple has more than 1 child.
D) the birth rate equals the intrinsic rate of increase r.
Unlock Deck
Unlock for access to all 57 flashcards in this deck.
Unlock Deck
k this deck
13
Consider a stable frog population living at carrying capacity in a pond. If an average female produces 6,000 eggs during her lifetime and an average of 300 tadpoles hatch from these eggs, how many of these tadpoles will, on average, survive to reproduce?
A) 0
B) 2
C) 10 to 20
D) more than 100
A) 0
B) 2
C) 10 to 20
D) more than 100
Unlock Deck
Unlock for access to all 57 flashcards in this deck.
Unlock Deck
k this deck
14
The density of Douglas firs in an old-growth forest is estimated by counting the Douglas firs in four sample plots of 1 hectare each. The number of fir trees in the plots is 10, 12, 7, and 11, respectively. What is the estimated density of firs in the forest?
A) 5 trees per hectare
B) 10 trees per hectare
C) 20 trees per hectare
D) 25 trees per hectare
A) 5 trees per hectare
B) 10 trees per hectare
C) 20 trees per hectare
D) 25 trees per hectare
Unlock Deck
Unlock for access to all 57 flashcards in this deck.
Unlock Deck
k this deck
15
A survivorship curve is a graph that plots
A) an individual's likelihood of reproducing as a function of age.
B) an individual's likelihood of being alive as a function of age.
C) the effect of predation on a prey population.
D) population growth that is limited by a carrying capacity.
A) an individual's likelihood of reproducing as a function of age.
B) an individual's likelihood of being alive as a function of age.
C) the effect of predation on a prey population.
D) population growth that is limited by a carrying capacity.
Unlock Deck
Unlock for access to all 57 flashcards in this deck.
Unlock Deck
k this deck
16
A population of fungi in a yard produces 10 mushrooms in year 1, 20 in year 2, and 40 in year 3. If this trend continues, by year 5 there will be ________ mushrooms.
A) 40
B) 80
C) 160
D) 320
A) 40
B) 80
C) 160
D) 320
Unlock Deck
Unlock for access to all 57 flashcards in this deck.
Unlock Deck
k this deck
17
The death by bubonic plague of about one-third of Europe's population during the 14th century is a good example of
A) abiotic factors limiting population size.
B) a density-dependent effect.
C) a density-independent effect.
D) uniform population dispersion.
A) abiotic factors limiting population size.
B) a density-dependent effect.
C) a density-independent effect.
D) uniform population dispersion.
Unlock Deck
Unlock for access to all 57 flashcards in this deck.
Unlock Deck
k this deck
18
A test tube is inoculated with 1 × 10³ cells of a bacterial strain that has a generation time of 30 minutes. The carrying capacity of the test tube for this strain is 6 × 10⁹ cells. What will the bacterial population be after 90 minutes of culturing?
A) 3 × 10³
B) 8 × 10³
C) 1 × 10⁹
D) 6 × 10⁹
A) 3 × 10³
B) 8 × 10³
C) 1 × 10⁹
D) 6 × 10⁹
Unlock Deck
Unlock for access to all 57 flashcards in this deck.
Unlock Deck
k this deck
19
Assume that there are five alligators per acre in a swamp in northern Florida. This is a measure of the alligator population's
A) dispersion.
B) intrinsic rate of increase.
C) range.
D) density.
A) dispersion.
B) intrinsic rate of increase.
C) range.
D) density.
Unlock Deck
Unlock for access to all 57 flashcards in this deck.
Unlock Deck
k this deck
20
If an ecosystem has a carrying capacity of 1,000 individuals for a given species and 2,000 individuals of that species are present, we can predict that the population
A) size will remain at equilibrium.
B) size will decrease.
C) will show a clumped dispersion pattern.
D) size will slowly increase.
A) size will remain at equilibrium.
B) size will decrease.
C) will show a clumped dispersion pattern.
D) size will slowly increase.
Unlock Deck
Unlock for access to all 57 flashcards in this deck.
Unlock Deck
k this deck
21
An ecologist hypothesizes that predation by a particular owl species is the major factor controlling the population of a particular rabbit species. If this is the case, which of the following population effects could be expected in this rabbit-owl pair?
A) A fall in the owl population should cause a fall in the rabbit population.
B) A fall in the rabbit population should cause an increase in the owl population.
C) An increase in the incidence of disease in the rabbit population should not change the owl population.
D) An increase in the owl population should cause a fall in the rabbit population.
Unlock Deck
Unlock for access to all 57 flashcards in this deck.
Unlock Deck
k this deck
22
Which statement about human demographic trends is true?
A) As women's status and education increase, they choose to have more children.
B) After 1950, mortality rates increased rapidly in most developing countries.
C) A human population in which women reproduce at a later age will experience slower population growth.
D) The movement from high birth rates and low death rates to low birth rates and high death rates is called the demographic transition.
Unlock Deck
Unlock for access to all 57 flashcards in this deck.
Unlock Deck
k this deck
23
An ecological footprint
A) is a means of determining increases in populations that lived in the past.
B) is a means of understanding resource availability and usage.
C) measures dispersion and adaptability.
D) will estimate population movements.
A) is a means of determining increases in populations that lived in the past.
B) is a means of understanding resource availability and usage.
C) measures dispersion and adaptability.
D) will estimate population movements.
Unlock Deck
Unlock for access to all 57 flashcards in this deck.
Unlock Deck
k this deck
24
Which action will likely decrease a population's size?
A) improving the quality of its habitat
B) increasing the size of its habitat
C) practicing sustainable resource management in its habitat
D) decreasing the food supply available to the population
A) improving the quality of its habitat
B) increasing the size of its habitat
C) practicing sustainable resource management in its habitat
D) decreasing the food supply available to the population
Unlock Deck
Unlock for access to all 57 flashcards in this deck.
Unlock Deck
k this deck
25
In terms of population dynamics, "boom-and-bust" cycling is a situation in which
A) a population moves back and forth between rapid growth and decline.
B) a growing population overshoots the carrying capacity of its environment and experiences a crash before stabilizing.
C) the sex ratio in a population shows repeated oscillations.
D) the populations of two competing species oscillate in unison.
Unlock Deck
Unlock for access to all 57 flashcards in this deck.
Unlock Deck
k this deck
26
Which statement about the application of insecticides is true?
A) To control agricultural pests, pest management uses biological controls, chemicals, or cultural methods, but never a combination of these.
B) Simply killing many individuals is often the best way to reduce the size of a pest population.
C) Most insecticides kill the pest but not the pest's natural predators.
D) Pest species can rebound faster than their predators because the pests often have a higher reproductive rate than predators have.
Unlock Deck
Unlock for access to all 57 flashcards in this deck.
Unlock Deck
k this deck
27
An r-selected species typically
A) offers considerable parental care to a small number of offspring.
B) has an advantage in habitats that experience unpredictable disturbances.
C) is large-bodied, long-lived, and limited by density-dependent factors.
D) has an advantage in habitats that experience stable climates.
A) offers considerable parental care to a small number of offspring.
B) has an advantage in habitats that experience unpredictable disturbances.
C) is large-bodied, long-lived, and limited by density-dependent factors.
D) has an advantage in habitats that experience stable climates.
Unlock Deck
Unlock for access to all 57 flashcards in this deck.
Unlock Deck
k this deck
28
Which statement about human population growth is true?
A) Human population size on Earth today is no longer changing and has effectively reached equilibrium.
B) Demographic transition is a transition from high birth rates and high death rates to low birth rates and low death rates.
C) During a demographic transition, birth rates typically drop first due to the availability of reliable contraception.
D) Human population size has increased faster and faster throughout human history.
Unlock Deck
Unlock for access to all 57 flashcards in this deck.
Unlock Deck
k this deck
29
A demographic tool used to predict a population's future growth is a(n)
A) Type III survivorship curve.
B) demographic transition.
C) age structure diagram.
D) Type I survivorship curve.
A) Type III survivorship curve.
B) demographic transition.
C) age structure diagram.
D) Type I survivorship curve.
Unlock Deck
Unlock for access to all 57 flashcards in this deck.
Unlock Deck
k this deck
30
Guppies from Trinidad form two distinct populations that differ in several life history traits. These traits appear to relate to the local predator populations, pike-cichlids or killifish. Which experiments would best test the heritability of these traits?
A) Raise both populations with cichlids to see if the population of smaller, faster-maturing guppies reproduces more quickly.
B) Raise both populations without predators to see if they maintain their life history traits.
C) Introduce cichlids into a habitat with killifish.
D) Provide additional food to the guppies from cichlid habitats to see if they will grow to the same size as guppies from the killifish habitat.
Unlock Deck
Unlock for access to all 57 flashcards in this deck.
Unlock Deck
k this deck
31
Thanks to a new conservation program, a population with only 200 individuals at the beginning of the year is growing exponentially. The population has a per capita birth rate of 0.5 per year and a death rate of 0.2 per year. What is the growth rate during the year? What will the population be at the end of the year?
A) growth rate = 60 per year; population = 260
B) growth rate = 6 per year; population = 206
C) growth rate = 260 per year; population = 60
D) growth rate = 30 per year; population = 230
A) growth rate = 60 per year; population = 260
B) growth rate = 6 per year; population = 206
C) growth rate = 260 per year; population = 60
D) growth rate = 30 per year; population = 230
Unlock Deck
Unlock for access to all 57 flashcards in this deck.
Unlock Deck
k this deck
32
Which organisms best illustrates K-selection?
A) the production of thousands of eggs every spring by frogs
B) mice that produce three litters of 10-15 babies in the course of a summer
C) a polar bear producing one or two cubs every three years
D) a species of weed that quickly spreads into a region of cleared trees
A) the production of thousands of eggs every spring by frogs
B) mice that produce three litters of 10-15 babies in the course of a summer
C) a polar bear producing one or two cubs every three years
D) a species of weed that quickly spreads into a region of cleared trees
Unlock Deck
Unlock for access to all 57 flashcards in this deck.
Unlock Deck
k this deck
33
As a growing population nears its carrying capacity, birth rates
A) remain constant and death rates increase.
B) decline but death rates remain steady.
C) and death rates increase.
D) decline and/or death rates increase.
A) remain constant and death rates increase.
B) decline but death rates remain steady.
C) and death rates increase.
D) decline and/or death rates increase.
Unlock Deck
Unlock for access to all 57 flashcards in this deck.
Unlock Deck
k this deck
34
An ecologist hypothesizes that predation by a particular owl species is the major factor controlling the population of a particular rabbit species. The first step in testing this hypothesis would be to determine
A) whether populations of the rabbit that live outside the range of the owl have higher population densities.
B) whether the owls eat the rabbits.
C) to which diseases the rabbit population is subject.
D) what food the rabbits eat.
A) whether populations of the rabbit that live outside the range of the owl have higher population densities.
B) whether the owls eat the rabbits.
C) to which diseases the rabbit population is subject.
D) what food the rabbits eat.
Unlock Deck
Unlock for access to all 57 flashcards in this deck.
Unlock Deck
k this deck
35
The human population on Earth is expected to reach 9.7 billion people by
A) 2015.
B) 2050.
C) 2093.
D) 3150.
A) 2015.
B) 2050.
C) 2093.
D) 3150.
Unlock Deck
Unlock for access to all 57 flashcards in this deck.
Unlock Deck
k this deck
36
What is the age structure of a population?
A) the curve that results when the likelihood of dying is plotted as a function of age
B) the curve that results when the likelihood of being alive is plotted as a function of age
C) the number of individuals alive in different age-groups at one time point
D) the difference in the age distribution of a population at two different points in time
Unlock Deck
Unlock for access to all 57 flashcards in this deck.
Unlock Deck
k this deck
37
Which example is most clearly a case of density-dependent population regulation?
A) the summer drying of savanna grass for an insect that feeds on grass sap
B) a dangerous new flu strain that is transmitted among humans by sneezing
C) the first hard frost of fall for a population of annual morning glory vines
D) the occurrence of rainstorms for an opportunistic desert annual
A) the summer drying of savanna grass for an insect that feeds on grass sap
B) a dangerous new flu strain that is transmitted among humans by sneezing
C) the first hard frost of fall for a population of annual morning glory vines
D) the occurrence of rainstorms for an opportunistic desert annual
Unlock Deck
Unlock for access to all 57 flashcards in this deck.
Unlock Deck
k this deck
38
If most of the individuals of a human population are in their pre-reproductive years, you would expect the population size to ________ after 20 years.
A) stay the same
B) increase
C) decrease
D) decrease and then stabilize
A) stay the same
B) increase
C) decrease
D) decrease and then stabilize
Unlock Deck
Unlock for access to all 57 flashcards in this deck.
Unlock Deck
k this deck
39
The age structure of the United States in 2015
A) has a broad base, suggesting a high birth rate.
B) has a broad base, suggesting a low birth rate.
C) shows that a greater proportion of the population is elderly now than in earlier decades.
D) shows that the United States has not yet gone through a demographic transition.
A) has a broad base, suggesting a high birth rate.
B) has a broad base, suggesting a low birth rate.
C) shows that a greater proportion of the population is elderly now than in earlier decades.
D) shows that the United States has not yet gone through a demographic transition.
Unlock Deck
Unlock for access to all 57 flashcards in this deck.
Unlock Deck
k this deck
40
The world human population
A) is growing faster now than ever before.
B) is growing, but at a slower rate than in the last century.
C) has leveled off at carrying capacity.
D) is starting to become smaller in size.
A) is growing faster now than ever before.
B) is growing, but at a slower rate than in the last century.
C) has leveled off at carrying capacity.
D) is starting to become smaller in size.
Unlock Deck
Unlock for access to all 57 flashcards in this deck.
Unlock Deck
k this deck
41
The African country of Nigeria had a 4.55% population growth rate from 2005 to 2010, the highest in the world. Which statement is consistent with this fact?
A) Nigeria's age structure likely looks like a pyramid with a broad base.
B) Nigerian birth rates are likely to be slightly lower than death rates.
C) Nigeria is likely in the first phase of the demographic transition.
D) Nigerian emigration rates are likely higher than immigration rates.
A) Nigeria's age structure likely looks like a pyramid with a broad base.
B) Nigerian birth rates are likely to be slightly lower than death rates.
C) Nigeria is likely in the first phase of the demographic transition.
D) Nigerian emigration rates are likely higher than immigration rates.
Unlock Deck
Unlock for access to all 57 flashcards in this deck.
Unlock Deck
k this deck
42
After reading the paragraph below, answer the questions that follow.
In southern Africa, jackals are major predators of livestock on farms. As a control measure, farmers often kill jackals they find on their farms. Scientists Liaan Minnie and colleagues predicted that increased mortality of jackals would result in altered life history traits of this carnivore species. To test their predictions, they compared the number of pregnant female jackals in different age classes in populations that were hunted (on farms) to those that were not hunted (in conservation reserves). The resulting pattern shown in the first graph is the proportion of females that are pregnant in each age class. The scientists also collected demographic data to construct age structure diagrams (second graph) of jackals in (a) hunted populations (farms) and (b) populations that were not hunted (reserves). In the age structure diagram, males are plotted on the left, females are plotted on the right, and the median age class is denoted with hatched bars.
Source: Minnie, L., Gaylard, A., & Kerley, G. I. (2016). Compensatory life‐history responses of a mesopredator may undermine carnivore management efforts. Journal of Applied Ecology, 53(2), 379-387.
What are the management implications of this study?
A) The problem of jackals on farms may be exacerbated by hunting them because these populations of jackals are released from density-dependent limits on reproduction.
B) Hunting is an effective solution to reducing population growth of jackals because killing them shifts farm populations from K- to r-selected strategies.
C) Jackals can be successfully controlled on farms because hunting them results in a steady decrease of their intrinsic rate of increase.
D) Farm populations of jackals should not be hunted to prevent predation of livestock because density-dependent mortality factors will emerge.
In southern Africa, jackals are major predators of livestock on farms. As a control measure, farmers often kill jackals they find on their farms. Scientists Liaan Minnie and colleagues predicted that increased mortality of jackals would result in altered life history traits of this carnivore species. To test their predictions, they compared the number of pregnant female jackals in different age classes in populations that were hunted (on farms) to those that were not hunted (in conservation reserves). The resulting pattern shown in the first graph is the proportion of females that are pregnant in each age class. The scientists also collected demographic data to construct age structure diagrams (second graph) of jackals in (a) hunted populations (farms) and (b) populations that were not hunted (reserves). In the age structure diagram, males are plotted on the left, females are plotted on the right, and the median age class is denoted with hatched bars.
Source: Minnie, L., Gaylard, A., & Kerley, G. I. (2016). Compensatory life‐history responses of a mesopredator may undermine carnivore management efforts. Journal of Applied Ecology, 53(2), 379-387.What are the management implications of this study?
A) The problem of jackals on farms may be exacerbated by hunting them because these populations of jackals are released from density-dependent limits on reproduction.
B) Hunting is an effective solution to reducing population growth of jackals because killing them shifts farm populations from K- to r-selected strategies.
C) Jackals can be successfully controlled on farms because hunting them results in a steady decrease of their intrinsic rate of increase.
D) Farm populations of jackals should not be hunted to prevent predation of livestock because density-dependent mortality factors will emerge.
Unlock Deck
Unlock for access to all 57 flashcards in this deck.
Unlock Deck
k this deck
43
After reading the paragraph below, answer the questions that follow.
In southern Africa, jackals are major predators of livestock on farms. As a control measure, farmers often kill jackals they find on their farms. Scientists Liaan Minnie and colleagues predicted that increased mortality of jackals would result in altered life history traits of this carnivore species. To test their predictions, they compared the number of pregnant female jackals in different age classes in populations that were hunted (on farms) to those that were not hunted (in conservation reserves). The resulting pattern shown in the first graph is the proportion of females that are pregnant in each age class. The scientists also collected demographic data to construct age structure diagrams (second graph) of jackals in (a) hunted populations (farms) and (b) populations that were not hunted (reserves). In the age structure diagram, males are plotted on the left, females are plotted on the right, and the median age class is denoted with hatched bars.
Source: Minnie, L., Gaylard, A., & Kerley, G. I. (2016). Compensatory life‐history responses of a mesopredator may undermine carnivore management efforts. Journal of Applied Ecology, 53(2), 379-387.
Jackals live in socially organized groups, with dominant females suppressing reproduction in nondominant (submissive) individuals. Examine the first graph, and select the explanation that best predicts the effect of dominance hierarchies on population growth in jackals.
A) On farms, older individuals suppress younger individuals from reproducing. A smaller proportion of pregnant females would make farm populations grow more slowly than reserve populations.
B) On farms, younger individuals suppress older individuals from reproducing. A smaller proportion of pregnant females would make farm populations grow more slowly than reserve populations.
C) On reserves, older individuals suppress younger individuals from reproducing. A smaller proportion of pregnant females would make reserve populations grow more slowly than farm populations.
D) On reserves, younger individuals suppress older individuals from reproducing. A smaller proportion of pregnant females would make reserve populations grow more slowly than farm populations.
In southern Africa, jackals are major predators of livestock on farms. As a control measure, farmers often kill jackals they find on their farms. Scientists Liaan Minnie and colleagues predicted that increased mortality of jackals would result in altered life history traits of this carnivore species. To test their predictions, they compared the number of pregnant female jackals in different age classes in populations that were hunted (on farms) to those that were not hunted (in conservation reserves). The resulting pattern shown in the first graph is the proportion of females that are pregnant in each age class. The scientists also collected demographic data to construct age structure diagrams (second graph) of jackals in (a) hunted populations (farms) and (b) populations that were not hunted (reserves). In the age structure diagram, males are plotted on the left, females are plotted on the right, and the median age class is denoted with hatched bars.
Source: Minnie, L., Gaylard, A., & Kerley, G. I. (2016). Compensatory life‐history responses of a mesopredator may undermine carnivore management efforts. Journal of Applied Ecology, 53(2), 379-387.Jackals live in socially organized groups, with dominant females suppressing reproduction in nondominant (submissive) individuals. Examine the first graph, and select the explanation that best predicts the effect of dominance hierarchies on population growth in jackals.
A) On farms, older individuals suppress younger individuals from reproducing. A smaller proportion of pregnant females would make farm populations grow more slowly than reserve populations.
B) On farms, younger individuals suppress older individuals from reproducing. A smaller proportion of pregnant females would make farm populations grow more slowly than reserve populations.
C) On reserves, older individuals suppress younger individuals from reproducing. A smaller proportion of pregnant females would make reserve populations grow more slowly than farm populations.
D) On reserves, younger individuals suppress older individuals from reproducing. A smaller proportion of pregnant females would make reserve populations grow more slowly than farm populations.
Unlock Deck
Unlock for access to all 57 flashcards in this deck.
Unlock Deck
k this deck
44
After reading the paragraph below, answer the questions that follow.
In southern Africa, jackals are major predators of livestock on farms. As a control measure, farmers often kill jackals they find on their farms. Scientists Liaan Minnie and colleagues predicted that increased mortality of jackals would result in altered life history traits of this carnivore species. To test their predictions, they compared the number of pregnant female jackals in different age classes in populations that were hunted (on farms) to those that were not hunted (in conservation reserves). The resulting pattern shown in the first graph is the proportion of females that are pregnant in each age class. The scientists also collected demographic data to construct age structure diagrams (second graph) of jackals in (a) hunted populations (farms) and (b) populations that were not hunted (reserves). In the age structure diagram, males are plotted on the left, females are plotted on the right, and the median age class is denoted with hatched bars.
Source: Minnie, L., Gaylard, A., & Kerley, G. I. (2016). Compensatory life‐history responses of a mesopredator may undermine carnivore management efforts. Journal of Applied Ecology, 53(2), 379-387.
Jackals live in socially organized groups, which means the scientists found the jackals in a ________ dispersion pattern.
A) uniform
B) clumped
C) random
In southern Africa, jackals are major predators of livestock on farms. As a control measure, farmers often kill jackals they find on their farms. Scientists Liaan Minnie and colleagues predicted that increased mortality of jackals would result in altered life history traits of this carnivore species. To test their predictions, they compared the number of pregnant female jackals in different age classes in populations that were hunted (on farms) to those that were not hunted (in conservation reserves). The resulting pattern shown in the first graph is the proportion of females that are pregnant in each age class. The scientists also collected demographic data to construct age structure diagrams (second graph) of jackals in (a) hunted populations (farms) and (b) populations that were not hunted (reserves). In the age structure diagram, males are plotted on the left, females are plotted on the right, and the median age class is denoted with hatched bars.
Source: Minnie, L., Gaylard, A., & Kerley, G. I. (2016). Compensatory life‐history responses of a mesopredator may undermine carnivore management efforts. Journal of Applied Ecology, 53(2), 379-387.Jackals live in socially organized groups, which means the scientists found the jackals in a ________ dispersion pattern.
A) uniform
B) clumped
C) random
Unlock Deck
Unlock for access to all 57 flashcards in this deck.
Unlock Deck
k this deck
45
Examine the age structure of Germany in the following figure. Which conclusion is not supported by the age structure?
A) There will be large positive population growth in the near future.
B) There are more women than men between the ages of 60 and 70.
C) There will be small negative population growth in the near future.
D) There are more people between the ages of 25 to 39 then between 0 and 14.
A) There will be large positive population growth in the near future.
B) There are more women than men between the ages of 60 and 70.
C) There will be small negative population growth in the near future.
D) There are more people between the ages of 25 to 39 then between 0 and 14.
Unlock Deck
Unlock for access to all 57 flashcards in this deck.
Unlock Deck
k this deck
46
After reading the paragraph below, answer the questions that follow.
In southern Africa, jackals are major predators of livestock on farms. As a control measure, farmers often kill jackals they find on their farms. Scientists Liaan Minnie and colleagues predicted that increased mortality of jackals would result in altered life history traits of this carnivore species. To test their predictions, they compared the number of pregnant female jackals in different age classes in populations that were hunted (on farms) to those that were not hunted (in conservation reserves). The resulting pattern shown in the first graph is the proportion of females that are pregnant in each age class. The scientists also collected demographic data to construct age structure diagrams (second graph) of jackals in (a) hunted populations (farms) and (b) populations that were not hunted (reserves). In the age structure diagram, males are plotted on the left, females are plotted on the right, and the median age class is denoted with hatched bars.
Source: Minnie, L., Gaylard, A., & Kerley, G. I. (2016). Compensatory life‐history responses of a mesopredator may undermine carnivore management efforts. Journal of Applied Ecology, 53(2), 379-387.
Interpret the age structure diagram for jackals on farms compared to reserves.
A) Jackal populations on farms should expand; jackal populations in reserves should decline.
B) Jackal populations on farms should decline; jackal populations in reserves should expand.
C) Jackal populations should decline on farms and reserves.
D) Jackal populations should expand on farms and reserves.
In southern Africa, jackals are major predators of livestock on farms. As a control measure, farmers often kill jackals they find on their farms. Scientists Liaan Minnie and colleagues predicted that increased mortality of jackals would result in altered life history traits of this carnivore species. To test their predictions, they compared the number of pregnant female jackals in different age classes in populations that were hunted (on farms) to those that were not hunted (in conservation reserves). The resulting pattern shown in the first graph is the proportion of females that are pregnant in each age class. The scientists also collected demographic data to construct age structure diagrams (second graph) of jackals in (a) hunted populations (farms) and (b) populations that were not hunted (reserves). In the age structure diagram, males are plotted on the left, females are plotted on the right, and the median age class is denoted with hatched bars.
Source: Minnie, L., Gaylard, A., & Kerley, G. I. (2016). Compensatory life‐history responses of a mesopredator may undermine carnivore management efforts. Journal of Applied Ecology, 53(2), 379-387.Interpret the age structure diagram for jackals on farms compared to reserves.
A) Jackal populations on farms should expand; jackal populations in reserves should decline.
B) Jackal populations on farms should decline; jackal populations in reserves should expand.
C) Jackal populations should decline on farms and reserves.
D) Jackal populations should expand on farms and reserves.
Unlock Deck
Unlock for access to all 57 flashcards in this deck.
Unlock Deck
k this deck
47
Which activity would result in a decrease in your ecological footprint?
A) flying across the United States once a month
B) driving your car to and from school every day
C) leaving the water running while you brush your teeth
D) taking a city bus instead of driving to work
A) flying across the United States once a month
B) driving your car to and from school every day
C) leaving the water running while you brush your teeth
D) taking a city bus instead of driving to work
Unlock Deck
Unlock for access to all 57 flashcards in this deck.
Unlock Deck
k this deck
48
According to this graph of population growth in Mexico, in what year was the rate of population increase in Mexico the greatest?
A) 1912
B) 1930
C) 1965
D) 2000
A) 1912
B) 1930
C) 1965
D) 2000
Unlock Deck
Unlock for access to all 57 flashcards in this deck.
Unlock Deck
k this deck
49
After reading the paragraph below, answer the questions that follow.
An African family that has been displaced from their home by civil war is trying to select a new country in which to settle to gain better economic opportunities. Nigeria is a large country with rich natural resources, and the family is considering it for its new home. Among the data the family finds while researching Nigeria is the following diagram of the current age structure of the country.
The age structure data for Nigeria shows that the country has many more individuals under the age of 15 than over the age of 40. What does this imply about the future population of Nigeria?
A) The population will probably remain stable.
B) The population will probably decrease.
C) The population will probably grow rapidly.
D) The number of older people will probably increase rapidly.
Unlock Deck
Unlock for access to all 57 flashcards in this deck.
Unlock Deck
k this deck
50
Which statement regarding logistic growth is true?
A) The parameter (K − N)/K is always equal to zero.
B) There has to be more than one limiting factor in place for logistic growth to occur.
C) Population growth is highest when the population is much larger than the carrying capacity.
D) Population growth is zero when (K − N)/K is equal to zero.
A) The parameter (K − N)/K is always equal to zero.
B) There has to be more than one limiting factor in place for logistic growth to occur.
C) Population growth is highest when the population is much larger than the carrying capacity.
D) Population growth is zero when (K − N)/K is equal to zero.
Unlock Deck
Unlock for access to all 57 flashcards in this deck.
Unlock Deck
k this deck
51
After reading the paragraph below, answer the questions that follow.
An African family that has been displaced from their home by civil war is trying to select a new country in which to settle to gain better economic opportunities. Nigeria is a large country with rich natural resources, and the family is considering it for its new home. Among the data the family finds while researching Nigeria is the following diagram of the current age structure of the country.
Which statement about the age structure of Nigeria is true?
A) The populations of males and females ages 0 to 4 differ in size.
B) The population of males ages 15 to 19 is twice the population of females ages 5 to 9.
C) There are approximately 8 million males in Nigeria ages 0 to 14.
D) The population of females ages 40 to 44 is larger than the population of males ages 65 to 69.
Unlock Deck
Unlock for access to all 57 flashcards in this deck.
Unlock Deck
k this deck
52
Which is a practical application of population ecology that will result in population decline?
A) restricting the length of the deer hunting season
B) managing crops by selectively killing agricultural pests
C) removing habitat space from wild animal populations
D) preventing the overfishing of cod
A) restricting the length of the deer hunting season
B) managing crops by selectively killing agricultural pests
C) removing habitat space from wild animal populations
D) preventing the overfishing of cod
Unlock Deck
Unlock for access to all 57 flashcards in this deck.
Unlock Deck
k this deck
53
After reading the paragraph below, answer the questions that follow.
An African family that has been displaced from their home by civil war is trying to select a new country in which to settle to gain better economic opportunities. Nigeria is a large country with rich natural resources, and the family is considering it for its new home. Among the data the family finds while researching Nigeria is the following diagram of the current age structure of the country.
Based on the age structure of the country, what situation would be most likely to occur over the next 20 years?
A) strong economic gains stimulated by population growth
B) an increased demand for resources based on population growth
C) a decreased demand for medical services due to the small number of elderly citizens
D) a decline in housing prices based on lack of demand
Unlock Deck
Unlock for access to all 57 flashcards in this deck.
Unlock Deck
k this deck
54
If a population of 5,000 zebras is growing logistically and has a carrying capacity of 10,000, what would the per capita rate of increase be if the population grew by 50 zebras in 1 year?
A) 0.2
B) 0.1
C) 0.02
D) 0.01
A) 0.2
B) 0.1
C) 0.02
D) 0.01
Unlock Deck
Unlock for access to all 57 flashcards in this deck.
Unlock Deck
k this deck
55
A population of deer has a per capita rate of increase of 0.1 deer per year. If there are initially 300 deer in the population, and the population is growing exponentially, how many deer will be in the population after 1 year?
A) 30
B) 300
C) 330
D) 600
A) 30
B) 300
C) 330
D) 600
Unlock Deck
Unlock for access to all 57 flashcards in this deck.
Unlock Deck
k this deck
56
What kind of curve represents exponential growth?
A) ascending straight line
B) J-shaped
C) S-shaped
D) descending straight line
A) ascending straight line
B) J-shaped
C) S-shaped
D) descending straight line
Unlock Deck
Unlock for access to all 57 flashcards in this deck.
Unlock Deck
k this deck
57
According to this graph of the population growth of fur seals, in what year did the population first reach its carrying capacity?
A) 1925
B) 1930
C) 1940
D) 1950
A) 1925
B) 1930
C) 1940
D) 1950
Unlock Deck
Unlock for access to all 57 flashcards in this deck.
Unlock Deck
k this deck
Unlock Deck
Unlock for access to all 57 flashcards in this deck.


