Deck 12: Introduction to Simulation Using Analytic Solver Platform
Full screen (f)
Question
Question
Exhibit 12.2
The following questions use the information below.
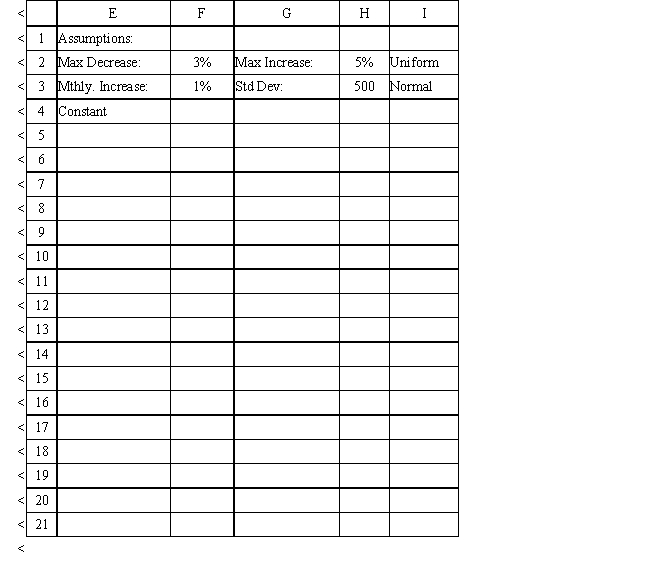
The owner of Fix-a-dent Auto Repair wants to study the growth of his business using simulation. He is interested in simulating the number of damaged cars and the amount of damage to the cars each month. He currently repairs 100 cars per month and feels the change in number of cars can vary uniformly between a decrease of as much as 3% and an increase of up to 5% (average change of 1%). The dollar value of the damage to the cars is a normally distributed random variable with a mean of $3,000 and a standard deviation of $500. The average repair bill has been increasing steadily over the years and the owner expects the mean repair bill will increase by 1% per month. A spreadsheet model to simulate the problem has been run 300 times. A part of the simulation statistics output from Risk Solver Platform (RSP)and a spreadsheet for computing confidence intervals follows.
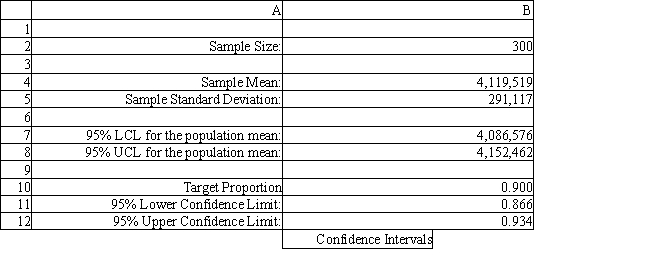
Using the information in Exhibit 12.2, what formula should go in cell B12 of the Confidence Intervals spreadsheet to compute the upper limit on a 95% confidence interval for the population proportion below 90%?
A) =B10+1.96*B10*(1-B10)/SQRT(B2)
B) =B10+1.96*SQRT(B10*(1-B10)/B2)
C) =B10+1.96*SQRT(B10*(1-B10)*B2)
D) =B10+1.96*B10*(1-B10)/B2
The following questions use the information below.
The owner of Fix-a-dent Auto Repair wants to study the growth of his business using simulation. He is interested in simulating the number of damaged cars and the amount of damage to the cars each month. He currently repairs 100 cars per month and feels the change in number of cars can vary uniformly between a decrease of as much as 3% and an increase of up to 5% (average change of 1%). The dollar value of the damage to the cars is a normally distributed random variable with a mean of $3,000 and a standard deviation of $500. The average repair bill has been increasing steadily over the years and the owner expects the mean repair bill will increase by 1% per month. A spreadsheet model to simulate the problem has been run 300 times. A part of the simulation statistics output from Risk Solver Platform (RSP)and a spreadsheet for computing confidence intervals follows.
Using the information in Exhibit 12.2, what formula should go in cell B12 of the Confidence Intervals spreadsheet to compute the upper limit on a 95% confidence interval for the population proportion below 90%?
A) =B10+1.96*B10*(1-B10)/SQRT(B2)
B) =B10+1.96*SQRT(B10*(1-B10)/B2)
C) =B10+1.96*SQRT(B10*(1-B10)*B2)
D) =B10+1.96*B10*(1-B10)/B2
Question
Question
Question
Question
Exhibit 12.3
The following questions use the information below.
An auto parts store wants to simulate its inventory system for engine oil. The company has collected data on the shipping time for oil and the daily demand for cases of oil. A case of oil generates a $10 profit. Customers can buy oil at any auto parts store so there are no backorders (the company loses the sale and profit). The company orders 30 cases whenever the inventory position falls below the reorder point of 15 cases. Orders are placed at the beginning of the day and delivered at the beginning of the day so the oil is available on the arrival day. An average service level of 99% is desired. The following spreadsheets have been developed for this problem. The company has simulated 2 weeks of operation for their inventory system. The current level of on-hand inventory is 25 units and no orders are pending.


The average demand is 4.45 cases per day. Using the information in Exhibit 12.3, what formula should go in cell H4 to determine the average lost sales?
A) =H3*4.45*10*30
B) =(1-H3)*4.45*10
C) =(1-H3)*4.45*30
D) =(1-H3)*4.45*10*30
The following questions use the information below.
An auto parts store wants to simulate its inventory system for engine oil. The company has collected data on the shipping time for oil and the daily demand for cases of oil. A case of oil generates a $10 profit. Customers can buy oil at any auto parts store so there are no backorders (the company loses the sale and profit). The company orders 30 cases whenever the inventory position falls below the reorder point of 15 cases. Orders are placed at the beginning of the day and delivered at the beginning of the day so the oil is available on the arrival day. An average service level of 99% is desired. The following spreadsheets have been developed for this problem. The company has simulated 2 weeks of operation for their inventory system. The current level of on-hand inventory is 25 units and no orders are pending.
The average demand is 4.45 cases per day. Using the information in Exhibit 12.3, what formula should go in cell H4 to determine the average lost sales?
A) =H3*4.45*10*30
B) =(1-H3)*4.45*10
C) =(1-H3)*4.45*30
D) =(1-H3)*4.45*10*30
Question
Question
Question
Question
Question
Question
Question
Question
Exhibit 12.3
The following questions use the information below.
An auto parts store wants to simulate its inventory system for engine oil. The company has collected data on the shipping time for oil and the daily demand for cases of oil. A case of oil generates a $10 profit. Customers can buy oil at any auto parts store so there are no backorders (the company loses the sale and profit). The company orders 30 cases whenever the inventory position falls below the reorder point of 15 cases. Orders are placed at the beginning of the day and delivered at the beginning of the day so the oil is available on the arrival day. An average service level of 99% is desired. The following spreadsheets have been developed for this problem. The company has simulated 2 weeks of operation for their inventory system. The current level of on-hand inventory is 25 units and no orders are pending.


Using the information in Exhibit 12.3, what formula should go in cell H8 to determine if an order should be placed?
A) =IF(G8<$D$3,1,0)
B) =IF(G8>$D$3,1,0)
C) =IF(G8<$D$3,0,1)
D) =IF(G8<$D$4,1,0)
The following questions use the information below.
An auto parts store wants to simulate its inventory system for engine oil. The company has collected data on the shipping time for oil and the daily demand for cases of oil. A case of oil generates a $10 profit. Customers can buy oil at any auto parts store so there are no backorders (the company loses the sale and profit). The company orders 30 cases whenever the inventory position falls below the reorder point of 15 cases. Orders are placed at the beginning of the day and delivered at the beginning of the day so the oil is available on the arrival day. An average service level of 99% is desired. The following spreadsheets have been developed for this problem. The company has simulated 2 weeks of operation for their inventory system. The current level of on-hand inventory is 25 units and no orders are pending.
Using the information in Exhibit 12.3, what formula should go in cell H8 to determine if an order should be placed?
A) =IF(G8<$D$3,1,0)
B) =IF(G8>$D$3,1,0)
C) =IF(G8<$D$3,0,1)
D) =IF(G8<$D$4,1,0)
Question
Question
Question
What is the correct Analytic Solver Platform function for generating random numbers from the following distribution on the number of children in families (assume a reference to the current worksheet). 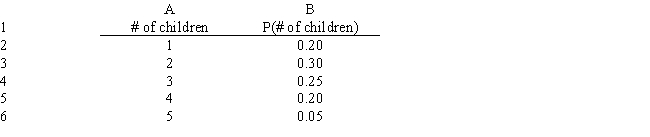
A) =PsiCustom(A2:A6,B2:B6)
B) =PsiRandom(A2:A6,B2:B6)
C) =PsiDiscrete(A2:A6,B2:B6)
D) =PsiUniform(A2:A6,B2:B6)
A) =PsiCustom(A2:A6,B2:B6)
B) =PsiRandom(A2:A6,B2:B6)
C) =PsiDiscrete(A2:A6,B2:B6)
D) =PsiUniform(A2:A6,B2:B6)
Question
Question
Exhibit 12.4.
The following questions use the information below.
The manager of a Washington, DC sightseeing tour company is concerned about overbooking for one of his bus tours. The bus has 15 seats but sometimes there are empty seats. His records show that about 20% of ticket holders do not show up for their tour. Tickets cost $10 and are non-refundable. If the manager overbooks the tour and more than 15 passengers show up, some of them will be bumped to a later tour. This bumping costs the company $25 in various expenses to keep the customer happy until the next tour. The manager wants to see what happens to profits if 18 reservations are accepted.
Using the information in Exhibit 12.4, what formula should go in cell C14 of the worksheet to determine the Cost of Bumping Passengers?
A) =C5*MAX(C10-C4,0)
B) =C5*MAX(C10,0)
C) =MAX(C10-C4,0)
D) =C5*MAX(C10,C4)
Question
Question
Question
Question
Exhibit 12.1
The following questions use the information below.
The owner of Fix-a-dent Auto Repair wants to study the growth of his business using simulation. He is interested in simulating the number of damaged cars and the amount of damage to the cars each month. He currently repairs 100 cars per month and feels this can vary uniformly between a decrease of as much as 3% and an increase of up to 5% (average change of 1%) over the previous months. The dollar value of the damage to the cars is a normally distributed random variable with a mean of $3,000 and a standard deviation of $500. The average repair bill has been increasing steadily over the years and the owner expects the mean repair bill will increase by 1% per month. You have created the following spreadsheet to simulate the problem.

Using the information in Exhibit 12.1, what formula should go cell G5 to calculate the 80th percentile of the empirical distribution of income?
A) =IF(RANK(D21) = 80, 1, 0)
B) None, use Excel Histogram on cell D21.
C) =IF(COUNTIF(D8:D19 > D21) ≥ 8, 1, 0)
D) =PsiPercentile(B21, .8).
The following questions use the information below.
The owner of Fix-a-dent Auto Repair wants to study the growth of his business using simulation. He is interested in simulating the number of damaged cars and the amount of damage to the cars each month. He currently repairs 100 cars per month and feels this can vary uniformly between a decrease of as much as 3% and an increase of up to 5% (average change of 1%) over the previous months. The dollar value of the damage to the cars is a normally distributed random variable with a mean of $3,000 and a standard deviation of $500. The average repair bill has been increasing steadily over the years and the owner expects the mean repair bill will increase by 1% per month. You have created the following spreadsheet to simulate the problem.
Using the information in Exhibit 12.1, what formula should go cell G5 to calculate the 80th percentile of the empirical distribution of income?
A) =IF(RANK(D21) = 80, 1, 0)
B) None, use Excel Histogram on cell D21.
C) =IF(COUNTIF(D8:D19 > D21) ≥ 8, 1, 0)
D) =PsiPercentile(B21, .8).
Question
Question
Question
Exhibit 12.3
The following questions use the information below.
An auto parts store wants to simulate its inventory system for engine oil. The company has collected data on the shipping time for oil and the daily demand for cases of oil. A case of oil generates a $10 profit. Customers can buy oil at any auto parts store so there are no backorders (the company loses the sale and profit). The company orders 30 cases whenever the inventory position falls below the reorder point of 15 cases. Orders are placed at the beginning of the day and delivered at the beginning of the day so the oil is available on the arrival day. An average service level of 99% is desired. The following spreadsheets have been developed for this problem. The company has simulated 2 weeks of operation for their inventory system. The current level of on-hand inventory is 25 units and no orders are pending.


Using the information in Exhibit 12.3, what Analytic Solver Platform function should be used in cell I8 to determine the lead time for an order?
A) =PsiDiscrete($B$6:$B$8, $C$6:$C$8)
B) =PsiPoisson(Data!$B$6:$B$8,$Data!$C$6:$C$8)
C) =PsiBinomial(Data!$B$6:$B$8,$Data!$C$6:$C$8)
D) =PsiNormal($B$6:$C$8)
The following questions use the information below.
An auto parts store wants to simulate its inventory system for engine oil. The company has collected data on the shipping time for oil and the daily demand for cases of oil. A case of oil generates a $10 profit. Customers can buy oil at any auto parts store so there are no backorders (the company loses the sale and profit). The company orders 30 cases whenever the inventory position falls below the reorder point of 15 cases. Orders are placed at the beginning of the day and delivered at the beginning of the day so the oil is available on the arrival day. An average service level of 99% is desired. The following spreadsheets have been developed for this problem. The company has simulated 2 weeks of operation for their inventory system. The current level of on-hand inventory is 25 units and no orders are pending.
Using the information in Exhibit 12.3, what Analytic Solver Platform function should be used in cell I8 to determine the lead time for an order?
A) =PsiDiscrete($B$6:$B$8, $C$6:$C$8)
B) =PsiPoisson(Data!$B$6:$B$8,$Data!$C$6:$C$8)
C) =PsiBinomial(Data!$B$6:$B$8,$Data!$C$6:$C$8)
D) =PsiNormal($B$6:$C$8)
Question
Question
Question
Question
Question
Exhibit 12.4.
The following questions use the information below.
The manager of a Washington, DC sightseeing tour company is concerned about overbooking for one of his bus tours. The bus has 15 seats but sometimes there are empty seats. His records show that about 20% of ticket holders do not show up for their tour. Tickets cost $10 and are non-refundable. If the manager overbooks the tour and more than 15 passengers show up, some of them will be bumped to a later tour. This bumping costs the company $25 in various expenses to keep the customer happy until the next tour. The manager wants to see what happens to profits if 18 reservations are accepted.
Using the information in Exhibit 12.4, what formula should go in cell C13 of the worksheet to determine the Opportunity Cost of Empty Seats?
A) =C5*MAX(C4,C10)
B) =C5*MAX(C4,0)
C) =MAX(C4-C10,0)
D) =C5*MAX(C4-C10,0)
Question
Question
Exhibit 12.3
The following questions use the information below.
An auto parts store wants to simulate its inventory system for engine oil. The company has collected data on the shipping time for oil and the daily demand for cases of oil. A case of oil generates a $10 profit. Customers can buy oil at any auto parts store so there are no backorders (the company loses the sale and profit). The company orders 30 cases whenever the inventory position falls below the reorder point of 15 cases. Orders are placed at the beginning of the day and delivered at the beginning of the day so the oil is available on the arrival day. An average service level of 99% is desired. The following spreadsheets have been developed for this problem. The company has simulated 2 weeks of operation for their inventory system. The current level of on-hand inventory is 25 units and no orders are pending.
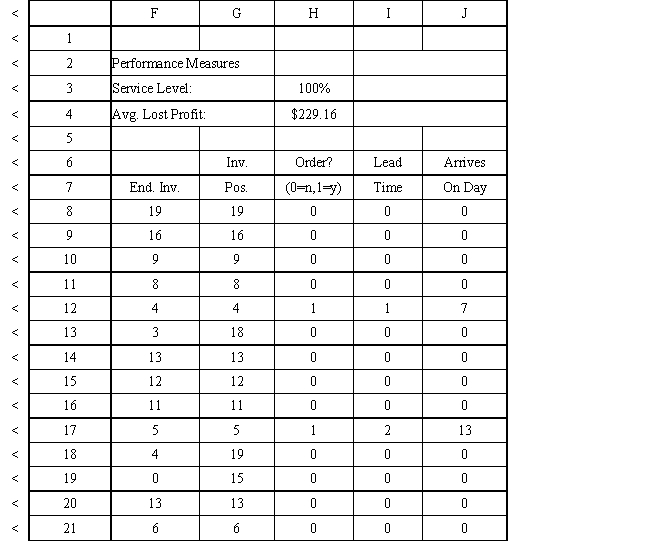

Using the information in Exhibit 12.3, what formula should go in cell C9 and copied to C10:C21 of the MODEL sheet to compute units received?
A) =COUNT($J$8:J8,A9)*$D$4
B) =COUNTIF($J$8:J8,A8)*$C$4
C) =COUNTIF($J$8:J8,A9)*$D$5
D) =COUNTIF($J$8:J8,A9)*$D$4
The following questions use the information below.
An auto parts store wants to simulate its inventory system for engine oil. The company has collected data on the shipping time for oil and the daily demand for cases of oil. A case of oil generates a $10 profit. Customers can buy oil at any auto parts store so there are no backorders (the company loses the sale and profit). The company orders 30 cases whenever the inventory position falls below the reorder point of 15 cases. Orders are placed at the beginning of the day and delivered at the beginning of the day so the oil is available on the arrival day. An average service level of 99% is desired. The following spreadsheets have been developed for this problem. The company has simulated 2 weeks of operation for their inventory system. The current level of on-hand inventory is 25 units and no orders are pending.
Using the information in Exhibit 12.3, what formula should go in cell C9 and copied to C10:C21 of the MODEL sheet to compute units received?
A) =COUNT($J$8:J8,A9)*$D$4
B) =COUNTIF($J$8:J8,A8)*$C$4
C) =COUNTIF($J$8:J8,A9)*$D$5
D) =COUNTIF($J$8:J8,A9)*$D$4
Question
Question
Question
Question
Question
Question
Question
Question
Question
Exhibit 12.2
The following questions use the information below.
The owner of Fix-a-dent Auto Repair wants to study the growth of his business using simulation. He is interested in simulating the number of damaged cars and the amount of damage to the cars each month. He currently repairs 100 cars per month and feels the change in number of cars can vary uniformly between a decrease of as much as 3% and an increase of up to 5% (average change of 1%). The dollar value of the damage to the cars is a normally distributed random variable with a mean of $3,000 and a standard deviation of $500. The average repair bill has been increasing steadily over the years and the owner expects the mean repair bill will increase by 1% per month. A spreadsheet model to simulate the problem has been run 300 times. A part of the simulation statistics output from Risk Solver Platform (RSP)and a spreadsheet for computing confidence intervals follows.

Using the information in Exhibit 12.2, what is the worst case scenario for the Fix-a-dent company based on this output?
A) $1,747,464.94
B) $3,339,249.82
C) $4,122,024.01
D) $4,207,301.98
The following questions use the information below.
The owner of Fix-a-dent Auto Repair wants to study the growth of his business using simulation. He is interested in simulating the number of damaged cars and the amount of damage to the cars each month. He currently repairs 100 cars per month and feels the change in number of cars can vary uniformly between a decrease of as much as 3% and an increase of up to 5% (average change of 1%). The dollar value of the damage to the cars is a normally distributed random variable with a mean of $3,000 and a standard deviation of $500. The average repair bill has been increasing steadily over the years and the owner expects the mean repair bill will increase by 1% per month. A spreadsheet model to simulate the problem has been run 300 times. A part of the simulation statistics output from Risk Solver Platform (RSP)and a spreadsheet for computing confidence intervals follows.
Using the information in Exhibit 12.2, what is the worst case scenario for the Fix-a-dent company based on this output?
A) $1,747,464.94
B) $3,339,249.82
C) $4,122,024.01
D) $4,207,301.98
Question
Question
Question
Exhibit 12.1
The following questions use the information below.
The owner of Fix-a-dent Auto Repair wants to study the growth of his business using simulation. He is interested in simulating the number of damaged cars and the amount of damage to the cars each month. He currently repairs 100 cars per month and feels this can vary uniformly between a decrease of as much as 3% and an increase of up to 5% (average change of 1%) over the previous months. The dollar value of the damage to the cars is a normally distributed random variable with a mean of $3,000 and a standard deviation of $500. The average repair bill has been increasing steadily over the years and the owner expects the mean repair bill will increase by 1% per month. You have created the following spreadsheet to simulate the problem.

Using the information in Exhibit 12.1, what Analytic Solver Platform function should go in cell B8 to compute the number of cars repaired in the first month?
A) =PsiUniform($C$2*(1-$F$2), $C$2*(1+$H$2))
B) =PsiUniform($C$2*1-$F$2, $C$2*1+$H$2)
C) =PsiUniform($C$2-(1-$F$2), $C$2+(1+$H$2))
D) =PsiUniform($C$2+(1-$F$2), $C$2+(1+$H$2))
The following questions use the information below.
The owner of Fix-a-dent Auto Repair wants to study the growth of his business using simulation. He is interested in simulating the number of damaged cars and the amount of damage to the cars each month. He currently repairs 100 cars per month and feels this can vary uniformly between a decrease of as much as 3% and an increase of up to 5% (average change of 1%) over the previous months. The dollar value of the damage to the cars is a normally distributed random variable with a mean of $3,000 and a standard deviation of $500. The average repair bill has been increasing steadily over the years and the owner expects the mean repair bill will increase by 1% per month. You have created the following spreadsheet to simulate the problem.
Using the information in Exhibit 12.1, what Analytic Solver Platform function should go in cell B8 to compute the number of cars repaired in the first month?
A) =PsiUniform($C$2*(1-$F$2), $C$2*(1+$H$2))
B) =PsiUniform($C$2*1-$F$2, $C$2*1+$H$2)
C) =PsiUniform($C$2-(1-$F$2), $C$2+(1+$H$2))
D) =PsiUniform($C$2+(1-$F$2), $C$2+(1+$H$2))
Question
Question
Question
Exhibit 12.4.
The following questions use the information below.
The manager of a Washington, DC sightseeing tour company is concerned about overbooking for one of his bus tours. The bus has 15 seats but sometimes there are empty seats. His records show that about 20% of ticket holders do not show up for their tour. Tickets cost $10 and are non-refundable. If the manager overbooks the tour and more than 15 passengers show up, some of them will be bumped to a later tour. This bumping costs the company $25 in various expenses to keep the customer happy until the next tour. The manager wants to see what happens to profits if 18 reservations are accepted.
Using the information in Exhibit 12.4, what Analytic Solver Platform function should be used in cell C10 to determine the number of Passengers to Board?
A) =PsiBinomial($C$8, 1-$C$6)
B) =PsiBinomial(1-$C$6, $C$8)
C) =PsiBinomial($C$8, $C$6)
D) =PsiBinomial($C$6, $C$8)
Question
Question
Question
Question
Question
Exhibit 12.2
The following questions use the information below.
The owner of Fix-a-dent Auto Repair wants to study the growth of his business using simulation. He is interested in simulating the number of damaged cars and the amount of damage to the cars each month. He currently repairs 100 cars per month and feels the change in number of cars can vary uniformly between a decrease of as much as 3% and an increase of up to 5% (average change of 1%). The dollar value of the damage to the cars is a normally distributed random variable with a mean of $3,000 and a standard deviation of $500. The average repair bill has been increasing steadily over the years and the owner expects the mean repair bill will increase by 1% per month. A spreadsheet model to simulate the problem has been run 300 times. A part of the simulation statistics output from Risk Solver Platform (RSP)and a spreadsheet for computing confidence intervals follows.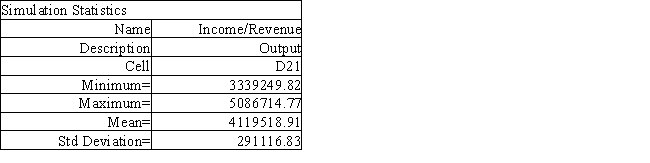

Using the information in Exhibit 12.2, what formula should go in cell B8 of the Confidence Intervals spreadsheet to compute the upper limit on a 95% confidence interval for the true population mean?
A) =B4+1.96*B5/SQRT(B2)
B) =B4+1.645*B5/SQRT(B2)
C) =B4-1.96*B5/SQRT(B2)
D) =B4+1.96*B5/B2
The following questions use the information below.
The owner of Fix-a-dent Auto Repair wants to study the growth of his business using simulation. He is interested in simulating the number of damaged cars and the amount of damage to the cars each month. He currently repairs 100 cars per month and feels the change in number of cars can vary uniformly between a decrease of as much as 3% and an increase of up to 5% (average change of 1%). The dollar value of the damage to the cars is a normally distributed random variable with a mean of $3,000 and a standard deviation of $500. The average repair bill has been increasing steadily over the years and the owner expects the mean repair bill will increase by 1% per month. A spreadsheet model to simulate the problem has been run 300 times. A part of the simulation statistics output from Risk Solver Platform (RSP)and a spreadsheet for computing confidence intervals follows.
Using the information in Exhibit 12.2, what formula should go in cell B8 of the Confidence Intervals spreadsheet to compute the upper limit on a 95% confidence interval for the true population mean?
A) =B4+1.96*B5/SQRT(B2)
B) =B4+1.645*B5/SQRT(B2)
C) =B4-1.96*B5/SQRT(B2)
D) =B4+1.96*B5/B2
Question
Question
Exhibit 12.1
The following questions use the information below.
The owner of Fix-a-dent Auto Repair wants to study the growth of his business using simulation. He is interested in simulating the number of damaged cars and the amount of damage to the cars each month. He currently repairs 100 cars per month and feels this can vary uniformly between a decrease of as much as 3% and an increase of up to 5% (average change of 1%) over the previous months. The dollar value of the damage to the cars is a normally distributed random variable with a mean of $3,000 and a standard deviation of $500. The average repair bill has been increasing steadily over the years and the owner expects the mean repair bill will increase by 1% per month. You have created the following spreadsheet to simulate the problem.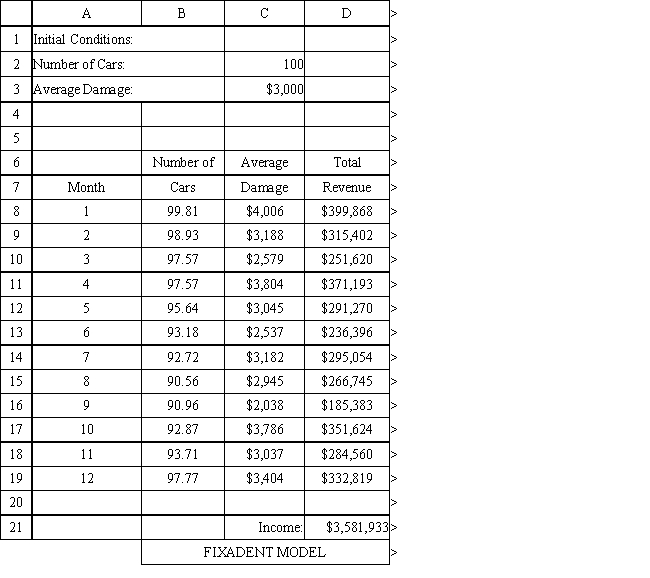
Using the information in Exhibit 12.1, what Analytic Solver Platform function should go in cell B9 and copied to B10:B19 to compute the number of cars repaired in the subsequent months?
A) =PsiUniform($B$8*(1+$F$2), $B$8*(1-$H$2))
B) =PsiUniform(B8*(1-$F$2), B8*(1+$H$2))
C) =PsiUniform($C$2*(1-$F$2), $C$2*(1+$H$2))
D) =PsiIntUniform($C$2*(1-$F$2), $C$2*(1+$H$2))
Question
Exhibit 12.4.
The following questions use the information below.
The manager of a Washington, DC sightseeing tour company is concerned about overbooking for one of his bus tours. The bus has 15 seats but sometimes there are empty seats. His records show that about 20% of ticket holders do not show up for their tour. Tickets cost $10 and are non-refundable. If the manager overbooks the tour and more than 15 passengers show up, some of them will be bumped to a later tour. This bumping costs the company $25 in various expenses to keep the customer happy until the next tour. The manager wants to see what happens to profits if 18 reservations are accepted.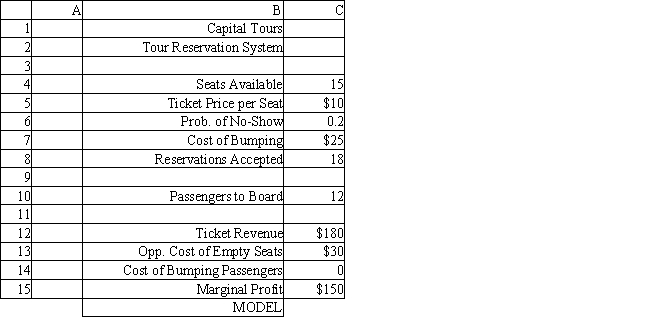
Using the information in Exhibit 12.4, what formula should go in cell C15 of the worksheet to determine the Marginal Profit?
A) =C12+C13+C14
B) =C12-C13-C14
C) =C12-C14+C13
D) =C12-(C13-C14)
Question
Exhibit 12.3
The following questions use the information below.
An auto parts store wants to simulate its inventory system for engine oil. The company has collected data on the shipping time for oil and the daily demand for cases of oil. A case of oil generates a $10 profit. Customers can buy oil at any auto parts store so there are no backorders (the company loses the sale and profit). The company orders 30 cases whenever the inventory position falls below the reorder point of 15 cases. Orders are placed at the beginning of the day and delivered at the beginning of the day so the oil is available on the arrival day. An average service level of 99% is desired. The following spreadsheets have been developed for this problem. The company has simulated 2 weeks of operation for their inventory system. The current level of on-hand inventory is 25 units and no orders are pending.


Using the information in Exhibit 12.3, what formula should go in cell H3 to compute the service level?
A) =SUM(G8:G21)/SUM(D8:D21)
B) =SUM(D8:D21)/SUM(E8:E21)
C) =SUM(E8:E21)/SUM(D8:D21)
D) =SUM(F8:F21)/SUM(G8:G21)
The following questions use the information below.
An auto parts store wants to simulate its inventory system for engine oil. The company has collected data on the shipping time for oil and the daily demand for cases of oil. A case of oil generates a $10 profit. Customers can buy oil at any auto parts store so there are no backorders (the company loses the sale and profit). The company orders 30 cases whenever the inventory position falls below the reorder point of 15 cases. Orders are placed at the beginning of the day and delivered at the beginning of the day so the oil is available on the arrival day. An average service level of 99% is desired. The following spreadsheets have been developed for this problem. The company has simulated 2 weeks of operation for their inventory system. The current level of on-hand inventory is 25 units and no orders are pending.
Using the information in Exhibit 12.3, what formula should go in cell H3 to compute the service level?
A) =SUM(G8:G21)/SUM(D8:D21)
B) =SUM(D8:D21)/SUM(E8:E21)
C) =SUM(E8:E21)/SUM(D8:D21)
D) =SUM(F8:F21)/SUM(G8:G21)
Question
Question
Exhibit 12.3
The following questions use the information below.
An auto parts store wants to simulate its inventory system for engine oil. The company has collected data on the shipping time for oil and the daily demand for cases of oil. A case of oil generates a $10 profit. Customers can buy oil at any auto parts store so there are no backorders (the company loses the sale and profit). The company orders 30 cases whenever the inventory position falls below the reorder point of 15 cases. Orders are placed at the beginning of the day and delivered at the beginning of the day so the oil is available on the arrival day. An average service level of 99% is desired. The following spreadsheets have been developed for this problem. The company has simulated 2 weeks of operation for their inventory system. The current level of on-hand inventory is 25 units and no orders are pending.


Using the information in Exhibit 12.3, what Analytic Solver Platform function should be used for generating a random shipping time based on the Data spreadsheet distribution for shipping time?
A) =PsiCumul($B$6:$C$8)
B) =PsiCustom($B$6:$B$8, $C$8:$C$8)
C) =PsiGeneral(Data!$B$6, probability $C$8)
D) =PsiDiscrete($B$6:$B$8, $C$8:$C$8)
The following questions use the information below.
An auto parts store wants to simulate its inventory system for engine oil. The company has collected data on the shipping time for oil and the daily demand for cases of oil. A case of oil generates a $10 profit. Customers can buy oil at any auto parts store so there are no backorders (the company loses the sale and profit). The company orders 30 cases whenever the inventory position falls below the reorder point of 15 cases. Orders are placed at the beginning of the day and delivered at the beginning of the day so the oil is available on the arrival day. An average service level of 99% is desired. The following spreadsheets have been developed for this problem. The company has simulated 2 weeks of operation for their inventory system. The current level of on-hand inventory is 25 units and no orders are pending.
Using the information in Exhibit 12.3, what Analytic Solver Platform function should be used for generating a random shipping time based on the Data spreadsheet distribution for shipping time?
A) =PsiCumul($B$6:$C$8)
B) =PsiCustom($B$6:$B$8, $C$8:$C$8)
C) =PsiGeneral(Data!$B$6, probability $C$8)
D) =PsiDiscrete($B$6:$B$8, $C$8:$C$8)
Question
Question
Exhibit 12.3
The following questions use the information below.
An auto parts store wants to simulate its inventory system for engine oil. The company has collected data on the shipping time for oil and the daily demand for cases of oil. A case of oil generates a $10 profit. Customers can buy oil at any auto parts store so there are no backorders (the company loses the sale and profit). The company orders 30 cases whenever the inventory position falls below the reorder point of 15 cases. Orders are placed at the beginning of the day and delivered at the beginning of the day so the oil is available on the arrival day. An average service level of 99% is desired. The following spreadsheets have been developed for this problem. The company has simulated 2 weeks of operation for their inventory system. The current level of on-hand inventory is 25 units and no orders are pending.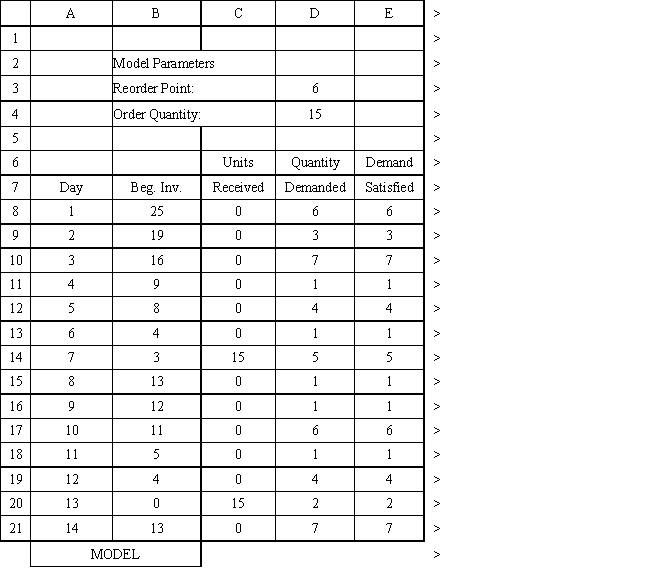


A variable whose value cannot be predicted or set with certainty is a
A) discrete variable
B) random variable
C) realistic variable
D) simulation variable
Instructions: Answer the following questions using the Analytic Solver Platform Excel add-in.
The following questions use the information below.
An auto parts store wants to simulate its inventory system for engine oil. The company has collected data on the shipping time for oil and the daily demand for cases of oil. A case of oil generates a $10 profit. Customers can buy oil at any auto parts store so there are no backorders (the company loses the sale and profit). The company orders 30 cases whenever the inventory position falls below the reorder point of 15 cases. Orders are placed at the beginning of the day and delivered at the beginning of the day so the oil is available on the arrival day. An average service level of 99% is desired. The following spreadsheets have been developed for this problem. The company has simulated 2 weeks of operation for their inventory system. The current level of on-hand inventory is 25 units and no orders are pending.
A variable whose value cannot be predicted or set with certainty is a
A) discrete variable
B) random variable
C) realistic variable
D) simulation variable
Instructions: Answer the following questions using the Analytic Solver Platform Excel add-in.
Question
Exhibit 12.5
The following questions use the information below.
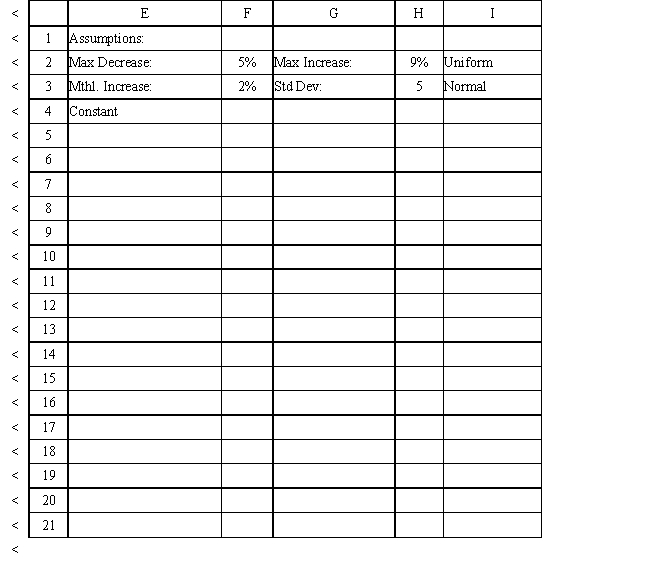
The owner of Sal's Italian Restaurant wants to study the growth of his business using simulation. He is interested in simulating the number of customers and the amount ordered by customers each month. He currently serves 1000 customers per month and feels this can vary uniformly between a decrease of as much as 5% and an increase of up to 9%. The bill for each customer is a normally distributed random variable with a mean of $20 and a standard deviation of $5. The average order has been increasing steadily over the years and the owner expects the mean order will increase by 2% per month. You have created the following spreadsheet to simulate the problem.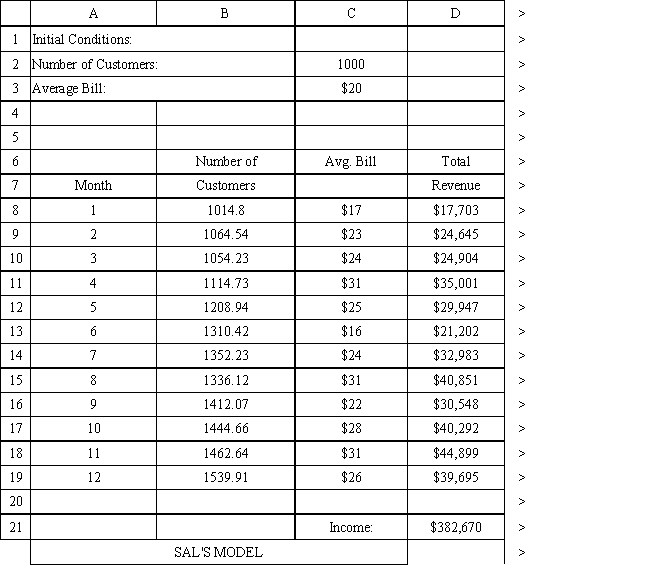
A simulation model was replicated 100 times yielding a mean of 82.59 with variance of 17.66. Of the 100 replications, 11 replications yielded an outcome over a value of 100. The 95% confidence interval of the mean is the interval (81.77, 83.41). Of the 100 simulation outcomes, 65 outcomes failed to fall within this interval. What is wrong with the confidence interval?
The following questions use the information below.
The owner of Sal's Italian Restaurant wants to study the growth of his business using simulation. He is interested in simulating the number of customers and the amount ordered by customers each month. He currently serves 1000 customers per month and feels this can vary uniformly between a decrease of as much as 5% and an increase of up to 9%. The bill for each customer is a normally distributed random variable with a mean of $20 and a standard deviation of $5. The average order has been increasing steadily over the years and the owner expects the mean order will increase by 2% per month. You have created the following spreadsheet to simulate the problem.
A simulation model was replicated 100 times yielding a mean of 82.59 with variance of 17.66. Of the 100 replications, 11 replications yielded an outcome over a value of 100. The 95% confidence interval of the mean is the interval (81.77, 83.41). Of the 100 simulation outcomes, 65 outcomes failed to fall within this interval. What is wrong with the confidence interval?
Question
Exhibit 12.5
The following questions use the information below.
The owner of Sal's Italian Restaurant wants to study the growth of his business using simulation. He is interested in simulating the number of customers and the amount ordered by customers each month. He currently serves 1000 customers per month and feels this can vary uniformly between a decrease of as much as 5% and an increase of up to 9%. The bill for each customer is a normally distributed random variable with a mean of $20 and a standard deviation of $5. The average order has been increasing steadily over the years and the owner expects the mean order will increase by 2% per month. You have created the following spreadsheet to simulate the problem.
The spreadsheet model for Sal, from Exhibit 12.5, has been run 300 times to produce the following output. What is the best case scenario for Sal based on this output?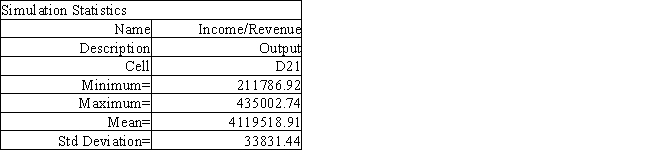 Instructions: Answer the following questions using the Analytic Solver Platform Excel add-in.
The following questions use the information below.
The owner of Sal's Italian Restaurant wants to study the growth of his business using simulation. He is interested in simulating the number of customers and the amount ordered by customers each month. He currently serves 1000 customers per month and feels this can vary uniformly between a decrease of as much as 5% and an increase of up to 9%. The bill for each customer is a normally distributed random variable with a mean of $20 and a standard deviation of $5. The average order has been increasing steadily over the years and the owner expects the mean order will increase by 2% per month. You have created the following spreadsheet to simulate the problem.
The spreadsheet model for Sal, from Exhibit 12.5, has been run 300 times to produce the following output. What is the best case scenario for Sal based on this output?
Instructions: Answer the following questions using the Analytic Solver Platform Excel add-in. Question
Exhibit 12.5
The following questions use the information below.
The owner of Sal's Italian Restaurant wants to study the growth of his business using simulation. He is interested in simulating the number of customers and the amount ordered by customers each month. He currently serves 1000 customers per month and feels this can vary uniformly between a decrease of as much as 5% and an increase of up to 9%. The bill for each customer is a normally distributed random variable with a mean of $20 and a standard deviation of $5. The average order has been increasing steadily over the years and the owner expects the mean order will increase by 2% per month. You have created the following spreadsheet to simulate the problem.

Sal, from Exhibit 12.5, has produced the following spreadsheet to compute confidence intervals on his income. What formula should go in cell B12 to compute the upper limit on a 95% confidence interval for the population proportion below 90%?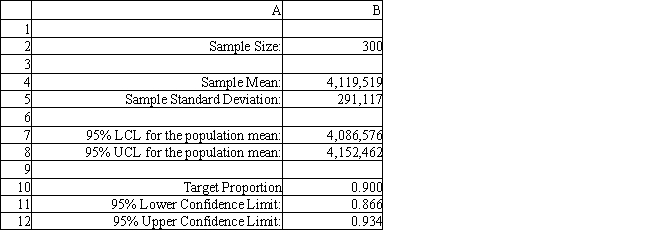 Instructions: Answer the following questions using the Analytic Solver Platform Excel add-in.
The following questions use the information below.
The owner of Sal's Italian Restaurant wants to study the growth of his business using simulation. He is interested in simulating the number of customers and the amount ordered by customers each month. He currently serves 1000 customers per month and feels this can vary uniformly between a decrease of as much as 5% and an increase of up to 9%. The bill for each customer is a normally distributed random variable with a mean of $20 and a standard deviation of $5. The average order has been increasing steadily over the years and the owner expects the mean order will increase by 2% per month. You have created the following spreadsheet to simulate the problem.
Sal, from Exhibit 12.5, has produced the following spreadsheet to compute confidence intervals on his income. What formula should go in cell B12 to compute the upper limit on a 95% confidence interval for the population proportion below 90%?
Instructions: Answer the following questions using the Analytic Solver Platform Excel add-in. Question
Exhibit 12.5
The following questions use the information below.
The owner of Sal's Italian Restaurant wants to study the growth of his business using simulation. He is interested in simulating the number of customers and the amount ordered by customers each month. He currently serves 1000 customers per month and feels this can vary uniformly between a decrease of as much as 5% and an increase of up to 9%. The bill for each customer is a normally distributed random variable with a mean of $20 and a standard deviation of $5. The average order has been increasing steadily over the years and the owner expects the mean order will increase by 2% per month. You have created the following spreadsheet to simulate the problem.
What function should be used for generating random numbers from a normal distribution with mean μ and standard deviation σ?
Question
Exhibit 12.5
The following questions use the information below.
The owner of Sal's Italian Restaurant wants to study the growth of his business using simulation. He is interested in simulating the number of customers and the amount ordered by customers each month. He currently serves 1000 customers per month and feels this can vary uniformly between a decrease of as much as 5% and an increase of up to 9%. The bill for each customer is a normally distributed random variable with a mean of $20 and a standard deviation of $5. The average order has been increasing steadily over the years and the owner expects the mean order will increase by 2% per month. You have created the following spreadsheet to simulate the problem.
A machine produces an average of 500 parts per day with a standard deviation of 10 parts. This is a normally distributed variable. The percent of defective parts ranges from 8-12%. Parts which need minor repair comprise 75% of the defective parts and cost $5 to repair. The rest of the defective parts cost $20 to repair. What formulas should go in cells B8:B15 to compute the daily cost of defective parts?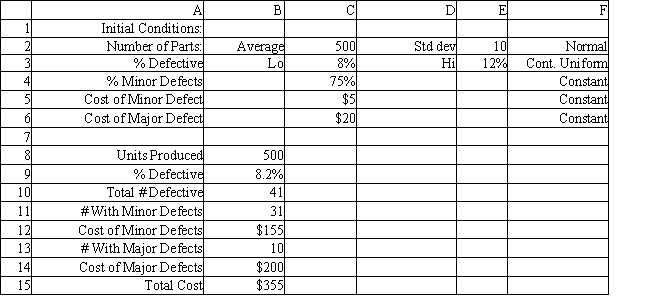 Instructions: Answer the following questions using the Analytic Solver Platform Excel add-in.
The following questions use the information below.
The owner of Sal's Italian Restaurant wants to study the growth of his business using simulation. He is interested in simulating the number of customers and the amount ordered by customers each month. He currently serves 1000 customers per month and feels this can vary uniformly between a decrease of as much as 5% and an increase of up to 9%. The bill for each customer is a normally distributed random variable with a mean of $20 and a standard deviation of $5. The average order has been increasing steadily over the years and the owner expects the mean order will increase by 2% per month. You have created the following spreadsheet to simulate the problem.
A machine produces an average of 500 parts per day with a standard deviation of 10 parts. This is a normally distributed variable. The percent of defective parts ranges from 8-12%. Parts which need minor repair comprise 75% of the defective parts and cost $5 to repair. The rest of the defective parts cost $20 to repair. What formulas should go in cells B8:B15 to compute the daily cost of defective parts?
Instructions: Answer the following questions using the Analytic Solver Platform Excel add-in. Question
Exhibit 12.5
The following questions use the information below.
The owner of Sal's Italian Restaurant wants to study the growth of his business using simulation. He is interested in simulating the number of customers and the amount ordered by customers each month. He currently serves 1000 customers per month and feels this can vary uniformly between a decrease of as much as 5% and an increase of up to 9%. The bill for each customer is a normally distributed random variable with a mean of $20 and a standard deviation of $5. The average order has been increasing steadily over the years and the owner expects the mean order will increase by 2% per month. You have created the following spreadsheet to simulate the problem.
What function should be used for generating random integer numbers between 2 and 8?
Question
Exhibit 12.5
The following questions use the information below.
The owner of Sal's Italian Restaurant wants to study the growth of his business using simulation. He is interested in simulating the number of customers and the amount ordered by customers each month. He currently serves 1000 customers per month and feels this can vary uniformly between a decrease of as much as 5% and an increase of up to 9%. The bill for each customer is a normally distributed random variable with a mean of $20 and a standard deviation of $5. The average order has been increasing steadily over the years and the owner expects the mean order will increase by 2% per month. You have created the following spreadsheet to simulate the problem.
What function should be used for generating random numbers from a normal distribution with mean μ and standard deviation σ between the values of a and b only?
Question
Exhibit 12.3
The following questions use the information below.
An auto parts store wants to simulate its inventory system for engine oil. The company has collected data on the shipping time for oil and the daily demand for cases of oil. A case of oil generates a $10 profit. Customers can buy oil at any auto parts store so there are no backorders (the company loses the sale and profit). The company orders 30 cases whenever the inventory position falls below the reorder point of 15 cases. Orders are placed at the beginning of the day and delivered at the beginning of the day so the oil is available on the arrival day. An average service level of 99% is desired. The following spreadsheets have been developed for this problem. The company has simulated 2 weeks of operation for their inventory system. The current level of on-hand inventory is 25 units and no orders are pending.
Jim Johnson operates a bus service to take college students to "The Big City" on Friday night and bring them back to school on Sunday night. The bus has 45 seats but sometimes there are empty seats. His records show that about 5% of ticket holders do not show up for their ride. Tickets cost $20 and are non-refundable. If Jim overbooks the bus and more than 45 passengers show up, some of them will be bumped and have to miss the trip. This bumping costs the company $40 because Jim has a double-your-money back policy for bumped passengers. Jim wants to see what happens to profits if 48 reservations are accepted.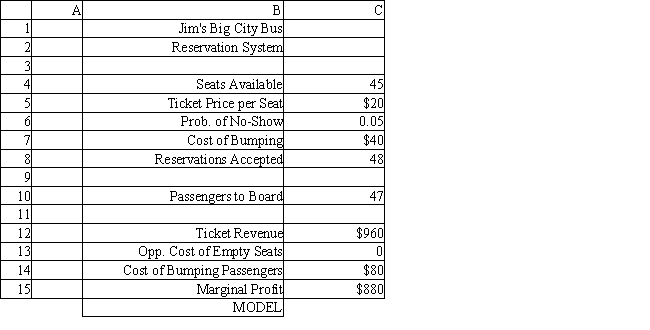 What formulas should go in cell C10 − C15 of the worksheet?
The following questions use the information below.
An auto parts store wants to simulate its inventory system for engine oil. The company has collected data on the shipping time for oil and the daily demand for cases of oil. A case of oil generates a $10 profit. Customers can buy oil at any auto parts store so there are no backorders (the company loses the sale and profit). The company orders 30 cases whenever the inventory position falls below the reorder point of 15 cases. Orders are placed at the beginning of the day and delivered at the beginning of the day so the oil is available on the arrival day. An average service level of 99% is desired. The following spreadsheets have been developed for this problem. The company has simulated 2 weeks of operation for their inventory system. The current level of on-hand inventory is 25 units and no orders are pending.
Jim Johnson operates a bus service to take college students to "The Big City" on Friday night and bring them back to school on Sunday night. The bus has 45 seats but sometimes there are empty seats. His records show that about 5% of ticket holders do not show up for their ride. Tickets cost $20 and are non-refundable. If Jim overbooks the bus and more than 45 passengers show up, some of them will be bumped and have to miss the trip. This bumping costs the company $40 because Jim has a double-your-money back policy for bumped passengers. Jim wants to see what happens to profits if 48 reservations are accepted.
What formulas should go in cell C10 − C15 of the worksheet? Question
Exhibit 12.5
The following questions use the information below.
The owner of Sal's Italian Restaurant wants to study the growth of his business using simulation. He is interested in simulating the number of customers and the amount ordered by customers each month. He currently serves 1000 customers per month and feels this can vary uniformly between a decrease of as much as 5% and an increase of up to 9%. The bill for each customer is a normally distributed random variable with a mean of $20 and a standard deviation of $5. The average order has been increasing steadily over the years and the owner expects the mean order will increase by 2% per month. You have created the following spreadsheet to simulate the problem.
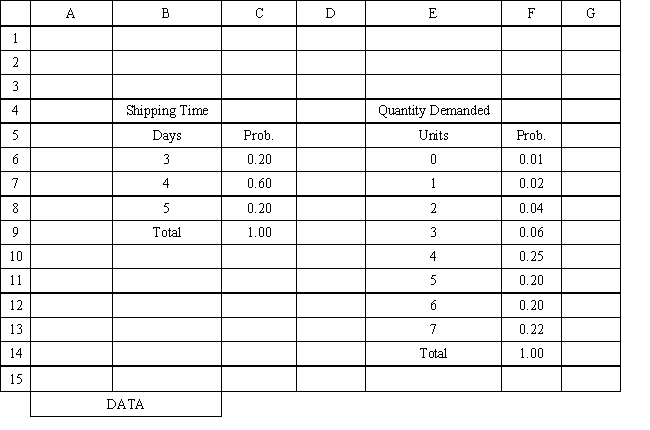
What is the expected number of phone calls per hour based on the following distribution on the number of phone calls per hour?
The following questions use the information below.
The owner of Sal's Italian Restaurant wants to study the growth of his business using simulation. He is interested in simulating the number of customers and the amount ordered by customers each month. He currently serves 1000 customers per month and feels this can vary uniformly between a decrease of as much as 5% and an increase of up to 9%. The bill for each customer is a normally distributed random variable with a mean of $20 and a standard deviation of $5. The average order has been increasing steadily over the years and the owner expects the mean order will increase by 2% per month. You have created the following spreadsheet to simulate the problem.
What is the expected number of phone calls per hour based on the following distribution on the number of phone calls per hour?
Question
Exhibit 12.3
The following questions use the information below.
An auto parts store wants to simulate its inventory system for engine oil. The company has collected data on the shipping time for oil and the daily demand for cases of oil. A case of oil generates a $10 profit. Customers can buy oil at any auto parts store so there are no backorders (the company loses the sale and profit). The company orders 30 cases whenever the inventory position falls below the reorder point of 15 cases. Orders are placed at the beginning of the day and delivered at the beginning of the day so the oil is available on the arrival day. An average service level of 99% is desired. The following spreadsheets have been developed for this problem. The company has simulated 2 weeks of operation for their inventory system. The current level of on-hand inventory is 25 units and no orders are pending.

Why would a manager be interested in analyzing risk?
A) To determine a most likely outcome.
B) To determine a range of outcomes.
C) To determine a distribution of outcomes.
D) To determine a confidence interval on most likely outcomes.
The following questions use the information below.
An auto parts store wants to simulate its inventory system for engine oil. The company has collected data on the shipping time for oil and the daily demand for cases of oil. A case of oil generates a $10 profit. Customers can buy oil at any auto parts store so there are no backorders (the company loses the sale and profit). The company orders 30 cases whenever the inventory position falls below the reorder point of 15 cases. Orders are placed at the beginning of the day and delivered at the beginning of the day so the oil is available on the arrival day. An average service level of 99% is desired. The following spreadsheets have been developed for this problem. The company has simulated 2 weeks of operation for their inventory system. The current level of on-hand inventory is 25 units and no orders are pending.
Why would a manager be interested in analyzing risk?
A) To determine a most likely outcome.
B) To determine a range of outcomes.
C) To determine a distribution of outcomes.
D) To determine a confidence interval on most likely outcomes.
Question
Exhibit 12.5
The following questions use the information below.
The owner of Sal's Italian Restaurant wants to study the growth of his business using simulation. He is interested in simulating the number of customers and the amount ordered by customers each month. He currently serves 1000 customers per month and feels this can vary uniformly between a decrease of as much as 5% and an increase of up to 9%. The bill for each customer is a normally distributed random variable with a mean of $20 and a standard deviation of $5. The average order has been increasing steadily over the years and the owner expects the mean order will increase by 2% per month. You have created the following spreadsheet to simulate the problem.
A simulation model was replicated 100 times yielding a mean of 82.59 with variance of 17.66. Of the 100 replications, 11 replications yielded an outcome over a value of 100. What is the 95% confidence interval on the proportion of simulations whose outcomes exceeded a value of 100?
Question
Exhibit 12.5
The following questions use the information below.
The owner of Sal's Italian Restaurant wants to study the growth of his business using simulation. He is interested in simulating the number of customers and the amount ordered by customers each month. He currently serves 1000 customers per month and feels this can vary uniformly between a decrease of as much as 5% and an increase of up to 9%. The bill for each customer is a normally distributed random variable with a mean of $20 and a standard deviation of $5. The average order has been increasing steadily over the years and the owner expects the mean order will increase by 2% per month. You have created the following spreadsheet to simulate the problem.
University Florists makes bouquets from a variety of materials. The Daily Special Bouquet is priced at $20. The florist assembles this bouquet each day from a variety of low cost flowers he buys from his flower supplier. The actual cost of flowers ranges uniformly from $2 to $7, with all intermediate values being equally likely. The florist (who studied management science many years ago) knows that the time to assemble a bouquet is normally distributed with a mean time of 5 minutes and standard deviation of 1 minute. This will be the time required for all of the Daily Special Bouquets for that day. The florist values his labor time at $10 per hour. Sales are normally distributed with a mean of 10 bouquets per day with a standard deviation of 1 bouquet. What formulas should go in cells B8:B14 to simulate daily profits for the store?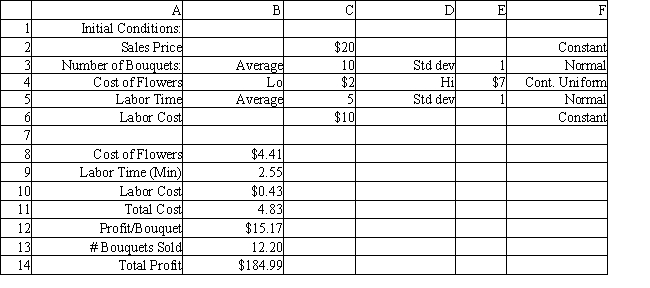 Instructions: Answer the following questions using the Analytic Solver Platform Excel add-in.
The following questions use the information below.
The owner of Sal's Italian Restaurant wants to study the growth of his business using simulation. He is interested in simulating the number of customers and the amount ordered by customers each month. He currently serves 1000 customers per month and feels this can vary uniformly between a decrease of as much as 5% and an increase of up to 9%. The bill for each customer is a normally distributed random variable with a mean of $20 and a standard deviation of $5. The average order has been increasing steadily over the years and the owner expects the mean order will increase by 2% per month. You have created the following spreadsheet to simulate the problem.
University Florists makes bouquets from a variety of materials. The Daily Special Bouquet is priced at $20. The florist assembles this bouquet each day from a variety of low cost flowers he buys from his flower supplier. The actual cost of flowers ranges uniformly from $2 to $7, with all intermediate values being equally likely. The florist (who studied management science many years ago) knows that the time to assemble a bouquet is normally distributed with a mean time of 5 minutes and standard deviation of 1 minute. This will be the time required for all of the Daily Special Bouquets for that day. The florist values his labor time at $10 per hour. Sales are normally distributed with a mean of 10 bouquets per day with a standard deviation of 1 bouquet. What formulas should go in cells B8:B14 to simulate daily profits for the store?
Instructions: Answer the following questions using the Analytic Solver Platform Excel add-in. Question
Exhibit 12.5
The following questions use the information below.
The owner of Sal's Italian Restaurant wants to study the growth of his business using simulation. He is interested in simulating the number of customers and the amount ordered by customers each month. He currently serves 1000 customers per month and feels this can vary uniformly between a decrease of as much as 5% and an increase of up to 9%. The bill for each customer is a normally distributed random variable with a mean of $20 and a standard deviation of $5. The average order has been increasing steadily over the years and the owner expects the mean order will increase by 2% per month. You have created the following spreadsheet to simulate the problem.
What function should be used for generating random numbers from the following distribution on the number of phone calls per hour?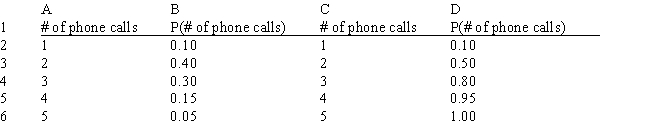
Question
Exhibit 12.3
The following questions use the information below.
An auto parts store wants to simulate its inventory system for engine oil. The company has collected data on the shipping time for oil and the daily demand for cases of oil. A case of oil generates a $10 profit. Customers can buy oil at any auto parts store so there are no backorders (the company loses the sale and profit). The company orders 30 cases whenever the inventory position falls below the reorder point of 15 cases. Orders are placed at the beginning of the day and delivered at the beginning of the day so the oil is available on the arrival day. An average service level of 99% is desired. The following spreadsheets have been developed for this problem. The company has simulated 2 weeks of operation for their inventory system. The current level of on-hand inventory is 25 units and no orders are pending.
A simulation model was replicated 100 times yielding a mean of 82.59 with variance of 17.66. Of the 100 replications, 11 replications yielded an outcome over a value of 100. What is the 90% confidence interval on the mean?
Instructions: Answer the following questions using the Analytic Solver Platform Excel add-in.
Question
Exhibit 12.5
The following questions use the information below.
The owner of Sal's Italian Restaurant wants to study the growth of his business using simulation. He is interested in simulating the number of customers and the amount ordered by customers each month. He currently serves 1000 customers per month and feels this can vary uniformly between a decrease of as much as 5% and an increase of up to 9%. The bill for each customer is a normally distributed random variable with a mean of $20 and a standard deviation of $5. The average order has been increasing steadily over the years and the owner expects the mean order will increase by 2% per month. You have created the following spreadsheet to simulate the problem.
What is the probability that 3 or more phone calls are received in any hour of operation? Instructions: Answer the following questions using the Analytic Solver Platform Excel add-in.
The following questions use the information below.
The owner of Sal's Italian Restaurant wants to study the growth of his business using simulation. He is interested in simulating the number of customers and the amount ordered by customers each month. He currently serves 1000 customers per month and feels this can vary uniformly between a decrease of as much as 5% and an increase of up to 9%. The bill for each customer is a normally distributed random variable with a mean of $20 and a standard deviation of $5. The average order has been increasing steadily over the years and the owner expects the mean order will increase by 2% per month. You have created the following spreadsheet to simulate the problem.
What is the probability that 3 or more phone calls are received in any hour of operation?
Instructions: Answer the following questions using the Analytic Solver Platform Excel add-in. Question
Exhibit 12.5
The following questions use the information below.
The owner of Sal's Italian Restaurant wants to study the growth of his business using simulation. He is interested in simulating the number of customers and the amount ordered by customers each month. He currently serves 1000 customers per month and feels this can vary uniformly between a decrease of as much as 5% and an increase of up to 9%. The bill for each customer is a normally distributed random variable with a mean of $20 and a standard deviation of $5. The average order has been increasing steadily over the years and the owner expects the mean order will increase by 2% per month. You have created the following spreadsheet to simulate the problem.
Sal, from Exhibit 12.5, has produced the following spreadsheet to compute confidence intervals on his income. What formula should go in cell B8 to compute the upper limit on a 95% confidence interval for the true population mean?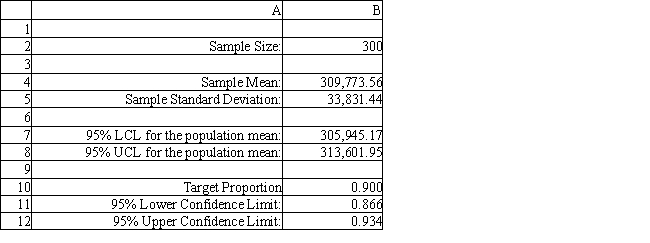
Question
Exhibit 12.5
The following questions use the information below.
The owner of Sal's Italian Restaurant wants to study the growth of his business using simulation. He is interested in simulating the number of customers and the amount ordered by customers each month. He currently serves 1000 customers per month and feels this can vary uniformly between a decrease of as much as 5% and an increase of up to 9%. The bill for each customer is a normally distributed random variable with a mean of $20 and a standard deviation of $5. The average order has been increasing steadily over the years and the owner expects the mean order will increase by 2% per month. You have created the following spreadsheet to simulate the problem.
What gallery distribution should be used for generating the number of times "tails" come up over 15 flips of a "fair" coin?
Question
Exhibit 12.3
The following questions use the information below.
An auto parts store wants to simulate its inventory system for engine oil. The company has collected data on the shipping time for oil and the daily demand for cases of oil. A case of oil generates a $10 profit. Customers can buy oil at any auto parts store so there are no backorders (the company loses the sale and profit). The company orders 30 cases whenever the inventory position falls below the reorder point of 15 cases. Orders are placed at the beginning of the day and delivered at the beginning of the day so the oil is available on the arrival day. An average service level of 99% is desired. The following spreadsheets have been developed for this problem. The company has simulated 2 weeks of operation for their inventory system. The current level of on-hand inventory is 25 units and no orders are pending.
Using the information in Exhibit 12.3, what formula should go in cell J8 to determine the arrival date for an order?
A) =IF(I8=0,0,A8+I8)
B) =IF(I8=0,0,A8+1+I8)
C) =IF(I8=1,0,A8+1+I8)
D) =IF(I8=0,A8+1+I8,0)
Question
Exhibit 12.3
The following questions use the information below.
An auto parts store wants to simulate its inventory system for engine oil. The company has collected data on the shipping time for oil and the daily demand for cases of oil. A case of oil generates a $10 profit. Customers can buy oil at any auto parts store so there are no backorders (the company loses the sale and profit). The company orders 30 cases whenever the inventory position falls below the reorder point of 15 cases. Orders are placed at the beginning of the day and delivered at the beginning of the day so the oil is available on the arrival day. An average service level of 99% is desired. The following spreadsheets have been developed for this problem. The company has simulated 2 weeks of operation for their inventory system. The current level of on-hand inventory is 25 units and no orders are pending.
Using the information in Exhibit 12.3, what formula should go in cell G9 to compute inventory position?
A) =G8+E9-IF(H8=1,$D$4,0)
B) =G8-E9+IF(H8=1,$D$4,0)
C) =G8-E9+IF(H8=1,$D$5,0)
D) =G8-E9+IF(H8=1,0,$D$4)

Unlock Deck
Sign up to unlock the cards in this deck!
Unlock Deck
Unlock Deck
1/85
Play
Full screen (f)
Deck 12: Introduction to Simulation Using Analytic Solver Platform
1
One of Analytic Solver Platform's amazing capabilities is its ability to perform interactive simulation.
True
2
Exhibit 12.2
The following questions use the information below.
The owner of Fix-a-dent Auto Repair wants to study the growth of his business using simulation. He is interested in simulating the number of damaged cars and the amount of damage to the cars each month. He currently repairs 100 cars per month and feels the change in number of cars can vary uniformly between a decrease of as much as 3% and an increase of up to 5% (average change of 1%). The dollar value of the damage to the cars is a normally distributed random variable with a mean of $3,000 and a standard deviation of $500. The average repair bill has been increasing steadily over the years and the owner expects the mean repair bill will increase by 1% per month. A spreadsheet model to simulate the problem has been run 300 times. A part of the simulation statistics output from Risk Solver Platform (RSP)and a spreadsheet for computing confidence intervals follows.
Using the information in Exhibit 12.2, what formula should go in cell B12 of the Confidence Intervals spreadsheet to compute the upper limit on a 95% confidence interval for the population proportion below 90%?
A) =B10+1.96*B10*(1-B10)/SQRT(B2)
B) =B10+1.96*SQRT(B10*(1-B10)/B2)
C) =B10+1.96*SQRT(B10*(1-B10)*B2)
D) =B10+1.96*B10*(1-B10)/B2
=B10+1.96*SQRT(B10*(1-B10)/B2)
3
The term "risk" also implies the potential for loss.
True
4
To perform simulation in a spreadsheet, we must first place a random number generator (RNG) formula in each cell that represents a random, or uncertain, independent variable.
Unlock Deck
Unlock for access to all 85 flashcards in this deck.
Unlock Deck
k this deck
5
The educational version of Analytic Solver Platform has no limit on the number of trials per simulation.
Unlock Deck
Unlock for access to all 85 flashcards in this deck.
Unlock Deck
k this deck
6
Exhibit 12.3
The following questions use the information below.
An auto parts store wants to simulate its inventory system for engine oil. The company has collected data on the shipping time for oil and the daily demand for cases of oil. A case of oil generates a $10 profit. Customers can buy oil at any auto parts store so there are no backorders (the company loses the sale and profit). The company orders 30 cases whenever the inventory position falls below the reorder point of 15 cases. Orders are placed at the beginning of the day and delivered at the beginning of the day so the oil is available on the arrival day. An average service level of 99% is desired. The following spreadsheets have been developed for this problem. The company has simulated 2 weeks of operation for their inventory system. The current level of on-hand inventory is 25 units and no orders are pending.
The average demand is 4.45 cases per day. Using the information in Exhibit 12.3, what formula should go in cell H4 to determine the average lost sales?
A) =H3*4.45*10*30
B) =(1-H3)*4.45*10
C) =(1-H3)*4.45*30
D) =(1-H3)*4.45*10*30
Unlock Deck
Unlock for access to all 85 flashcards in this deck.
Unlock Deck
k this deck
7
In the face of uncertainty, some people react with paralysis, or they do exhaustive research to avoid making a decision.
Unlock Deck
Unlock for access to all 85 flashcards in this deck.
Unlock Deck
k this deck
8
The best-case analysis approach to risk analysis
A) is optimistic
B) is pessimistic
C) is most likely
D) is likely to produce good outcomes
A) is optimistic
B) is pessimistic
C) is most likely
D) is likely to produce good outcomes
Unlock Deck
Unlock for access to all 85 flashcards in this deck.
Unlock Deck
k this deck
9
If you have historical data for any of the random variables in your model, you can use this dialog to instruct Analytic Solver Platform to automatically identify and suggest appropriate probability distributions for your data.
Unlock Deck
Unlock for access to all 85 flashcards in this deck.
Unlock Deck
k this deck
10
The historical data itself can be sampled from using Analytic Solver Platform's PsiDisUniform( ), PsiResample( ), PsiSip( ) or PsiSlurp( ) functions.
Unlock Deck
Unlock for access to all 85 flashcards in this deck.
Unlock Deck
k this deck
11
If chance or uncertainty is present in a system then there is an element of ____ in the decision-making problem.
A) danger
B) security
C) risk
D) difficulty
A) danger
B) security
C) risk
D) difficulty
Unlock Deck
Unlock for access to all 85 flashcards in this deck.
Unlock Deck
k this deck
12
In general there are two primary issues involved in risk. What are these two issues?
A) Validation of spreadsheet model and setting up for the simulation.
B) Uncertainty of the outcome and magnitude of the potential loss.
C) Maximum amount of profit made and the probability of a maximum profit.
D) Maximum amount of loss incurred and the likelihood of that loss.
A) Validation of spreadsheet model and setting up for the simulation.
B) Uncertainty of the outcome and magnitude of the potential loss.
C) Maximum amount of profit made and the probability of a maximum profit.
D) Maximum amount of loss incurred and the likelihood of that loss.
Unlock Deck
Unlock for access to all 85 flashcards in this deck.
Unlock Deck
k this deck
13
In running simulations under Analytic Solver Platform it is desirable to use more simulation runs because
A) confidence level regarding the decision precision is improved
B) point estimates are more accurate
C) simulation run length is decreased
D) cost is decreased
A) confidence level regarding the decision precision is improved
B) point estimates are more accurate
C) simulation run length is decreased
D) cost is decreased
Unlock Deck
Unlock for access to all 85 flashcards in this deck.
Unlock Deck
k this deck
14
Exhibit 12.3
The following questions use the information below.
An auto parts store wants to simulate its inventory system for engine oil. The company has collected data on the shipping time for oil and the daily demand for cases of oil. A case of oil generates a $10 profit. Customers can buy oil at any auto parts store so there are no backorders (the company loses the sale and profit). The company orders 30 cases whenever the inventory position falls below the reorder point of 15 cases. Orders are placed at the beginning of the day and delivered at the beginning of the day so the oil is available on the arrival day. An average service level of 99% is desired. The following spreadsheets have been developed for this problem. The company has simulated 2 weeks of operation for their inventory system. The current level of on-hand inventory is 25 units and no orders are pending.
Using the information in Exhibit 12.3, what formula should go in cell H8 to determine if an order should be placed?
A) =IF(G8<$D$3,1,0)
B) =IF(G8>$D$3,1,0)
C) =IF(G8<$D$3,0,1)
D) =IF(G8<$D$4,1,0)
Unlock Deck
Unlock for access to all 85 flashcards in this deck.
Unlock Deck
k this deck
15
A random variable is
A) a variable whose value cannot be predicted with certainty
B) a parameter
C) a population variable
D) a sample variable
A) a variable whose value cannot be predicted with certainty
B) a parameter
C) a population variable
D) a sample variable
Unlock Deck
Unlock for access to all 85 flashcards in this deck.
Unlock Deck
k this deck
16
Which Analytic Solver Platform function will generate random integer numbers between 2 and 8?
A) =PsiIntUniform(2, 8)
B) =PsiDiscrete(2, 8)
C) =PsiUniform(2, 8)
D) =PsiRandom(2, 8)
A) =PsiIntUniform(2, 8)
B) =PsiDiscrete(2, 8)
C) =PsiUniform(2, 8)
D) =PsiRandom(2, 8)
Unlock Deck
Unlock for access to all 85 flashcards in this deck.
Unlock Deck
k this deck
17
What is the correct Analytic Solver Platform function for generating random numbers from the following distribution on the number of children in families (assume a reference to the current worksheet).
A) =PsiCustom(A2:A6,B2:B6)
B) =PsiRandom(A2:A6,B2:B6)
C) =PsiDiscrete(A2:A6,B2:B6)
D) =PsiUniform(A2:A6,B2:B6)
A) =PsiCustom(A2:A6,B2:B6)
B) =PsiRandom(A2:A6,B2:B6)
C) =PsiDiscrete(A2:A6,B2:B6)
D) =PsiUniform(A2:A6,B2:B6)
Unlock Deck
Unlock for access to all 85 flashcards in this deck.
Unlock Deck
k this deck
18
Simulation is used to
A) find possible worst case values for the dependent variable(s).
B) find worst case and best case values for the dependent variable(s).
C) find distribution information for the dependent variable(s).
D) find median values for the dependent variable(s).
A) find possible worst case values for the dependent variable(s).
B) find worst case and best case values for the dependent variable(s).
C) find distribution information for the dependent variable(s).
D) find median values for the dependent variable(s).
Unlock Deck
Unlock for access to all 85 flashcards in this deck.
Unlock Deck
k this deck
19
Exhibit 12.4.
The following questions use the information below.
The manager of a Washington, DC sightseeing tour company is concerned about overbooking for one of his bus tours. The bus has 15 seats but sometimes there are empty seats. His records show that about 20% of ticket holders do not show up for their tour. Tickets cost $10 and are non-refundable. If the manager overbooks the tour and more than 15 passengers show up, some of them will be bumped to a later tour. This bumping costs the company $25 in various expenses to keep the customer happy until the next tour. The manager wants to see what happens to profits if 18 reservations are accepted.
Using the information in Exhibit 12.4, what formula should go in cell C14 of the worksheet to determine the Cost of Bumping Passengers?
A) =C5*MAX(C10-C4,0)
B) =C5*MAX(C10,0)
C) =MAX(C10-C4,0)
D) =C5*MAX(C10,C4)
Unlock Deck
Unlock for access to all 85 flashcards in this deck.
Unlock Deck
k this deck
20
Several techniques are available to help managers analyze risk. Three of the most common are best-case/worst-case analysis, what-if analysis, and simulation. Of these methods, what-if analysis the most powerful.
Unlock Deck
Unlock for access to all 85 flashcards in this deck.
Unlock Deck
k this deck
21
Methods for analyzing risk that are discussed in the textbook include
A) best-case/worst case analysis
B) what-if analysis
C) simulation
D) all of the above
A) best-case/worst case analysis
B) what-if analysis
C) simulation
D) all of the above
Unlock Deck
Unlock for access to all 85 flashcards in this deck.
Unlock Deck
k this deck
22
Uncertainty
A) is the most difficult thing about decision-making
B) simplifies decision-making
C) is easy to capture with computers
D) requires the use of quantitative models for supporting decision-making
A) is the most difficult thing about decision-making
B) simplifies decision-making
C) is easy to capture with computers
D) requires the use of quantitative models for supporting decision-making
Unlock Deck
Unlock for access to all 85 flashcards in this deck.
Unlock Deck
k this deck
23
Exhibit 12.1
The following questions use the information below.
The owner of Fix-a-dent Auto Repair wants to study the growth of his business using simulation. He is interested in simulating the number of damaged cars and the amount of damage to the cars each month. He currently repairs 100 cars per month and feels this can vary uniformly between a decrease of as much as 3% and an increase of up to 5% (average change of 1%) over the previous months. The dollar value of the damage to the cars is a normally distributed random variable with a mean of $3,000 and a standard deviation of $500. The average repair bill has been increasing steadily over the years and the owner expects the mean repair bill will increase by 1% per month. You have created the following spreadsheet to simulate the problem.
Using the information in Exhibit 12.1, what formula should go cell G5 to calculate the 80th percentile of the empirical distribution of income?
A) =IF(RANK(D21) = 80, 1, 0)
B) None, use Excel Histogram on cell D21.
C) =IF(COUNTIF(D8:D19 > D21) ≥ 8, 1, 0)
D) =PsiPercentile(B21, .8).
Unlock Deck
Unlock for access to all 85 flashcards in this deck.
Unlock Deck
k this deck
24
Which Analytic Solver Platform function will generate random numbers between 3 and 7 from a continuous uniform distribution?
A) =PsiConUniform(3, 7)
B) =PsiUniDist(3, 7)
C) =PsiUniform(3, 7)
D) =PsiTruncate(3, 7)
A) =PsiConUniform(3, 7)
B) =PsiUniDist(3, 7)
C) =PsiUniform(3, 7)
D) =PsiTruncate(3, 7)
Unlock Deck
Unlock for access to all 85 flashcards in this deck.
Unlock Deck
k this deck
25
Which of the following probability distributions are associated with discrete outcomes?
A) Gamma
B) Custom
C) Normal
D) Exponential
A) Gamma
B) Custom
C) Normal
D) Exponential
Unlock Deck
Unlock for access to all 85 flashcards in this deck.
Unlock Deck
k this deck
26
Exhibit 12.3
The following questions use the information below.
An auto parts store wants to simulate its inventory system for engine oil. The company has collected data on the shipping time for oil and the daily demand for cases of oil. A case of oil generates a $10 profit. Customers can buy oil at any auto parts store so there are no backorders (the company loses the sale and profit). The company orders 30 cases whenever the inventory position falls below the reorder point of 15 cases. Orders are placed at the beginning of the day and delivered at the beginning of the day so the oil is available on the arrival day. An average service level of 99% is desired. The following spreadsheets have been developed for this problem. The company has simulated 2 weeks of operation for their inventory system. The current level of on-hand inventory is 25 units and no orders are pending.
Using the information in Exhibit 12.3, what Analytic Solver Platform function should be used in cell I8 to determine the lead time for an order?
A) =PsiDiscrete($B$6:$B$8, $C$6:$C$8)
B) =PsiPoisson(Data!$B$6:$B$8,$Data!$C$6:$C$8)
C) =PsiBinomial(Data!$B$6:$B$8,$Data!$C$6:$C$8)
D) =PsiNormal($B$6:$C$8)
Unlock Deck
Unlock for access to all 85 flashcards in this deck.
Unlock Deck
k this deck
27
Best case analysis is a(n) ____ view of the problem.
A) pessimistic
B) optimistic
C) risky
D) certain
A) pessimistic
B) optimistic
C) risky
D) certain
Unlock Deck
Unlock for access to all 85 flashcards in this deck.
Unlock Deck
k this deck
28
Which of the following distributions can be generated by Analytic Solver Platform?
A) Poisson
B) Normal
C) Weibull
D) All of these
A) Poisson
B) Normal
C) Weibull
D) All of these
Unlock Deck
Unlock for access to all 85 flashcards in this deck.
Unlock Deck
k this deck
29
As the number of replicates in a simulation increases the width of a confidence interval computed from the simulation results will
A) decrease.
B) increase.
C) remain the same.
D) change depends on standard deviation.
A) decrease.
B) increase.
C) remain the same.
D) change depends on standard deviation.
Unlock Deck
Unlock for access to all 85 flashcards in this deck.
Unlock Deck
k this deck
30
The PsiTarget(.) function in Analytic Solver Platform
A) returns the cumulative probability of a specified distribution cell being less or equal to the specified target value
B) returns the cumulative probability of a specified distribution cell being equal to or larger than the specified target value
C) returns the cumulative probability of a specified distribution cell being equal to the specified target value
D) returns the probability of a specified distribution cell being equal to the specified target value
Unlock Deck
Unlock for access to all 85 flashcards in this deck.
Unlock Deck
k this deck
31
Exhibit 12.4.
The following questions use the information below.
The manager of a Washington, DC sightseeing tour company is concerned about overbooking for one of his bus tours. The bus has 15 seats but sometimes there are empty seats. His records show that about 20% of ticket holders do not show up for their tour. Tickets cost $10 and are non-refundable. If the manager overbooks the tour and more than 15 passengers show up, some of them will be bumped to a later tour. This bumping costs the company $25 in various expenses to keep the customer happy until the next tour. The manager wants to see what happens to profits if 18 reservations are accepted.
Using the information in Exhibit 12.4, what formula should go in cell C13 of the worksheet to determine the Opportunity Cost of Empty Seats?
A) =C5*MAX(C4,C10)
B) =C5*MAX(C4,0)
C) =MAX(C4-C10,0)
D) =C5*MAX(C4-C10,0)
Unlock Deck
Unlock for access to all 85 flashcards in this deck.
Unlock Deck
k this deck
32
Using the information in Exhibit 12.1, what Analytic Solver Platform function should go in cell C8 and copied to cells C9:C19 to compute the average damage per car in the month?
A) =PsiNormal($C$3*$F$3^$A$8, $H$3)
B) =PsiNormal($C$3*$F$3^A8, $H$3)
C) =PsiNormal($C$3, $D$3*(1+$F$3)^A8)
D) =PsiNormal($C$3*(1+$F$3)^A8, $H$3)
A) =PsiNormal($C$3*$F$3^$A$8, $H$3)
B) =PsiNormal($C$3*$F$3^A8, $H$3)
C) =PsiNormal($C$3, $D$3*(1+$F$3)^A8)
D) =PsiNormal($C$3*(1+$F$3)^A8, $H$3)
Unlock Deck
Unlock for access to all 85 flashcards in this deck.
Unlock Deck
k this deck
33
Exhibit 12.3
The following questions use the information below.
An auto parts store wants to simulate its inventory system for engine oil. The company has collected data on the shipping time for oil and the daily demand for cases of oil. A case of oil generates a $10 profit. Customers can buy oil at any auto parts store so there are no backorders (the company loses the sale and profit). The company orders 30 cases whenever the inventory position falls below the reorder point of 15 cases. Orders are placed at the beginning of the day and delivered at the beginning of the day so the oil is available on the arrival day. An average service level of 99% is desired. The following spreadsheets have been developed for this problem. The company has simulated 2 weeks of operation for their inventory system. The current level of on-hand inventory is 25 units and no orders are pending.
Using the information in Exhibit 12.3, what formula should go in cell C9 and copied to C10:C21 of the MODEL sheet to compute units received?
A) =COUNT($J$8:J8,A9)*$D$4
B) =COUNTIF($J$8:J8,A8)*$C$4
C) =COUNTIF($J$8:J8,A9)*$D$5
D) =COUNTIF($J$8:J8,A9)*$D$4
Unlock Deck
Unlock for access to all 85 flashcards in this deck.
Unlock Deck
k this deck
34
The benefit(s) of simulation discussed in the text is/are
A) gaining better insight into a problem
B) ability to make more informed decisions
C) eliminating the need to build a system with fine-tuning occurring after the launch
D) all of the above
A) gaining better insight into a problem
B) ability to make more informed decisions
C) eliminating the need to build a system with fine-tuning occurring after the launch
D) all of the above
Unlock Deck
Unlock for access to all 85 flashcards in this deck.
Unlock Deck
k this deck
35
Using the information in Exhibit 12.3, what Analytic Solver Platform function should be used in cell D8 and copied to cells D9:D21 of the MODEL sheet to compute daily demand?
A) =PsiDiscrete($E$6:$E$13, $F$6:$F$13)
B) =PsiHypergeo($E$6:$F138)
C) =PsiBinomial($E$6, $F$13)
D) =PsiCustom(Data!$E$6, $F$13)
A) =PsiDiscrete($E$6:$E$13, $F$6:$F$13)
B) =PsiHypergeo($E$6:$F138)
C) =PsiBinomial($E$6, $F$13)
D) =PsiCustom(Data!$E$6, $F$13)
Unlock Deck
Unlock for access to all 85 flashcards in this deck.
Unlock Deck
k this deck
36
What is a weakness of manual what-if analysis?
A) biased sample values of performance measures
B) hard to do many what-if scenarios
C) does not provide distribution information
D) all of these are weaknesses
A) biased sample values of performance measures
B) hard to do many what-if scenarios
C) does not provide distribution information
D) all of these are weaknesses
Unlock Deck
Unlock for access to all 85 flashcards in this deck.
Unlock Deck
k this deck
37
Worst case analysis is a(n) ____ view of the problem.
A) pessimistic
B) optimistic
C) risky
D) certain
A) pessimistic
B) optimistic
C) risky
D) certain
Unlock Deck
Unlock for access to all 85 flashcards in this deck.
Unlock Deck
k this deck
38
Some discrete distributions available in Analytic Solver Platform are
A) binomial
B) Poisson
C) Hypergeometric
D) all of the above
A) binomial
B) Poisson
C) Hypergeometric
D) all of the above
Unlock Deck
Unlock for access to all 85 flashcards in this deck.
Unlock Deck
k this deck
39
Risk needs to be analyzed using models in order to
A) make decisions better than those based on informed guesses
B) obtain a feasible solution
C) obtain an optimal solution
D) confound the decision-making process
A) make decisions better than those based on informed guesses
B) obtain a feasible solution
C) obtain an optimal solution
D) confound the decision-making process
Unlock Deck
Unlock for access to all 85 flashcards in this deck.
Unlock Deck
k this deck
40
Which of the following probability distributions are associated with continuous outcomes?
A) Poisson
B) Binomial
C) Custom
D) Triangular
A) Poisson
B) Binomial
C) Custom
D) Triangular
Unlock Deck
Unlock for access to all 85 flashcards in this deck.
Unlock Deck
k this deck
41
Which of the following best describes a random variable?
A) A spreadsheet input cell containing a random number generator.
B) The outcome of a simulation model.
C) Any variable whose value cannot be predicted with certainty.
D) All of these describe random variables.
A) A spreadsheet input cell containing a random number generator.
B) The outcome of a simulation model.
C) Any variable whose value cannot be predicted with certainty.
D) All of these describe random variables.
Unlock Deck
Unlock for access to all 85 flashcards in this deck.
Unlock Deck
k this deck
42
Exhibit 12.2
The following questions use the information below.
The owner of Fix-a-dent Auto Repair wants to study the growth of his business using simulation. He is interested in simulating the number of damaged cars and the amount of damage to the cars each month. He currently repairs 100 cars per month and feels the change in number of cars can vary uniformly between a decrease of as much as 3% and an increase of up to 5% (average change of 1%). The dollar value of the damage to the cars is a normally distributed random variable with a mean of $3,000 and a standard deviation of $500. The average repair bill has been increasing steadily over the years and the owner expects the mean repair bill will increase by 1% per month. A spreadsheet model to simulate the problem has been run 300 times. A part of the simulation statistics output from Risk Solver Platform (RSP)and a spreadsheet for computing confidence intervals follows.
Using the information in Exhibit 12.2, what is the worst case scenario for the Fix-a-dent company based on this output?
A) $1,747,464.94
B) $3,339,249.82
C) $4,122,024.01
D) $4,207,301.98
Unlock Deck
Unlock for access to all 85 flashcards in this deck.
Unlock Deck
k this deck
43
In a what-if analysis the decision maker
A) changes the values of the uncertain input variables to see what happens to the performance measure being studied
B) assumes that all inputs are random variables
C) assumes that all outputs are deterministic
D) corrects for underestimated risk
A) changes the values of the uncertain input variables to see what happens to the performance measure being studied
B) assumes that all inputs are random variables
C) assumes that all outputs are deterministic
D) corrects for underestimated risk
Unlock Deck
Unlock for access to all 85 flashcards in this deck.
Unlock Deck
k this deck
44
How should one determine which RNGs to employ in a spreadsheet simulation model?
A) Use the Analytic Solver Platform gallery and pick a distribution.
B) Generate thousands of samples and compare the resulting histogram to ensure the distribution is correct.
C) Solve the deterministic model repeatedly and use Analytic Solver Platform distribution fitting tools.
D) The distributions selected should represent the underlying pool of values expected to occur.
Unlock Deck
Unlock for access to all 85 flashcards in this deck.
Unlock Deck
k this deck
45
Exhibit 12.1
The following questions use the information below.
The owner of Fix-a-dent Auto Repair wants to study the growth of his business using simulation. He is interested in simulating the number of damaged cars and the amount of damage to the cars each month. He currently repairs 100 cars per month and feels this can vary uniformly between a decrease of as much as 3% and an increase of up to 5% (average change of 1%) over the previous months. The dollar value of the damage to the cars is a normally distributed random variable with a mean of $3,000 and a standard deviation of $500. The average repair bill has been increasing steadily over the years and the owner expects the mean repair bill will increase by 1% per month. You have created the following spreadsheet to simulate the problem.
Using the information in Exhibit 12.1, what Analytic Solver Platform function should go in cell B8 to compute the number of cars repaired in the first month?
A) =PsiUniform($C$2*(1-$F$2), $C$2*(1+$H$2))
B) =PsiUniform($C$2*1-$F$2, $C$2*1+$H$2)
C) =PsiUniform($C$2-(1-$F$2), $C$2+(1+$H$2))
D) =PsiUniform($C$2+(1-$F$2), $C$2+(1+$H$2))
Unlock Deck
Unlock for access to all 85 flashcards in this deck.
Unlock Deck
k this deck
46
The Analytic Solver Platform is a good simulation tool because
A) it is difficult to use
B) it provides several polymorphic spreadsheet interpreter "psi" functions to facilitate Excel calculations
C) it has a limited choice of statistical distributions making it difficult to approximate reality
D) it requires a standalone platform operating independently of Excel
Unlock Deck
Unlock for access to all 85 flashcards in this deck.
Unlock Deck
k this deck
47
Common continuous distributions available in Analytic Solver Platform are
A) exponential
B) Normal
C) truncated Normal
D) all of the above
A) exponential
B) Normal
C) truncated Normal
D) all of the above
Unlock Deck
Unlock for access to all 85 flashcards in this deck.
Unlock Deck
k this deck
48
Exhibit 12.4.
The following questions use the information below.
The manager of a Washington, DC sightseeing tour company is concerned about overbooking for one of his bus tours. The bus has 15 seats but sometimes there are empty seats. His records show that about 20% of ticket holders do not show up for their tour. Tickets cost $10 and are non-refundable. If the manager overbooks the tour and more than 15 passengers show up, some of them will be bumped to a later tour. This bumping costs the company $25 in various expenses to keep the customer happy until the next tour. The manager wants to see what happens to profits if 18 reservations are accepted.
Using the information in Exhibit 12.4, what Analytic Solver Platform function should be used in cell C10 to determine the number of Passengers to Board?
A) =PsiBinomial($C$8, 1-$C$6)
B) =PsiBinomial(1-$C$6, $C$8)
C) =PsiBinomial($C$8, $C$6)
D) =PsiBinomial($C$6, $C$8)
Unlock Deck
Unlock for access to all 85 flashcards in this deck.
Unlock Deck
k this deck
49
A good way to fit the distribution to historical patterns when historical data is available is to
A) use the Fit icon in the Tools group of the Analytic Solver Platform
B) guess the distribution parameters
C) assume that the data distribution is Normal
D) assume that the data distribution is Weibull
A) use the Fit icon in the Tools group of the Analytic Solver Platform
B) guess the distribution parameters
C) assume that the data distribution is Normal
D) assume that the data distribution is Weibull
Unlock Deck
Unlock for access to all 85 flashcards in this deck.
Unlock Deck
k this deck
50
Large sample size, n, is desirable because
A) upper and lower limits of the confidence interval for the true population mean are closer to one another
B) upper and lower limits of the confidence interval for the true population mean are further apart
C) point estimate of the population mean is larger
D) point estimate of the population mean is smaller
Unlock Deck
Unlock for access to all 85 flashcards in this deck.
Unlock Deck
k this deck
51
If a spreadsheet simulation user has a probability distribution that may assume 1 of 5 values with nearly equal probability, this user has what type of distribution?
A) A discrete distribution.
B) A continuous distribution.
C) A triangular distribution.
D) A normal distribution.
A) A discrete distribution.
B) A continuous distribution.
C) A triangular distribution.
D) A normal distribution.
Unlock Deck
Unlock for access to all 85 flashcards in this deck.
Unlock Deck
k this deck
52
Which of the following do not help determine the magnitude of risk in a decision-making problem?
A) The level of uncertainty in outcome.
B) The magnitude of potential loss.
C) The level of management interest in the problem.
D) The level of uncertainty in input variables.
A) The level of uncertainty in outcome.
B) The magnitude of potential loss.
C) The level of management interest in the problem.
D) The level of uncertainty in input variables.
Unlock Deck
Unlock for access to all 85 flashcards in this deck.
Unlock Deck
k this deck
53
Exhibit 12.2
The following questions use the information below.
The owner of Fix-a-dent Auto Repair wants to study the growth of his business using simulation. He is interested in simulating the number of damaged cars and the amount of damage to the cars each month. He currently repairs 100 cars per month and feels the change in number of cars can vary uniformly between a decrease of as much as 3% and an increase of up to 5% (average change of 1%). The dollar value of the damage to the cars is a normally distributed random variable with a mean of $3,000 and a standard deviation of $500. The average repair bill has been increasing steadily over the years and the owner expects the mean repair bill will increase by 1% per month. A spreadsheet model to simulate the problem has been run 300 times. A part of the simulation statistics output from Risk Solver Platform (RSP)and a spreadsheet for computing confidence intervals follows.
Using the information in Exhibit 12.2, what formula should go in cell B8 of the Confidence Intervals spreadsheet to compute the upper limit on a 95% confidence interval for the true population mean?
A) =B4+1.96*B5/SQRT(B2)
B) =B4+1.645*B5/SQRT(B2)
C) =B4-1.96*B5/SQRT(B2)
D) =B4+1.96*B5/B2
Unlock Deck
Unlock for access to all 85 flashcards in this deck.
Unlock Deck
k this deck
54
What method is used to generate observations from a distribution?
A) random number generator
B) sample generator
C) problem generator
D) steady state generator
A) random number generator
B) sample generator
C) problem generator
D) steady state generator
Unlock Deck
Unlock for access to all 85 flashcards in this deck.
Unlock Deck
k this deck
55
Exhibit 12.1
The following questions use the information below.
The owner of Fix-a-dent Auto Repair wants to study the growth of his business using simulation. He is interested in simulating the number of damaged cars and the amount of damage to the cars each month. He currently repairs 100 cars per month and feels this can vary uniformly between a decrease of as much as 3% and an increase of up to 5% (average change of 1%) over the previous months. The dollar value of the damage to the cars is a normally distributed random variable with a mean of $3,000 and a standard deviation of $500. The average repair bill has been increasing steadily over the years and the owner expects the mean repair bill will increase by 1% per month. You have created the following spreadsheet to simulate the problem.
Using the information in Exhibit 12.1, what Analytic Solver Platform function should go in cell B9 and copied to B10:B19 to compute the number of cars repaired in the subsequent months?
A) =PsiUniform($B$8*(1+$F$2), $B$8*(1-$H$2))
B) =PsiUniform(B8*(1-$F$2), B8*(1+$H$2))
C) =PsiUniform($C$2*(1-$F$2), $C$2*(1+$H$2))
D) =PsiIntUniform($C$2*(1-$F$2), $C$2*(1+$H$2))
Unlock Deck
Unlock for access to all 85 flashcards in this deck.
Unlock Deck
k this deck
56
Exhibit 12.4.
The following questions use the information below.
The manager of a Washington, DC sightseeing tour company is concerned about overbooking for one of his bus tours. The bus has 15 seats but sometimes there are empty seats. His records show that about 20% of ticket holders do not show up for their tour. Tickets cost $10 and are non-refundable. If the manager overbooks the tour and more than 15 passengers show up, some of them will be bumped to a later tour. This bumping costs the company $25 in various expenses to keep the customer happy until the next tour. The manager wants to see what happens to profits if 18 reservations are accepted.
Using the information in Exhibit 12.4, what formula should go in cell C15 of the worksheet to determine the Marginal Profit?
A) =C12+C13+C14
B) =C12-C13-C14
C) =C12-C14+C13
D) =C12-(C13-C14)
Unlock Deck
Unlock for access to all 85 flashcards in this deck.
Unlock Deck
k this deck
57
Exhibit 12.3
The following questions use the information below.
An auto parts store wants to simulate its inventory system for engine oil. The company has collected data on the shipping time for oil and the daily demand for cases of oil. A case of oil generates a $10 profit. Customers can buy oil at any auto parts store so there are no backorders (the company loses the sale and profit). The company orders 30 cases whenever the inventory position falls below the reorder point of 15 cases. Orders are placed at the beginning of the day and delivered at the beginning of the day so the oil is available on the arrival day. An average service level of 99% is desired. The following spreadsheets have been developed for this problem. The company has simulated 2 weeks of operation for their inventory system. The current level of on-hand inventory is 25 units and no orders are pending.
Using the information in Exhibit 12.3, what formula should go in cell H3 to compute the service level?
A) =SUM(G8:G21)/SUM(D8:D21)
B) =SUM(D8:D21)/SUM(E8:E21)
C) =SUM(E8:E21)/SUM(D8:D21)
D) =SUM(F8:F21)/SUM(G8:G21)
Unlock Deck
Unlock for access to all 85 flashcards in this deck.
Unlock Deck
k this deck
58
Inventory position is defined as
A) ending inventory + outstanding orders
B) ending inventory − backorders
C) outstanding orders − on hand inventory
D) ending inventory
A) ending inventory + outstanding orders
B) ending inventory − backorders
C) outstanding orders − on hand inventory
D) ending inventory
Unlock Deck
Unlock for access to all 85 flashcards in this deck.
Unlock Deck
k this deck
59
Exhibit 12.3
The following questions use the information below.
An auto parts store wants to simulate its inventory system for engine oil. The company has collected data on the shipping time for oil and the daily demand for cases of oil. A case of oil generates a $10 profit. Customers can buy oil at any auto parts store so there are no backorders (the company loses the sale and profit). The company orders 30 cases whenever the inventory position falls below the reorder point of 15 cases. Orders are placed at the beginning of the day and delivered at the beginning of the day so the oil is available on the arrival day. An average service level of 99% is desired. The following spreadsheets have been developed for this problem. The company has simulated 2 weeks of operation for their inventory system. The current level of on-hand inventory is 25 units and no orders are pending.
Using the information in Exhibit 12.3, what Analytic Solver Platform function should be used for generating a random shipping time based on the Data spreadsheet distribution for shipping time?
A) =PsiCumul($B$6:$C$8)
B) =PsiCustom($B$6:$B$8, $C$8:$C$8)
C) =PsiGeneral(Data!$B$6, probability $C$8)
D) =PsiDiscrete($B$6:$B$8, $C$8:$C$8)
Unlock Deck
Unlock for access to all 85 flashcards in this deck.
Unlock Deck
k this deck
60
The worst-case analysis approach to risk analysis
A) is optimistic
B) is pessimistic
C) is most likely
D) generally produces good outcomes
A) is optimistic
B) is pessimistic
C) is most likely
D) generally produces good outcomes
Unlock Deck
Unlock for access to all 85 flashcards in this deck.
Unlock Deck
k this deck
61
Exhibit 12.3
The following questions use the information below.
An auto parts store wants to simulate its inventory system for engine oil. The company has collected data on the shipping time for oil and the daily demand for cases of oil. A case of oil generates a $10 profit. Customers can buy oil at any auto parts store so there are no backorders (the company loses the sale and profit). The company orders 30 cases whenever the inventory position falls below the reorder point of 15 cases. Orders are placed at the beginning of the day and delivered at the beginning of the day so the oil is available on the arrival day. An average service level of 99% is desired. The following spreadsheets have been developed for this problem. The company has simulated 2 weeks of operation for their inventory system. The current level of on-hand inventory is 25 units and no orders are pending.
A variable whose value cannot be predicted or set with certainty is a
A) discrete variable
B) random variable
C) realistic variable
D) simulation variable
Instructions: Answer the following questions using the Analytic Solver Platform Excel add-in.
Unlock Deck
Unlock for access to all 85 flashcards in this deck.
Unlock Deck
k this deck
62
Exhibit 12.5
The following questions use the information below.
The owner of Sal's Italian Restaurant wants to study the growth of his business using simulation. He is interested in simulating the number of customers and the amount ordered by customers each month. He currently serves 1000 customers per month and feels this can vary uniformly between a decrease of as much as 5% and an increase of up to 9%. The bill for each customer is a normally distributed random variable with a mean of $20 and a standard deviation of $5. The average order has been increasing steadily over the years and the owner expects the mean order will increase by 2% per month. You have created the following spreadsheet to simulate the problem.
A simulation model was replicated 100 times yielding a mean of 82.59 with variance of 17.66. Of the 100 replications, 11 replications yielded an outcome over a value of 100. The 95% confidence interval of the mean is the interval (81.77, 83.41). Of the 100 simulation outcomes, 65 outcomes failed to fall within this interval. What is wrong with the confidence interval?
Unlock Deck
Unlock for access to all 85 flashcards in this deck.
Unlock Deck
k this deck
63
Exhibit 12.5
The following questions use the information below.
The owner of Sal's Italian Restaurant wants to study the growth of his business using simulation. He is interested in simulating the number of customers and the amount ordered by customers each month. He currently serves 1000 customers per month and feels this can vary uniformly between a decrease of as much as 5% and an increase of up to 9%. The bill for each customer is a normally distributed random variable with a mean of $20 and a standard deviation of $5. The average order has been increasing steadily over the years and the owner expects the mean order will increase by 2% per month. You have created the following spreadsheet to simulate the problem.
The spreadsheet model for Sal, from Exhibit 12.5, has been run 300 times to produce the following output. What is the best case scenario for Sal based on this output? Instructions: Answer the following questions using the Analytic Solver Platform Excel add-in.
The following questions use the information below.
The owner of Sal's Italian Restaurant wants to study the growth of his business using simulation. He is interested in simulating the number of customers and the amount ordered by customers each month. He currently serves 1000 customers per month and feels this can vary uniformly between a decrease of as much as 5% and an increase of up to 9%. The bill for each customer is a normally distributed random variable with a mean of $20 and a standard deviation of $5. The average order has been increasing steadily over the years and the owner expects the mean order will increase by 2% per month. You have created the following spreadsheet to simulate the problem.
The spreadsheet model for Sal, from Exhibit 12.5, has been run 300 times to produce the following output. What is the best case scenario for Sal based on this output?
Instructions: Answer the following questions using the Analytic Solver Platform Excel add-in. Unlock Deck
Unlock for access to all 85 flashcards in this deck.
Unlock Deck
k this deck
64
Exhibit 12.5
The following questions use the information below.
The owner of Sal's Italian Restaurant wants to study the growth of his business using simulation. He is interested in simulating the number of customers and the amount ordered by customers each month. He currently serves 1000 customers per month and feels this can vary uniformly between a decrease of as much as 5% and an increase of up to 9%. The bill for each customer is a normally distributed random variable with a mean of $20 and a standard deviation of $5. The average order has been increasing steadily over the years and the owner expects the mean order will increase by 2% per month. You have created the following spreadsheet to simulate the problem.
Sal, from Exhibit 12.5, has produced the following spreadsheet to compute confidence intervals on his income. What formula should go in cell B12 to compute the upper limit on a 95% confidence interval for the population proportion below 90%? Instructions: Answer the following questions using the Analytic Solver Platform Excel add-in.
The following questions use the information below.
The owner of Sal's Italian Restaurant wants to study the growth of his business using simulation. He is interested in simulating the number of customers and the amount ordered by customers each month. He currently serves 1000 customers per month and feels this can vary uniformly between a decrease of as much as 5% and an increase of up to 9%. The bill for each customer is a normally distributed random variable with a mean of $20 and a standard deviation of $5. The average order has been increasing steadily over the years and the owner expects the mean order will increase by 2% per month. You have created the following spreadsheet to simulate the problem.
Sal, from Exhibit 12.5, has produced the following spreadsheet to compute confidence intervals on his income. What formula should go in cell B12 to compute the upper limit on a 95% confidence interval for the population proportion below 90%?
Instructions: Answer the following questions using the Analytic Solver Platform Excel add-in. Unlock Deck
Unlock for access to all 85 flashcards in this deck.
Unlock Deck
k this deck
65
Exhibit 12.5
The following questions use the information below.
The owner of Sal's Italian Restaurant wants to study the growth of his business using simulation. He is interested in simulating the number of customers and the amount ordered by customers each month. He currently serves 1000 customers per month and feels this can vary uniformly between a decrease of as much as 5% and an increase of up to 9%. The bill for each customer is a normally distributed random variable with a mean of $20 and a standard deviation of $5. The average order has been increasing steadily over the years and the owner expects the mean order will increase by 2% per month. You have created the following spreadsheet to simulate the problem.
What function should be used for generating random numbers from a normal distribution with mean μ and standard deviation σ?
Unlock Deck
Unlock for access to all 85 flashcards in this deck.
Unlock Deck
k this deck
66
Exhibit 12.5
The following questions use the information below.
The owner of Sal's Italian Restaurant wants to study the growth of his business using simulation. He is interested in simulating the number of customers and the amount ordered by customers each month. He currently serves 1000 customers per month and feels this can vary uniformly between a decrease of as much as 5% and an increase of up to 9%. The bill for each customer is a normally distributed random variable with a mean of $20 and a standard deviation of $5. The average order has been increasing steadily over the years and the owner expects the mean order will increase by 2% per month. You have created the following spreadsheet to simulate the problem.
A machine produces an average of 500 parts per day with a standard deviation of 10 parts. This is a normally distributed variable. The percent of defective parts ranges from 8-12%. Parts which need minor repair comprise 75% of the defective parts and cost $5 to repair. The rest of the defective parts cost $20 to repair. What formulas should go in cells B8:B15 to compute the daily cost of defective parts? Instructions: Answer the following questions using the Analytic Solver Platform Excel add-in.
The following questions use the information below.
The owner of Sal's Italian Restaurant wants to study the growth of his business using simulation. He is interested in simulating the number of customers and the amount ordered by customers each month. He currently serves 1000 customers per month and feels this can vary uniformly between a decrease of as much as 5% and an increase of up to 9%. The bill for each customer is a normally distributed random variable with a mean of $20 and a standard deviation of $5. The average order has been increasing steadily over the years and the owner expects the mean order will increase by 2% per month. You have created the following spreadsheet to simulate the problem.
A machine produces an average of 500 parts per day with a standard deviation of 10 parts. This is a normally distributed variable. The percent of defective parts ranges from 8-12%. Parts which need minor repair comprise 75% of the defective parts and cost $5 to repair. The rest of the defective parts cost $20 to repair. What formulas should go in cells B8:B15 to compute the daily cost of defective parts?
Instructions: Answer the following questions using the Analytic Solver Platform Excel add-in. Unlock Deck
Unlock for access to all 85 flashcards in this deck.
Unlock Deck
k this deck
67
Exhibit 12.5
The following questions use the information below.
The owner of Sal's Italian Restaurant wants to study the growth of his business using simulation. He is interested in simulating the number of customers and the amount ordered by customers each month. He currently serves 1000 customers per month and feels this can vary uniformly between a decrease of as much as 5% and an increase of up to 9%. The bill for each customer is a normally distributed random variable with a mean of $20 and a standard deviation of $5. The average order has been increasing steadily over the years and the owner expects the mean order will increase by 2% per month. You have created the following spreadsheet to simulate the problem.
What function should be used for generating random integer numbers between 2 and 8?
Unlock Deck
Unlock for access to all 85 flashcards in this deck.
Unlock Deck
k this deck
68
Exhibit 12.5
The following questions use the information below.
The owner of Sal's Italian Restaurant wants to study the growth of his business using simulation. He is interested in simulating the number of customers and the amount ordered by customers each month. He currently serves 1000 customers per month and feels this can vary uniformly between a decrease of as much as 5% and an increase of up to 9%. The bill for each customer is a normally distributed random variable with a mean of $20 and a standard deviation of $5. The average order has been increasing steadily over the years and the owner expects the mean order will increase by 2% per month. You have created the following spreadsheet to simulate the problem.
What function should be used for generating random numbers from a normal distribution with mean μ and standard deviation σ between the values of a and b only?
Unlock Deck
Unlock for access to all 85 flashcards in this deck.
Unlock Deck
k this deck
69
Exhibit 12.3
The following questions use the information below.
An auto parts store wants to simulate its inventory system for engine oil. The company has collected data on the shipping time for oil and the daily demand for cases of oil. A case of oil generates a $10 profit. Customers can buy oil at any auto parts store so there are no backorders (the company loses the sale and profit). The company orders 30 cases whenever the inventory position falls below the reorder point of 15 cases. Orders are placed at the beginning of the day and delivered at the beginning of the day so the oil is available on the arrival day. An average service level of 99% is desired. The following spreadsheets have been developed for this problem. The company has simulated 2 weeks of operation for their inventory system. The current level of on-hand inventory is 25 units and no orders are pending.
Jim Johnson operates a bus service to take college students to "The Big City" on Friday night and bring them back to school on Sunday night. The bus has 45 seats but sometimes there are empty seats. His records show that about 5% of ticket holders do not show up for their ride. Tickets cost $20 and are non-refundable. If Jim overbooks the bus and more than 45 passengers show up, some of them will be bumped and have to miss the trip. This bumping costs the company $40 because Jim has a double-your-money back policy for bumped passengers. Jim wants to see what happens to profits if 48 reservations are accepted. What formulas should go in cell C10 − C15 of the worksheet?
The following questions use the information below.
An auto parts store wants to simulate its inventory system for engine oil. The company has collected data on the shipping time for oil and the daily demand for cases of oil. A case of oil generates a $10 profit. Customers can buy oil at any auto parts store so there are no backorders (the company loses the sale and profit). The company orders 30 cases whenever the inventory position falls below the reorder point of 15 cases. Orders are placed at the beginning of the day and delivered at the beginning of the day so the oil is available on the arrival day. An average service level of 99% is desired. The following spreadsheets have been developed for this problem. The company has simulated 2 weeks of operation for their inventory system. The current level of on-hand inventory is 25 units and no orders are pending.
Jim Johnson operates a bus service to take college students to "The Big City" on Friday night and bring them back to school on Sunday night. The bus has 45 seats but sometimes there are empty seats. His records show that about 5% of ticket holders do not show up for their ride. Tickets cost $20 and are non-refundable. If Jim overbooks the bus and more than 45 passengers show up, some of them will be bumped and have to miss the trip. This bumping costs the company $40 because Jim has a double-your-money back policy for bumped passengers. Jim wants to see what happens to profits if 48 reservations are accepted.
What formulas should go in cell C10 − C15 of the worksheet? Unlock Deck
Unlock for access to all 85 flashcards in this deck.
Unlock Deck
k this deck
70
Exhibit 12.5
The following questions use the information below.
The owner of Sal's Italian Restaurant wants to study the growth of his business using simulation. He is interested in simulating the number of customers and the amount ordered by customers each month. He currently serves 1000 customers per month and feels this can vary uniformly between a decrease of as much as 5% and an increase of up to 9%. The bill for each customer is a normally distributed random variable with a mean of $20 and a standard deviation of $5. The average order has been increasing steadily over the years and the owner expects the mean order will increase by 2% per month. You have created the following spreadsheet to simulate the problem.
What is the expected number of phone calls per hour based on the following distribution on the number of phone calls per hour?
Unlock Deck
Unlock for access to all 85 flashcards in this deck.
Unlock Deck
k this deck
71
Exhibit 12.3
The following questions use the information below.
An auto parts store wants to simulate its inventory system for engine oil. The company has collected data on the shipping time for oil and the daily demand for cases of oil. A case of oil generates a $10 profit. Customers can buy oil at any auto parts store so there are no backorders (the company loses the sale and profit). The company orders 30 cases whenever the inventory position falls below the reorder point of 15 cases. Orders are placed at the beginning of the day and delivered at the beginning of the day so the oil is available on the arrival day. An average service level of 99% is desired. The following spreadsheets have been developed for this problem. The company has simulated 2 weeks of operation for their inventory system. The current level of on-hand inventory is 25 units and no orders are pending.
Why would a manager be interested in analyzing risk?
A) To determine a most likely outcome.
B) To determine a range of outcomes.
C) To determine a distribution of outcomes.
D) To determine a confidence interval on most likely outcomes.
Unlock Deck
Unlock for access to all 85 flashcards in this deck.
Unlock Deck
k this deck
72
Exhibit 12.5
The following questions use the information below.
The owner of Sal's Italian Restaurant wants to study the growth of his business using simulation. He is interested in simulating the number of customers and the amount ordered by customers each month. He currently serves 1000 customers per month and feels this can vary uniformly between a decrease of as much as 5% and an increase of up to 9%. The bill for each customer is a normally distributed random variable with a mean of $20 and a standard deviation of $5. The average order has been increasing steadily over the years and the owner expects the mean order will increase by 2% per month. You have created the following spreadsheet to simulate the problem.
A simulation model was replicated 100 times yielding a mean of 82.59 with variance of 17.66. Of the 100 replications, 11 replications yielded an outcome over a value of 100. What is the 95% confidence interval on the proportion of simulations whose outcomes exceeded a value of 100?
Unlock Deck
Unlock for access to all 85 flashcards in this deck.
Unlock Deck
k this deck
73
Exhibit 12.5
The following questions use the information below.
The owner of Sal's Italian Restaurant wants to study the growth of his business using simulation. He is interested in simulating the number of customers and the amount ordered by customers each month. He currently serves 1000 customers per month and feels this can vary uniformly between a decrease of as much as 5% and an increase of up to 9%. The bill for each customer is a normally distributed random variable with a mean of $20 and a standard deviation of $5. The average order has been increasing steadily over the years and the owner expects the mean order will increase by 2% per month. You have created the following spreadsheet to simulate the problem.
University Florists makes bouquets from a variety of materials. The Daily Special Bouquet is priced at $20. The florist assembles this bouquet each day from a variety of low cost flowers he buys from his flower supplier. The actual cost of flowers ranges uniformly from $2 to $7, with all intermediate values being equally likely. The florist (who studied management science many years ago) knows that the time to assemble a bouquet is normally distributed with a mean time of 5 minutes and standard deviation of 1 minute. This will be the time required for all of the Daily Special Bouquets for that day. The florist values his labor time at $10 per hour. Sales are normally distributed with a mean of 10 bouquets per day with a standard deviation of 1 bouquet. What formulas should go in cells B8:B14 to simulate daily profits for the store? Instructions: Answer the following questions using the Analytic Solver Platform Excel add-in.
The following questions use the information below.
The owner of Sal's Italian Restaurant wants to study the growth of his business using simulation. He is interested in simulating the number of customers and the amount ordered by customers each month. He currently serves 1000 customers per month and feels this can vary uniformly between a decrease of as much as 5% and an increase of up to 9%. The bill for each customer is a normally distributed random variable with a mean of $20 and a standard deviation of $5. The average order has been increasing steadily over the years and the owner expects the mean order will increase by 2% per month. You have created the following spreadsheet to simulate the problem.
University Florists makes bouquets from a variety of materials. The Daily Special Bouquet is priced at $20. The florist assembles this bouquet each day from a variety of low cost flowers he buys from his flower supplier. The actual cost of flowers ranges uniformly from $2 to $7, with all intermediate values being equally likely. The florist (who studied management science many years ago) knows that the time to assemble a bouquet is normally distributed with a mean time of 5 minutes and standard deviation of 1 minute. This will be the time required for all of the Daily Special Bouquets for that day. The florist values his labor time at $10 per hour. Sales are normally distributed with a mean of 10 bouquets per day with a standard deviation of 1 bouquet. What formulas should go in cells B8:B14 to simulate daily profits for the store?
Instructions: Answer the following questions using the Analytic Solver Platform Excel add-in. Unlock Deck
Unlock for access to all 85 flashcards in this deck.
Unlock Deck
k this deck
74
Exhibit 12.5
The following questions use the information below.
The owner of Sal's Italian Restaurant wants to study the growth of his business using simulation. He is interested in simulating the number of customers and the amount ordered by customers each month. He currently serves 1000 customers per month and feels this can vary uniformly between a decrease of as much as 5% and an increase of up to 9%. The bill for each customer is a normally distributed random variable with a mean of $20 and a standard deviation of $5. The average order has been increasing steadily over the years and the owner expects the mean order will increase by 2% per month. You have created the following spreadsheet to simulate the problem.
What function should be used for generating random numbers from the following distribution on the number of phone calls per hour?
Unlock Deck
Unlock for access to all 85 flashcards in this deck.
Unlock Deck
k this deck
75
Exhibit 12.3
The following questions use the information below.
An auto parts store wants to simulate its inventory system for engine oil. The company has collected data on the shipping time for oil and the daily demand for cases of oil. A case of oil generates a $10 profit. Customers can buy oil at any auto parts store so there are no backorders (the company loses the sale and profit). The company orders 30 cases whenever the inventory position falls below the reorder point of 15 cases. Orders are placed at the beginning of the day and delivered at the beginning of the day so the oil is available on the arrival day. An average service level of 99% is desired. The following spreadsheets have been developed for this problem. The company has simulated 2 weeks of operation for their inventory system. The current level of on-hand inventory is 25 units and no orders are pending.
A simulation model was replicated 100 times yielding a mean of 82.59 with variance of 17.66. Of the 100 replications, 11 replications yielded an outcome over a value of 100. What is the 90% confidence interval on the mean?
Instructions: Answer the following questions using the Analytic Solver Platform Excel add-in.
Unlock Deck
Unlock for access to all 85 flashcards in this deck.
Unlock Deck
k this deck
76
Exhibit 12.5
The following questions use the information below.
The owner of Sal's Italian Restaurant wants to study the growth of his business using simulation. He is interested in simulating the number of customers and the amount ordered by customers each month. He currently serves 1000 customers per month and feels this can vary uniformly between a decrease of as much as 5% and an increase of up to 9%. The bill for each customer is a normally distributed random variable with a mean of $20 and a standard deviation of $5. The average order has been increasing steadily over the years and the owner expects the mean order will increase by 2% per month. You have created the following spreadsheet to simulate the problem.
What is the probability that 3 or more phone calls are received in any hour of operation? Instructions: Answer the following questions using the Analytic Solver Platform Excel add-in.
The following questions use the information below.
The owner of Sal's Italian Restaurant wants to study the growth of his business using simulation. He is interested in simulating the number of customers and the amount ordered by customers each month. He currently serves 1000 customers per month and feels this can vary uniformly between a decrease of as much as 5% and an increase of up to 9%. The bill for each customer is a normally distributed random variable with a mean of $20 and a standard deviation of $5. The average order has been increasing steadily over the years and the owner expects the mean order will increase by 2% per month. You have created the following spreadsheet to simulate the problem.
What is the probability that 3 or more phone calls are received in any hour of operation?
Instructions: Answer the following questions using the Analytic Solver Platform Excel add-in. Unlock Deck
Unlock for access to all 85 flashcards in this deck.
Unlock Deck
k this deck
77
Exhibit 12.5
The following questions use the information below.
The owner of Sal's Italian Restaurant wants to study the growth of his business using simulation. He is interested in simulating the number of customers and the amount ordered by customers each month. He currently serves 1000 customers per month and feels this can vary uniformly between a decrease of as much as 5% and an increase of up to 9%. The bill for each customer is a normally distributed random variable with a mean of $20 and a standard deviation of $5. The average order has been increasing steadily over the years and the owner expects the mean order will increase by 2% per month. You have created the following spreadsheet to simulate the problem.
Sal, from Exhibit 12.5, has produced the following spreadsheet to compute confidence intervals on his income. What formula should go in cell B8 to compute the upper limit on a 95% confidence interval for the true population mean?
Unlock Deck
Unlock for access to all 85 flashcards in this deck.
Unlock Deck
k this deck
78
Exhibit 12.5
The following questions use the information below.
The owner of Sal's Italian Restaurant wants to study the growth of his business using simulation. He is interested in simulating the number of customers and the amount ordered by customers each month. He currently serves 1000 customers per month and feels this can vary uniformly between a decrease of as much as 5% and an increase of up to 9%. The bill for each customer is a normally distributed random variable with a mean of $20 and a standard deviation of $5. The average order has been increasing steadily over the years and the owner expects the mean order will increase by 2% per month. You have created the following spreadsheet to simulate the problem.
What gallery distribution should be used for generating the number of times "tails" come up over 15 flips of a "fair" coin?
Unlock Deck
Unlock for access to all 85 flashcards in this deck.
Unlock Deck
k this deck
79
Exhibit 12.3
The following questions use the information below.
An auto parts store wants to simulate its inventory system for engine oil. The company has collected data on the shipping time for oil and the daily demand for cases of oil. A case of oil generates a $10 profit. Customers can buy oil at any auto parts store so there are no backorders (the company loses the sale and profit). The company orders 30 cases whenever the inventory position falls below the reorder point of 15 cases. Orders are placed at the beginning of the day and delivered at the beginning of the day so the oil is available on the arrival day. An average service level of 99% is desired. The following spreadsheets have been developed for this problem. The company has simulated 2 weeks of operation for their inventory system. The current level of on-hand inventory is 25 units and no orders are pending.
Using the information in Exhibit 12.3, what formula should go in cell J8 to determine the arrival date for an order?
A) =IF(I8=0,0,A8+I8)
B) =IF(I8=0,0,A8+1+I8)
C) =IF(I8=1,0,A8+1+I8)
D) =IF(I8=0,A8+1+I8,0)
Unlock Deck
Unlock for access to all 85 flashcards in this deck.
Unlock Deck
k this deck
80
Exhibit 12.3
The following questions use the information below.
An auto parts store wants to simulate its inventory system for engine oil. The company has collected data on the shipping time for oil and the daily demand for cases of oil. A case of oil generates a $10 profit. Customers can buy oil at any auto parts store so there are no backorders (the company loses the sale and profit). The company orders 30 cases whenever the inventory position falls below the reorder point of 15 cases. Orders are placed at the beginning of the day and delivered at the beginning of the day so the oil is available on the arrival day. An average service level of 99% is desired. The following spreadsheets have been developed for this problem. The company has simulated 2 weeks of operation for their inventory system. The current level of on-hand inventory is 25 units and no orders are pending.
Using the information in Exhibit 12.3, what formula should go in cell G9 to compute inventory position?
A) =G8+E9-IF(H8=1,$D$4,0)
B) =G8-E9+IF(H8=1,$D$4,0)
C) =G8-E9+IF(H8=1,$D$5,0)
D) =G8-E9+IF(H8=1,0,$D$4)
Unlock Deck
Unlock for access to all 85 flashcards in this deck.
Unlock Deck
k this deck
Unlock Deck
Unlock for access to all 85 flashcards in this deck.


