Deck 12: Population Growth and Regulation
Full screen (f)
Question
Question
Question
Question
Question
Question
Use this figure for questions 2 and 3.
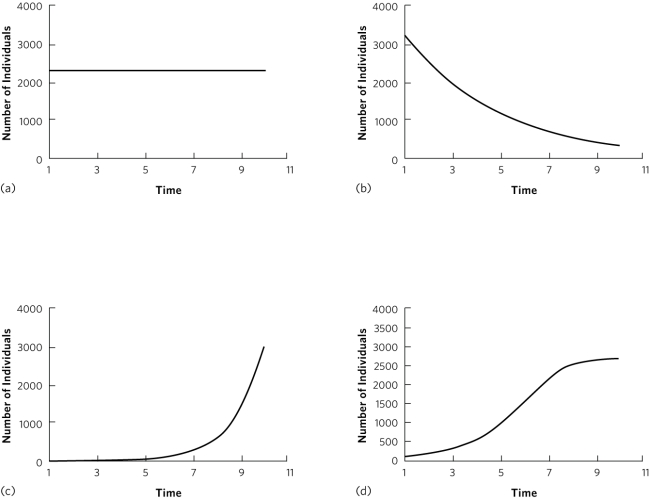
Which plot is consistent with an exponential growth model when r > 0?
A) I
B) II
C) III
D) IV
Which plot is consistent with an exponential growth model when r > 0?
A) I
B) II
C) III
D) IV
Question
Question
Question
Question
Use this figure for questions 2 and 3.
Which plot is consistent with a geometric growth model in which λ = 1?
A) I
B) II
C) III
D) IV
Which plot is consistent with a geometric growth model in which λ = 1?
A) I
B) II
C) III
D) IV
Question
Question
Question
Question
Question
Question
Question
Question
Question
Question
Question
Question
Question
Question
Question
Question
Question
Question
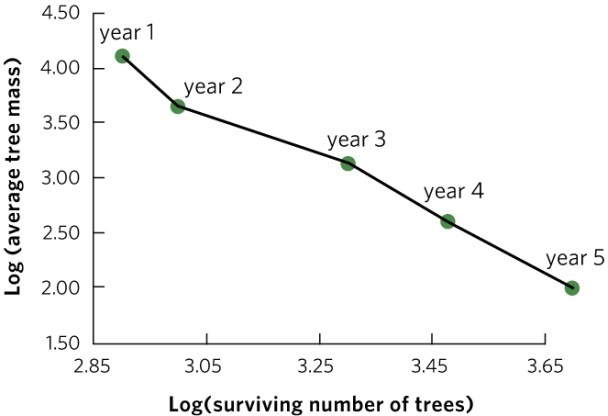
The graph shows one possible answer; students will have their own values. The figure should show log-transformed mass on the y axis and log-transformed survival on the x axis. The points they plot should form a negative slope.
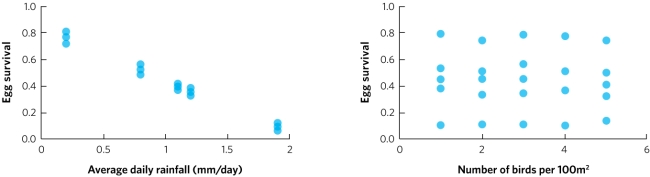
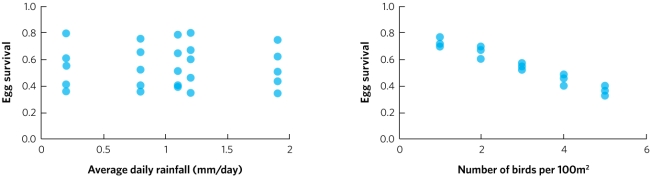
A biologist studies a population of birds for 25 years. Each year the biologist records the amount of rainfall and the density of birds (number of birds per 100 square metres). Additionally, the biologist determines the survival rate for eggs laid that year. The biologist then plots egg survival rate against both rainfall (graph a) and bird density (graph b). In each plot the individual points represent the data for one year of the study. Based on these data, does this population of birds appear to have positive density-dependent population regulation, negative density-dependent population regulation, or density-independent population regulation? As part of your answer, list the prediction for each type of population regulation and explain whether the data meet that prediction.
A biologist studies a population of birds for 25 years. Each year the biologist records the amount of rainfall and the density of birds (number of birds per 100 square metres). Additionally, the biologist determines the survival rate for eggs laid that year. The biologist then plots egg survival rate against both rainfall (graph a) and bird density (graph b). In each plot the individual points represent the data for one year of the study. Based on these data, does this population of birds appear to have positive density-dependent population regulation, negative density-dependent population regulation, or density-independent population regulation? As part of your answer, list the prediction for each type of population regulation and explain whether the data meet that prediction.
Question
Question
Question
Question
Example: Correct plot student might draw; student may vary units on y axis.
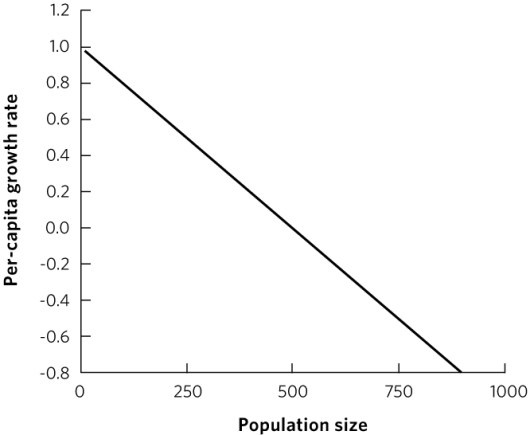
Using the logistic growth model, draw a line that shows the relationship between per capita growth rate (y axis) and population size (x axis) for a hypothetical population with a carrying capacity of 500 individuals. Explain how the slope relates to changes in population size over time and give an example of an environmental factor that could cause a population to follow a logistic model of population growth.
Using the logistic growth model, draw a line that shows the relationship between per capita growth rate (y axis) and population size (x axis) for a hypothetical population with a carrying capacity of 500 individuals. Explain how the slope relates to changes in population size over time and give an example of an environmental factor that could cause a population to follow a logistic model of population growth.
Question
You are a biologist studying a small fish that reproduces once every summer. In 2014, you add different numbers of this fish to five ponds-Sunny, Slimy, Lazy, Lucky, and Yucky-that do not contain any other fish. These five ponds are the same size and have the same environmental conditions. You return the next summer and estimate fish population size in 2015.

Which of the following is supported by the data?
A) The populations are growing exponentially.
B) The populations are regulated by density-independent processes.
C) The carrying capacity (K) is between 160 and 320 fish per pond.
D) The carrying capacity (K) is between 320 and 640 fish per pond.
E) The carrying capacity (K) is above 640 fish per pond.
Question
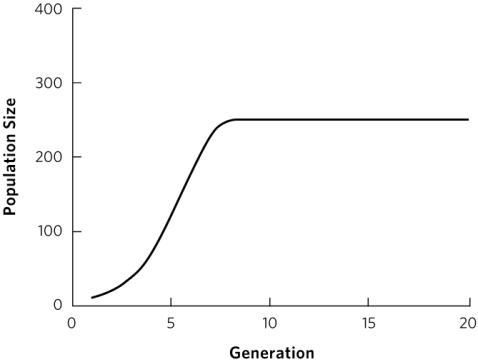
Which describes the figure of logistic population growth shown in the graph?
A) r > 0; K > 300
B) r < 0; K > 300
C) r > 0; K < 300
D) r < 0; K < 300
A) r > 0; K > 300
B) r < 0; K > 300
C) r > 0; K < 300
D) r < 0; K < 300
Question
Question
The graph shows one possible answer; students will have their own values. The figure should show log-transformed mass on the y axis and log-transformed survival on the x axis. The points they plot should form a negative slope.
(Alternative version with different figures.)A biologist studies a population of birds for 25 years. Each year the biologist records the amount of rainfall and the density of birds (number of birds per 100 square metres). Additionally, the biologist determines the survival rate for eggs laid that year. The biologist then plots egg survival rate against both rainfall (graph a) and density (graph b). In each plot the individual points represent the data for one year of the study. Based on these data, does this population of birds appear to be subject to positive density-dependent population regulation, negative density-dependent population regulation, or density-independent population regulation? As part of your answer, list the prediction for each type of population regulation and explain whether the data meet that prediction.
(Alternative version with different figures.)A biologist studies a population of birds for 25 years. Each year the biologist records the amount of rainfall and the density of birds (number of birds per 100 square metres). Additionally, the biologist determines the survival rate for eggs laid that year. The biologist then plots egg survival rate against both rainfall (graph a) and density (graph b). In each plot the individual points represent the data for one year of the study. Based on these data, does this population of birds appear to be subject to positive density-dependent population regulation, negative density-dependent population regulation, or density-independent population regulation? As part of your answer, list the prediction for each type of population regulation and explain whether the data meet that prediction.
Question
Question
Question
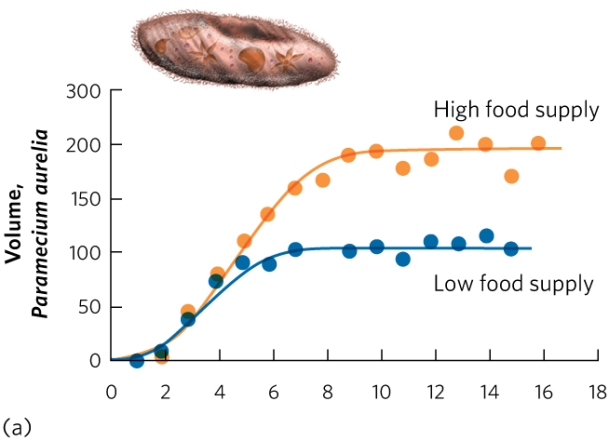
The figure shows the change in population size of Paramecium from Gause's experiment, raised in either high-food or low-food conditions. Based on this figure, how was the logistic growth model for Paramecium changed by adding food?
A) High food increased r.
B) High food decreased r.
C) High food increased K.
D) High food decreased K.
Question
Question
Question
The following table shows the survival and fecundity of a flowering plant. Use it to answer questions 47 to 49.

What is the R0 for this species?
A) 30
B) 24
C) 1.664
D) 0.1152
What is the R0 for this species?
A) 30
B) 24
C) 1.664
D) 0.1152
Question
Question
Question
Question
Question
Question
Use the following information and life tables to answer questions 44 to 46.
Recently, it has been hypothesized that coyotes living in urban environments can control the populations of geese living in public parks. To test this hypothesis, a biologist compares two populations of geese. Coyotes are removed from one park but allowed to remain in another park. Both populations contain 1000 geese when the experiment begins.

Which goose life stage is affected by predation from coyotes?
I) survival from egg to juvenile
II) survival from juvenile to adult
III) fecundity of adults
A) I only
B) II only
C) III only
D) I and II only
E) I and III only
Recently, it has been hypothesized that coyotes living in urban environments can control the populations of geese living in public parks. To test this hypothesis, a biologist compares two populations of geese. Coyotes are removed from one park but allowed to remain in another park. Both populations contain 1000 geese when the experiment begins.
Which goose life stage is affected by predation from coyotes?
I) survival from egg to juvenile
II) survival from juvenile to adult
III) fecundity of adults
A) I only
B) II only
C) III only
D) I and II only
E) I and III only
Question
You are a biologist studying deer populations in four parks: Chagrin, Bedford, Bradley, and Brookside. These four parks are all the same size, and they have similar weather. You estimate deer population size in October 2011, before winter comes. Then you estimate the size of the herd the next year, in October 2012. The data are listed in the table:

Explain whether each of the following statements is supported by the data and why or why not.
I. These populations have exponential growth.
II. The changes in population size are density dependent.
III. All of these populations are below their carrying capacity.
Explain whether each of the following statements is supported by the data and why or why not.
I. These populations have exponential growth.
II. The changes in population size are density dependent.
III. All of these populations are below their carrying capacity.
Question
Question
Question
Question
Question
The following table shows the survival and fecundity of a flowering plant. Use it to answer questions 47 to 49.
What is the generation time (T) of this species?
A) 4 years
B) 4.6 years
C) 5 years
D) 7.7 years
What is the generation time (T) of this species?
A) 4 years
B) 4.6 years
C) 5 years
D) 7.7 years
Question
Question
For 5 years a biologist studied a population of mice living in a field. The mice have three age classes: 1 year old, 2 years old, and 3 years old. The number of individuals in each age class over the course of the study is shown in the table. Use these data to answer questions 51 and 52.

The geometric mean growth rate (λ) from year 1 to year 2 is
A) 0.33.
B) 3.
C) 24.
D) 81.
The geometric mean growth rate (λ) from year 1 to year 2 is
A) 0.33.
B) 3.
C) 24.
D) 81.
Question
Consider a perennial plant with four life stages: seed, seedling, small adult, and large adult. Seeds survive to seedlings with a probability of 50 percent; seedlings survive to be small adults with a probability of 20 percent; small adults survive to be large adults with a probability of 20 percent. Both small adults and large adults produce an average 10 seeds. Use this information to fill in the life table that follows; then calculate the R0 and explain whether the population is increasing, stable, or decreasing.

R0: _____________________
R0: _____________________
Question
Question
Use the following information and life tables to answer questions 44 to 46.
Recently, it has been hypothesized that coyotes living in urban environments can control the populations of geese living in public parks. To test this hypothesis, a biologist compares two populations of geese. Coyotes are removed from one park but allowed to remain in another park. Both populations contain 1000 geese when the experiment begins.
Which is correct about the geese in these populations?
I) When coyotes are removed, goose R0 > 1.
II) When coyotes are removed, goose R0 < 1.
III) When coyotes are present, goose R0 > 1.
IV) When coyotes are present, goose R0 < 1.
A) I and III
B) I and IV
C) II and III
D) II and IV
Question
Question
The following table for a species of plant that has four life stages was constructed from research done in the 1960s.

Forty years later, biologists went back to the same site and determined the life table for the population, shown in the following table. On account of changing climatic conditions, seed survival decreased from 30 percent to 10 percent. However, these changing climactic conditions also cause large adults to produce four times as many seeds, so that they now produce 200 seeds. All other variables stay the same.

Explain whether the change in climate is beneficial or harmful to this plant population based on these tables. Be sure to reference any relevant calculations you should make and explain the relative importance of the decreased seed survival and increased seed production.
Forty years later, biologists went back to the same site and determined the life table for the population, shown in the following table. On account of changing climatic conditions, seed survival decreased from 30 percent to 10 percent. However, these changing climactic conditions also cause large adults to produce four times as many seeds, so that they now produce 200 seeds. All other variables stay the same.
Explain whether the change in climate is beneficial or harmful to this plant population based on these tables. Be sure to reference any relevant calculations you should make and explain the relative importance of the decreased seed survival and increased seed production.

Unlock Deck
Sign up to unlock the cards in this deck!
Unlock Deck
Unlock Deck
1/61
Play
Full screen (f)
Deck 12: Population Growth and Regulation
1
Under positive density dependence, population growth rate
A) increases as populations become larger.
B) remains the same as populations become larger.
C) decreases as populations become larger.
D) is highest at intermediate population size and lowest when population is large or small.
A) increases as populations become larger.
B) remains the same as populations become larger.
C) decreases as populations become larger.
D) is highest at intermediate population size and lowest when population is large or small.
A
2
Which reflects density-independent population regulation?
I) a winter storm that kills birds with equal probability regardless of bird abundance
II) a drought that kills a higher proportion of plants when there are many plants and a smaller proportion when there are fewer plants
III) a lethal disease that is more easily transmitted when animals are found in high abundance than in low abundance
A) I only
B) II only
C) III only
D) I and III
E) II and III
A
3
Consider a biologist studying a population of deer. At the beginning of the year, there are 100 adult deer in the population. Over the course of the year, 15 adult deer die, and an additional 25 deer are born. What can we conclude about λ for this year?
A) λ < 0
B) λ = 0
C) λ > 0
D) λ = 1
E) λ > 1
A) λ < 0
B) λ = 0
C) λ > 0
D) λ = 1
E) λ > 1
E
4
Which is likely to follow an exponential increase in population size?
I) a population of mice that has consumed most of the food in its habitat
II) a small population of rats recently introduced to an island with many resources
III) bacteria recently placed on a new Petri dish with suitable growth medium
A) I only
B) II only
C) III only
D) I and II only
E) II and III only
Unlock Deck
Unlock for access to all 61 flashcards in this deck.
Unlock Deck
k this deck
5
Which reflects negative density dependence?
I) A fungus infects and kills plants at a higher rate when they are abundant than when they are rare.
II) A group of birds has a higher per capita survival rate when it is large than when it is small.
III) A large population of deer exhausts local food supplies and has a high risk of death; a small population has plentiful food and low risk of death.
A) I only
B) II only
C) III only
D) I and II
E) I and III
Unlock Deck
Unlock for access to all 61 flashcards in this deck.
Unlock Deck
k this deck
6
Use this figure for questions 2 and 3.
Which plot is consistent with an exponential growth model when r > 0?
A) I
B) II
C) III
D) IV
Which plot is consistent with an exponential growth model when r > 0?
A) I
B) II
C) III
D) IV
Unlock Deck
Unlock for access to all 61 flashcards in this deck.
Unlock Deck
k this deck
7
Which illustrates a negative relationship between population density and the average size of individuals over time?
A) an exponential growth curve
B) a J-shaped curve
C) a survivorship curve
D) a self-thinning curve
A) an exponential growth curve
B) a J-shaped curve
C) a survivorship curve
D) a self-thinning curve
Unlock Deck
Unlock for access to all 61 flashcards in this deck.
Unlock Deck
k this deck
8
Describe how the geometric growth model is different from the exponential growth model. For each growth model, give an example of an organism that fits the growth pattern it describes. Explain why the organism fits the model.
Unlock Deck
Unlock for access to all 61 flashcards in this deck.
Unlock Deck
k this deck
9
The intrinsic growth rate, r, is
A) the number of new individuals produced minus the number that die.
B) the highest possible per capita increase in population size under ideal conditions.
C) the time it takes for a population to double in size.
D) the maximum population size that can be supported by the environment.
A) the number of new individuals produced minus the number that die.
B) the highest possible per capita increase in population size under ideal conditions.
C) the time it takes for a population to double in size.
D) the maximum population size that can be supported by the environment.
Unlock Deck
Unlock for access to all 61 flashcards in this deck.
Unlock Deck
k this deck
10
Use this figure for questions 2 and 3.
Which plot is consistent with a geometric growth model in which λ = 1?
A) I
B) II
C) III
D) IV
Which plot is consistent with a geometric growth model in which λ = 1?
A) I
B) II
C) III
D) IV
Unlock Deck
Unlock for access to all 61 flashcards in this deck.
Unlock Deck
k this deck
11
Negative density dependence occurs when the
A) per capita population growth rate increases as population becomes larger.
B) per capita population growth rate remains constant as population becomes larger.
C) per capita population growth rate decreases as population becomes larger.
D) population increases without limit.
E) population decreases until it becomes extinct.
Unlock Deck
Unlock for access to all 61 flashcards in this deck.
Unlock Deck
k this deck
12
In a population growing according to the exponential growth model, population size is
A) limited by density-dependent factors.
B) limited by density-independent factors.
C) limited by both density-dependent and density-independent factors.
D) not limited.
A) limited by density-dependent factors.
B) limited by density-independent factors.
C) limited by both density-dependent and density-independent factors.
D) not limited.
Unlock Deck
Unlock for access to all 61 flashcards in this deck.
Unlock Deck
k this deck
13
The Allee effect describes
A) density-independent population regulation.
B) negative density-dependent population regulation.
C) positive density-dependent population regulation.
D) logistic population growth.
A) density-independent population regulation.
B) negative density-dependent population regulation.
C) positive density-dependent population regulation.
D) logistic population growth.
Unlock Deck
Unlock for access to all 61 flashcards in this deck.
Unlock Deck
k this deck
14
A species of louse (an external parasite) infests salmon. Researchers have found that the lice have difficulty finding a mate when there are only a few lice on an individual fish. The lice find mates more easily and produce more offspring when there are many lice on an individual fish. This is an example of
A) the geometric growth model.
B) positive density-dependent population regulation.
C) negative density-dependent population regulation.
D) density-independent population regulation.
A) the geometric growth model.
B) positive density-dependent population regulation.
C) negative density-dependent population regulation.
D) density-independent population regulation.
Unlock Deck
Unlock for access to all 61 flashcards in this deck.
Unlock Deck
k this deck
15
In the exponential growth model, which term indicates the intrinsic rate of increase?
A) N0
B) e
C) r
D) t
A) N0
B) e
C) r
D) t
Unlock Deck
Unlock for access to all 61 flashcards in this deck.
Unlock Deck
k this deck
16
In what way is the geometric growth model different from the exponential growth model?
A) The geometric growth model uses continuous time.
B) The geometric growth model uses regular time intervals.
C) The geometric growth model includes carrying capacity (K).
D) The exponential growth model includes carrying capacity (K).
A) The geometric growth model uses continuous time.
B) The geometric growth model uses regular time intervals.
C) The geometric growth model includes carrying capacity (K).
D) The exponential growth model includes carrying capacity (K).
Unlock Deck
Unlock for access to all 61 flashcards in this deck.
Unlock Deck
k this deck
17
According to the exponential growth model, which would reduce a population's doubling time?
A) an increase in the initial population size
B) a decrease in the initial population size
C) an increase in the intrinsic growth rate
D) a decrease in the intrinsic growth rate
A) an increase in the initial population size
B) a decrease in the initial population size
C) an increase in the intrinsic growth rate
D) a decrease in the intrinsic growth rate
Unlock Deck
Unlock for access to all 61 flashcards in this deck.
Unlock Deck
k this deck
18
Define population doubling time. Starting with the model for exponential population growth, explain how to derive the formula for population doubling time.
Unlock Deck
Unlock for access to all 61 flashcards in this deck.
Unlock Deck
k this deck
19
Which reflects positive density-dependent population regulation?
I) Small populations of flowers produce fewer seeds per individual than large populations of flowers.
II) Large groups of birds are better able to detect and avoid predators than small groups of birds.
III) The probability that a squirrel will be killed by a forest predator does not depend on the size of the squirrel population.
A) I only
B) II only
C) III only
D) I and II
E) I and III
Unlock Deck
Unlock for access to all 61 flashcards in this deck.
Unlock Deck
k this deck
20
According to an exponential growth population model, when the number of births is less than the number of deaths,
A) r < 0.
B) r = 0.
C) 0 ≤ r ≤ 1.
D) r > 1.
A) r < 0.
B) r = 0.
C) 0 ≤ r ≤ 1.
D) r > 1.
Unlock Deck
Unlock for access to all 61 flashcards in this deck.
Unlock Deck
k this deck
21
In the logistic growth model, under which condition is the per capita rate of increase the highest?
A) N = K
B) N =
C) N =
D) N = K + r
A) N = K
B) N =
C) N =
D) N = K + r
Unlock Deck
Unlock for access to all 61 flashcards in this deck.
Unlock Deck
k this deck
22
A biologist grew 10 groups of flowers in 1-square-metre plots of soil. In five plots, the biologist planted 20 flowers, and in the other five plots, the biologist planted 100 flowers. At the end of the summer, the biologist counted the seeds that each flower produced and found 100 seeds per plant in the plot with 20 plants and 500 seeds per plant in the plot with 100 plants. This is an example of
A) density-independent population regulation.
B) positive density-dependent population regulation.
C) negative density-dependent population regulation.
D) self-thinning curve.
A) density-independent population regulation.
B) positive density-dependent population regulation.
C) negative density-dependent population regulation.
D) self-thinning curve.
Unlock Deck
Unlock for access to all 61 flashcards in this deck.
Unlock Deck
k this deck
23
Which is the most accurate statement about the conservation biology of species with positive density-dependent population regulation?
A) If the population is small, it may not be able to increase.
B) The population will quickly exhaust all resources.
C) Species with positive density dependence are not at risk for extinction.
D) Population growth rate is highest when N > K.
A) If the population is small, it may not be able to increase.
B) The population will quickly exhaust all resources.
C) Species with positive density dependence are not at risk for extinction.
D) Population growth rate is highest when N > K.
Unlock Deck
Unlock for access to all 61 flashcards in this deck.
Unlock Deck
k this deck
24
In the logistic growth model, which term determines how quickly a population will initially grow from low density?
A) r
B) N
C) K
D) dN/dt
A) r
B) N
C) K
D) dN/dt
Unlock Deck
Unlock for access to all 61 flashcards in this deck.
Unlock Deck
k this deck
25
Alpine ibex are a type of wild goat that lives high in the mountains. During winters with heavy snow, Alpine ibex have high mortality rates, but when winters have little snow, Alpine ibex have low mortality rates. This is an example of
A) geometric growth.
B) positive density-dependent population regulation.
C) negative density-dependent population regulation.
D) density-independent population regulation.
A) geometric growth.
B) positive density-dependent population regulation.
C) negative density-dependent population regulation.
D) density-independent population regulation.
Unlock Deck
Unlock for access to all 61 flashcards in this deck.
Unlock Deck
k this deck
26
Which of the following statements about the logistic growth model is accurate?
I) The per capita rate of population increase declines as population size increases.
II) The overall rate of population increase is highest at K/2.
III) The overall rate of population growth is negative when N is greater than K/2.
A) I only
B) II only
C) III only
D) I and II only
E) I and III only
I) The per capita rate of population increase declines as population size increases.
II) The overall rate of population increase is highest at K/2.
III) The overall rate of population growth is negative when N is greater than K/2.
A) I only
B) II only
C) III only
D) I and II only
E) I and III only
Unlock Deck
Unlock for access to all 61 flashcards in this deck.
Unlock Deck
k this deck
27
Which form of population growth results in an S-shaped curve?
A) exponential growth
B) geometric growth
C) logistic growth
D) density-independent growth
A) exponential growth
B) geometric growth
C) logistic growth
D) density-independent growth
Unlock Deck
Unlock for access to all 61 flashcards in this deck.
Unlock Deck
k this deck
28
The graph shows one possible answer; students will have their own values. The figure should show log-transformed mass on the y axis and log-transformed survival on the x axis. The points they plot should form a negative slope.
A biologist studies a population of birds for 25 years. Each year the biologist records the amount of rainfall and the density of birds (number of birds per 100 square metres). Additionally, the biologist determines the survival rate for eggs laid that year. The biologist then plots egg survival rate against both rainfall (graph a) and bird density (graph b). In each plot the individual points represent the data for one year of the study. Based on these data, does this population of birds appear to have positive density-dependent population regulation, negative density-dependent population regulation, or density-independent population regulation? As part of your answer, list the prediction for each type of population regulation and explain whether the data meet that prediction.
A biologist studies a population of birds for 25 years. Each year the biologist records the amount of rainfall and the density of birds (number of birds per 100 square metres). Additionally, the biologist determines the survival rate for eggs laid that year. The biologist then plots egg survival rate against both rainfall (graph a) and bird density (graph b). In each plot the individual points represent the data for one year of the study. Based on these data, does this population of birds appear to have positive density-dependent population regulation, negative density-dependent population regulation, or density-independent population regulation? As part of your answer, list the prediction for each type of population regulation and explain whether the data meet that prediction.
Unlock Deck
Unlock for access to all 61 flashcards in this deck.
Unlock Deck
k this deck
29
A park biologist is planting saplings (young trees) in an old field that has recently been turned into a park. Draw a hypothetical self-thinning curve for these trees over 5 years. Be sure to label the axes. Describe a practical use of this curve.
Unlock Deck
Unlock for access to all 61 flashcards in this deck.
Unlock Deck
k this deck
30
The logistic growth model describes a maximum population size that is
A) limited by density-dependent factors.
B) limited by density-independent factors.
C) limited by both density-dependent and density-independent factors.
D) not limited by any factors.
A) limited by density-dependent factors.
B) limited by density-independent factors.
C) limited by both density-dependent and density-independent factors.
D) not limited by any factors.
Unlock Deck
Unlock for access to all 61 flashcards in this deck.
Unlock Deck
k this deck
31
In the logistic growth model, in which of the following conditions is the overall rate of increase the highest?
A) N = K
B) N =
C) N =
D) N = K + r
A) N = K
B) N =
C) N =
D) N = K + r
Unlock Deck
Unlock for access to all 61 flashcards in this deck.
Unlock Deck
k this deck
32
Example: Correct plot student might draw; student may vary units on y axis.
Using the logistic growth model, draw a line that shows the relationship between per capita growth rate (y axis) and population size (x axis) for a hypothetical population with a carrying capacity of 500 individuals. Explain how the slope relates to changes in population size over time and give an example of an environmental factor that could cause a population to follow a logistic model of population growth.
Using the logistic growth model, draw a line that shows the relationship between per capita growth rate (y axis) and population size (x axis) for a hypothetical population with a carrying capacity of 500 individuals. Explain how the slope relates to changes in population size over time and give an example of an environmental factor that could cause a population to follow a logistic model of population growth.
Unlock Deck
Unlock for access to all 61 flashcards in this deck.
Unlock Deck
k this deck
33
You are a biologist studying a small fish that reproduces once every summer. In 2014, you add different numbers of this fish to five ponds-Sunny, Slimy, Lazy, Lucky, and Yucky-that do not contain any other fish. These five ponds are the same size and have the same environmental conditions. You return the next summer and estimate fish population size in 2015.
Which of the following is supported by the data?
A) The populations are growing exponentially.
B) The populations are regulated by density-independent processes.
C) The carrying capacity (K) is between 160 and 320 fish per pond.
D) The carrying capacity (K) is between 320 and 640 fish per pond.
E) The carrying capacity (K) is above 640 fish per pond.
Unlock Deck
Unlock for access to all 61 flashcards in this deck.
Unlock Deck
k this deck
34
Which describes the figure of logistic population growth shown in the graph?
A) r > 0; K > 300
B) r < 0; K > 300
C) r > 0; K < 300
D) r < 0; K < 300
A) r > 0; K > 300
B) r < 0; K > 300
C) r > 0; K < 300
D) r < 0; K < 300
Unlock Deck
Unlock for access to all 61 flashcards in this deck.
Unlock Deck
k this deck
35
The larvae of a carnivorous species of salamander inhabit ponds. When the pond contains few larvae, they mostly eat small invertebrates and have a high survival rate. When there are many salamander larvae in a pond, the larvae will also cannibalize each other and have a low survival rate. This is an example of
A) geometric growth.
B) positive density-dependent population regulation.
C) negative density-dependent population regulation.
D) density-independent population regulation.
A) geometric growth.
B) positive density-dependent population regulation.
C) negative density-dependent population regulation.
D) density-independent population regulation.
Unlock Deck
Unlock for access to all 61 flashcards in this deck.
Unlock Deck
k this deck
36
The graph shows one possible answer; students will have their own values. The figure should show log-transformed mass on the y axis and log-transformed survival on the x axis. The points they plot should form a negative slope.
(Alternative version with different figures.)A biologist studies a population of birds for 25 years. Each year the biologist records the amount of rainfall and the density of birds (number of birds per 100 square metres). Additionally, the biologist determines the survival rate for eggs laid that year. The biologist then plots egg survival rate against both rainfall (graph a) and density (graph b). In each plot the individual points represent the data for one year of the study. Based on these data, does this population of birds appear to be subject to positive density-dependent population regulation, negative density-dependent population regulation, or density-independent population regulation? As part of your answer, list the prediction for each type of population regulation and explain whether the data meet that prediction.
(Alternative version with different figures.)A biologist studies a population of birds for 25 years. Each year the biologist records the amount of rainfall and the density of birds (number of birds per 100 square metres). Additionally, the biologist determines the survival rate for eggs laid that year. The biologist then plots egg survival rate against both rainfall (graph a) and density (graph b). In each plot the individual points represent the data for one year of the study. Based on these data, does this population of birds appear to be subject to positive density-dependent population regulation, negative density-dependent population regulation, or density-independent population regulation? As part of your answer, list the prediction for each type of population regulation and explain whether the data meet that prediction.
Unlock Deck
Unlock for access to all 61 flashcards in this deck.
Unlock Deck
k this deck
37
In the logistic growth model, which term determines the maximum number of individuals a population can sustain?
A) r
B) N
C) K
D) dN/dt
A) r
B) N
C) K
D) dN/dt
Unlock Deck
Unlock for access to all 61 flashcards in this deck.
Unlock Deck
k this deck
38
Which factors could limit a species' carrying capacity?
I) the amount of food available
II) the number of eggs a female can produce
III) the number of nesting sites present
A) I only
B) II only
C) III only
D) I and II
E) I and III
I) the amount of food available
II) the number of eggs a female can produce
III) the number of nesting sites present
A) I only
B) II only
C) III only
D) I and II
E) I and III
Unlock Deck
Unlock for access to all 61 flashcards in this deck.
Unlock Deck
k this deck
39
The figure shows the change in population size of Paramecium from Gause's experiment, raised in either high-food or low-food conditions. Based on this figure, how was the logistic growth model for Paramecium changed by adding food?
A) High food increased r.
B) High food decreased r.
C) High food increased K.
D) High food decreased K.
Unlock Deck
Unlock for access to all 61 flashcards in this deck.
Unlock Deck
k this deck
40
Which accurately describes the inflection point in the logistic growth model?
I) Population growth slows after the inflection point.
II) The inflection point is equal to the carrying capacity.
III) The highest growth rate occurs at the inflection point.
A) I only
B) II only
C) III only
D) I and II
E) I and III
I) Population growth slows after the inflection point.
II) The inflection point is equal to the carrying capacity.
III) The highest growth rate occurs at the inflection point.
A) I only
B) II only
C) III only
D) I and II
E) I and III
Unlock Deck
Unlock for access to all 61 flashcards in this deck.
Unlock Deck
k this deck
41
A biologist is studying a population of raccoons that live in a park. The population contains 50 males and 50 females. The biologist determines that R0 = 2. How many female raccoons are expected to be in the park next year?
A) 25
B) 48
C) 50
D) 52
E) 100
A) 25
B) 48
C) 50
D) 52
E) 100
Unlock Deck
Unlock for access to all 61 flashcards in this deck.
Unlock Deck
k this deck
42
The following table shows the survival and fecundity of a flowering plant. Use it to answer questions 47 to 49.
What is the R0 for this species?
A) 30
B) 24
C) 1.664
D) 0.1152
What is the R0 for this species?
A) 30
B) 24
C) 1.664
D) 0.1152
Unlock Deck
Unlock for access to all 61 flashcards in this deck.
Unlock Deck
k this deck
43
Applying life tables to sea turtle conservation demonstrated that the most effective way to increase sea turtle populations is to
A) raise large numbers of hatchlings and release them into the ocean.
B) protect nests from human poaching and other predators.
C) protect adults from being captured in fishing nets.
D) harvest small numbers of adults for human consumption each year.
A) raise large numbers of hatchlings and release them into the ocean.
B) protect nests from human poaching and other predators.
C) protect adults from being captured in fishing nets.
D) harvest small numbers of adults for human consumption each year.
Unlock Deck
Unlock for access to all 61 flashcards in this deck.
Unlock Deck
k this deck
44
The age structure of a population is often represented by a pyramid. What does an age structure pyramid with a broad base and a narrow top indicate about a population?
A) The population is declining.
B) The population is growing.
C) The population is stable.
D) The shape of the pyramid does not provide information on population growth.
A) The population is declining.
B) The population is growing.
C) The population is stable.
D) The shape of the pyramid does not provide information on population growth.
Unlock Deck
Unlock for access to all 61 flashcards in this deck.
Unlock Deck
k this deck
45
A disadvantage of static life tables is that
A) they require following individuals for their entire lifespan.
B) environmental conditions in any given year may confound survival data for a specific age group.
C) environmental conditions at the time of data collection may confound survival data across all age classes.
D) they cannot be used for long-lived organisms.
Unlock Deck
Unlock for access to all 61 flashcards in this deck.
Unlock Deck
k this deck
46
Which describes this population?
I) The population has a stable age distribution.
II) The population's growth is consistent with a geometric model.
III) The population's growth is consistent with a logistic model in which K = 1900.
A) I only
B) II only
C) III only
D) I and II only
E) I and III only
I) The population has a stable age distribution.
II) The population's growth is consistent with a geometric model.
III) The population's growth is consistent with a logistic model in which K = 1900.
A) I only
B) II only
C) III only
D) I and II only
E) I and III only
Unlock Deck
Unlock for access to all 61 flashcards in this deck.
Unlock Deck
k this deck
47
Which is consistent with the results of this experiment?
A) Goose populations are increasing in both populations but at different rates.
B) Goose populations are decreasing in both populations but at different rates.
C) Goose populations are increasing with coyotes and decreasing without coyotes.
D) Goose populations are decreasing with coyotes and increasing without coyotes.
Unlock Deck
Unlock for access to all 61 flashcards in this deck.
Unlock Deck
k this deck
48
Use the following information and life tables to answer questions 44 to 46.
Recently, it has been hypothesized that coyotes living in urban environments can control the populations of geese living in public parks. To test this hypothesis, a biologist compares two populations of geese. Coyotes are removed from one park but allowed to remain in another park. Both populations contain 1000 geese when the experiment begins.
Which goose life stage is affected by predation from coyotes?
I) survival from egg to juvenile
II) survival from juvenile to adult
III) fecundity of adults
A) I only
B) II only
C) III only
D) I and II only
E) I and III only
Unlock Deck
Unlock for access to all 61 flashcards in this deck.
Unlock Deck
k this deck
49
You are a biologist studying deer populations in four parks: Chagrin, Bedford, Bradley, and Brookside. These four parks are all the same size, and they have similar weather. You estimate deer population size in October 2011, before winter comes. Then you estimate the size of the herd the next year, in October 2012. The data are listed in the table:
Explain whether each of the following statements is supported by the data and why or why not.
I. These populations have exponential growth.
II. The changes in population size are density dependent.
III. All of these populations are below their carrying capacity.
Explain whether each of the following statements is supported by the data and why or why not.
I. These populations have exponential growth.
II. The changes in population size are density dependent.
III. All of these populations are below their carrying capacity.
Unlock Deck
Unlock for access to all 61 flashcards in this deck.
Unlock Deck
k this deck
50
All cohort life tables
A) follow individuals born at the same time from birth to death.
B) quantify the survival and fecundity of all individuals at a single time interval.
C) have a stable age distribution.
D) describe a population at its carrying capacity.
A) follow individuals born at the same time from birth to death.
B) quantify the survival and fecundity of all individuals at a single time interval.
C) have a stable age distribution.
D) describe a population at its carrying capacity.
Unlock Deck
Unlock for access to all 61 flashcards in this deck.
Unlock Deck
k this deck
51
This plant species is has a(n)
A) type I survivorship curve.
B) type II survivorship curve.
C) type III survivorship curve.
D) S-shaped survivorship curve
A) type I survivorship curve.
B) type II survivorship curve.
C) type III survivorship curve.
D) S-shaped survivorship curve
Unlock Deck
Unlock for access to all 61 flashcards in this deck.
Unlock Deck
k this deck
52
What type of survivorship curve describes a species that has a high rate of juvenile mortality but low adult mortality?
A) type I curve
B) type II curve
C) type III curve
D) type I and type III curve
A) type I curve
B) type II curve
C) type III curve
D) type I and type III curve
Unlock Deck
Unlock for access to all 61 flashcards in this deck.
Unlock Deck
k this deck
53
Describe the similarities and differences between a cohort life table and a static life table. Give an actual example of each.
Unlock Deck
Unlock for access to all 61 flashcards in this deck.
Unlock Deck
k this deck
54
The following table shows the survival and fecundity of a flowering plant. Use it to answer questions 47 to 49.
What is the generation time (T) of this species?
A) 4 years
B) 4.6 years
C) 5 years
D) 7.7 years
What is the generation time (T) of this species?
A) 4 years
B) 4.6 years
C) 5 years
D) 7.7 years
Unlock Deck
Unlock for access to all 61 flashcards in this deck.
Unlock Deck
k this deck
55
Consider a biologist who is studying a fish. The biologist conducts an experiment with four treatments in artificial ponds of the same size. In the first treatment he adds 10 fish to each pond. In the second treatment he adds 100 fish to each pond. In the third treatment he adds 10 fish and additional food. In the fourth treatment he adds 100 fish and additional food. At the end of the experiment he finds that female fish in ponds with only 10 fish produce many more eggs than female fish in ponds with 100 fish. However, adding food did not alter the number of eggs each female fish produced. Explain what this experiment tells us about how these fish are affected by density-independent, positive density-dependent, or negative density-dependent factors.
Unlock Deck
Unlock for access to all 61 flashcards in this deck.
Unlock Deck
k this deck
56
For 5 years a biologist studied a population of mice living in a field. The mice have three age classes: 1 year old, 2 years old, and 3 years old. The number of individuals in each age class over the course of the study is shown in the table. Use these data to answer questions 51 and 52.
The geometric mean growth rate (λ) from year 1 to year 2 is
A) 0.33.
B) 3.
C) 24.
D) 81.
The geometric mean growth rate (λ) from year 1 to year 2 is
A) 0.33.
B) 3.
C) 24.
D) 81.
Unlock Deck
Unlock for access to all 61 flashcards in this deck.
Unlock Deck
k this deck
57
Consider a perennial plant with four life stages: seed, seedling, small adult, and large adult. Seeds survive to seedlings with a probability of 50 percent; seedlings survive to be small adults with a probability of 20 percent; small adults survive to be large adults with a probability of 20 percent. Both small adults and large adults produce an average 10 seeds. Use this information to fill in the life table that follows; then calculate the R0 and explain whether the population is increasing, stable, or decreasing.
R0: _____________________
R0: _____________________
Unlock Deck
Unlock for access to all 61 flashcards in this deck.
Unlock Deck
k this deck
58
When a population has a stable age distribution,
A) the total number of individuals stays constant over time.
B) the proportion of individuals in each age class remains constant.
C) the net reproductive rate is less than one.
D) it is at its carrying capacity.
A) the total number of individuals stays constant over time.
B) the proportion of individuals in each age class remains constant.
C) the net reproductive rate is less than one.
D) it is at its carrying capacity.
Unlock Deck
Unlock for access to all 61 flashcards in this deck.
Unlock Deck
k this deck
59
Use the following information and life tables to answer questions 44 to 46.
Recently, it has been hypothesized that coyotes living in urban environments can control the populations of geese living in public parks. To test this hypothesis, a biologist compares two populations of geese. Coyotes are removed from one park but allowed to remain in another park. Both populations contain 1000 geese when the experiment begins.
Which is correct about the geese in these populations?
I) When coyotes are removed, goose R0 > 1.
II) When coyotes are removed, goose R0 < 1.
III) When coyotes are present, goose R0 > 1.
IV) When coyotes are present, goose R0 < 1.
A) I and III
B) I and IV
C) II and III
D) II and IV
Unlock Deck
Unlock for access to all 61 flashcards in this deck.
Unlock Deck
k this deck
60
If a population has relatively few individuals in the young classes but many in the medium-aged and old classes, what can we conclude about population growth?
A) The population is declining.
B) The population is growing.
C) The population is stable.
D) The population is below carrying capacity.
A) The population is declining.
B) The population is growing.
C) The population is stable.
D) The population is below carrying capacity.
Unlock Deck
Unlock for access to all 61 flashcards in this deck.
Unlock Deck
k this deck
61
The following table for a species of plant that has four life stages was constructed from research done in the 1960s.
Forty years later, biologists went back to the same site and determined the life table for the population, shown in the following table. On account of changing climatic conditions, seed survival decreased from 30 percent to 10 percent. However, these changing climactic conditions also cause large adults to produce four times as many seeds, so that they now produce 200 seeds. All other variables stay the same.
Explain whether the change in climate is beneficial or harmful to this plant population based on these tables. Be sure to reference any relevant calculations you should make and explain the relative importance of the decreased seed survival and increased seed production.
Unlock Deck
Unlock for access to all 61 flashcards in this deck.
Unlock Deck
k this deck
Unlock Deck
Unlock for access to all 61 flashcards in this deck.


