Deck 13: Computer Simulation With Analytic Solver
Full screen (f)
Question
Question
Question
Question
Question
Question
Question
Question
Question
Question
Question
Question
Question
Question
Question
Question
Question
Question
Question
Question
Question
Question
Question
Question
Question
Question
Question
Question
Question
Question
Question
Question
Question
Question
Question
Question
Question
Question
Question
Question
Question
Question
Question
Question
Question
Question
Question
Question
Question
Question
Question
Question
Question
Question
Question
Question
Question
Question
Question
Question
Question
Question
Question
Question
The distribution shown below is most likely which of the following? 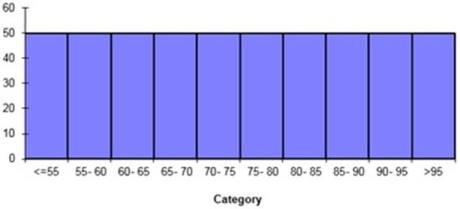
A) Normal distribution
B) Triangular distribution
C) Lognormal distribution
D) Uniform distribution
E) Exponential distribution
A) Normal distribution
B) Triangular distribution
C) Lognormal distribution
D) Uniform distribution
E) Exponential distribution
Question
The distribution shown below is most likely which of the following? 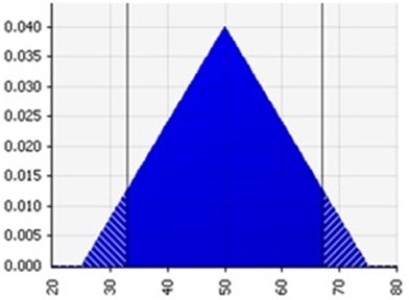
A) Normal distribution
B) Triangular distribution
C) Lognormal distribution
D) Integer uniform distribution
E) Exponential distribution
A) Normal distribution
B) Triangular distribution
C) Lognormal distribution
D) Integer uniform distribution
E) Exponential distribution
Question
Question
Question
Question
Question
Question
Question
Question
Question
Question
Question
Question
The distribution shown below is most likely which of the following? 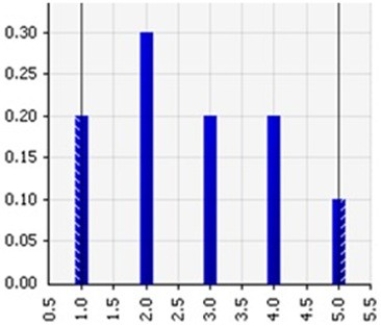
A) Normal distribution
B) Triangular distribution
C) Lognormal distribution
D) Integer uniform distribution
E) Exponential distribution
A) Normal distribution
B) Triangular distribution
C) Lognormal distribution
D) Integer uniform distribution
E) Exponential distribution

Unlock Deck
Sign up to unlock the cards in this deck!
Unlock Deck
Unlock Deck
1/77
Play
Full screen (f)
Deck 13: Computer Simulation With Analytic Solver
1
The exponential distribution is widely used to describe the time between random events.
True
2
The sensitivity chart in RSPE indicates the increase in the results cell per unit increase in the uncertain variable cell.
False
3
A danger of using the lognormal distribution is that values can fall below zero.
False
4
A danger of using the normal distribution is that values can fall below zero.
Unlock Deck
Unlock for access to all 77 flashcards in this deck.
Unlock Deck
k this deck
5
The distribution used for the uncertain variable cells is one of the options to be set in the Simulation Options in RSPE.
Unlock Deck
Unlock for access to all 77 flashcards in this deck.
Unlock Deck
k this deck
6
The binomial distribution describes the number of times an event occurs in a fixed number of trials.
Unlock Deck
Unlock for access to all 77 flashcards in this deck.
Unlock Deck
k this deck
7
Increasing the number of trials increases the accuracy of a simulation.
Unlock Deck
Unlock for access to all 77 flashcards in this deck.
Unlock Deck
k this deck
8
The number of trials is one of the options to be set in RSPE.
Unlock Deck
Unlock for access to all 77 flashcards in this deck.
Unlock Deck
k this deck
9
RSPE can be used to fit a continuous distribution to data.
Unlock Deck
Unlock for access to all 77 flashcards in this deck.
Unlock Deck
k this deck
10
The geometric distribution describes the number of times an event occurs in a fixed number of trials.
Unlock Deck
Unlock for access to all 77 flashcards in this deck.
Unlock Deck
k this deck
11
The negative binomial distribution describes the number of trials until an event occurs n times.
Unlock Deck
Unlock for access to all 77 flashcards in this deck.
Unlock Deck
k this deck
12
The custom distribution in RSPE allows only discrete distributions to be entered.
Unlock Deck
Unlock for access to all 77 flashcards in this deck.
Unlock Deck
k this deck
13
The sensitivity chart in RSPE indicates how strongly various uncertain variable cells influence the results cell.
Unlock Deck
Unlock for access to all 77 flashcards in this deck.
Unlock Deck
k this deck
14
The parameter analysis report in RSPE can be used to systematically investigate a set of values for a decision variable in a simulation model.
Unlock Deck
Unlock for access to all 77 flashcards in this deck.
Unlock Deck
k this deck
15
RSPE can be used to fit a discrete distribution to data.
Unlock Deck
Unlock for access to all 77 flashcards in this deck.
Unlock Deck
k this deck
16
The normal distribution is a good choice when all values within a range are equally likely.
Unlock Deck
Unlock for access to all 77 flashcards in this deck.
Unlock Deck
k this deck
17
A results cell refers to a random input cell.
Unlock Deck
Unlock for access to all 77 flashcards in this deck.
Unlock Deck
k this deck
18
The normal distribution has a fixed upper and lower bound.
Unlock Deck
Unlock for access to all 77 flashcards in this deck.
Unlock Deck
k this deck
19
The standard error gives an indication of the accuracy of the estimated mean.
Unlock Deck
Unlock for access to all 77 flashcards in this deck.
Unlock Deck
k this deck
20
The triangular distribution has a fixed upper and lower bound.
Unlock Deck
Unlock for access to all 77 flashcards in this deck.
Unlock Deck
k this deck
21
If an analyst knows the minimum and maximum values possible for a parameter, the triangular distribution is a good choice for modeling.
Unlock Deck
Unlock for access to all 77 flashcards in this deck.
Unlock Deck
k this deck
22
A trend chart shows the trend in profit values from trial to trial.
Unlock Deck
Unlock for access to all 77 flashcards in this deck.
Unlock Deck
k this deck
23
A grocery chain has decided to reduce the price of milk to encourage customers to purchase higher quantities. This is an example of revenue management.
Unlock Deck
Unlock for access to all 77 flashcards in this deck.
Unlock Deck
k this deck
24
Which of the following is not a step required to perform a simulation with RSPE?
A) Define the uncertain variable cells.
B) Define the results cells to forecast.
C) Set the simulation options.
D) Develop the spreadsheet model.
E) All are steps required to perform a simulation with RSPE.
A) Define the uncertain variable cells.
B) Define the results cells to forecast.
C) Set the simulation options.
D) Develop the spreadsheet model.
E) All are steps required to perform a simulation with RSPE.
Unlock Deck
Unlock for access to all 77 flashcards in this deck.
Unlock Deck
k this deck
25
If the mean value of a parameter is known, it is possible to use the normal distribution to model the parameter.
Unlock Deck
Unlock for access to all 77 flashcards in this deck.
Unlock Deck
k this deck
26
The triangular distribution is always a symmetric distribution.
Unlock Deck
Unlock for access to all 77 flashcards in this deck.
Unlock Deck
k this deck
27
The normal distribution is popular because it accurately portrays the variation observed in natural phenomenon.
Unlock Deck
Unlock for access to all 77 flashcards in this deck.
Unlock Deck
k this deck
28
Computer simulations of project management problems often use a triangular distribution to represent the task durations in a project management problem.
Unlock Deck
Unlock for access to all 77 flashcards in this deck.
Unlock Deck
k this deck
29
The use of different hotel rates for different classes of customers is known as revenue management.
Unlock Deck
Unlock for access to all 77 flashcards in this deck.
Unlock Deck
k this deck
30
The normal distribution is always a symmetric distribution.
Unlock Deck
Unlock for access to all 77 flashcards in this deck.
Unlock Deck
k this deck
31
Which of the following is a random input cell in RSPE?
A) An uncertain variable cell.
B) A decision variable.
C) A results cell.
D) A statistic cell.
E) None of the answer choices is correct.
A) An uncertain variable cell.
B) A decision variable.
C) A results cell.
D) A statistic cell.
E) None of the answer choices is correct.
Unlock Deck
Unlock for access to all 77 flashcards in this deck.
Unlock Deck
k this deck
32
The more trials that are run, the lower the standard error will become.
Unlock Deck
Unlock for access to all 77 flashcards in this deck.
Unlock Deck
k this deck
33
A probability distribution shows the relative likelihood of observing any particular value.
Unlock Deck
Unlock for access to all 77 flashcards in this deck.
Unlock Deck
k this deck
34
The ride sharing firm Uber uses dynamic pricing, which results in higher fares during busy times and lower fares during less busy times. This is an example of revenue management.
Unlock Deck
Unlock for access to all 77 flashcards in this deck.
Unlock Deck
k this deck
35
RSPE cannot handle constraints in a simulation model.
Unlock Deck
Unlock for access to all 77 flashcards in this deck.
Unlock Deck
k this deck
36
A central-tendency distribution is likely to have two separate peaks, indicating that two widely separated sets of values are equally likely.
Unlock Deck
Unlock for access to all 77 flashcards in this deck.
Unlock Deck
k this deck
37
RSPE is guaranteed to find the optimal solution to a simulation problem.
Unlock Deck
Unlock for access to all 77 flashcards in this deck.
Unlock Deck
k this deck
38
The PERT method for project management assumes that task durations follow a triangular distribution.
Unlock Deck
Unlock for access to all 77 flashcards in this deck.
Unlock Deck
k this deck
39
The PERT method for project management assumes that task durations follow a beta distribution.
Unlock Deck
Unlock for access to all 77 flashcards in this deck.
Unlock Deck
k this deck
40
The normal distribution is a good choice to represent the task durations in a project management problem.
Unlock Deck
Unlock for access to all 77 flashcards in this deck.
Unlock Deck
k this deck
41
Which of the following charts shows a histogram giving the relative frequency of the various output values in the forecast cell?
A) Frequency chart
B) Statistics table
C) Percentiles table
D) Cumulative frequency chart
E) Reverse cumulative chart
A) Frequency chart
B) Statistics table
C) Percentiles table
D) Cumulative frequency chart
E) Reverse cumulative chart
Unlock Deck
Unlock for access to all 77 flashcards in this deck.
Unlock Deck
k this deck
42
Which of the following distributions describes the number of times an event occurs during a given period of time or space?
A) Uniform distribution
B) Exponential distribution
C) Poisson distribution
D) Normal distribution
E) None of the answer choices is correct.
A) Uniform distribution
B) Exponential distribution
C) Poisson distribution
D) Normal distribution
E) None of the answer choices is correct.
Unlock Deck
Unlock for access to all 77 flashcards in this deck.
Unlock Deck
k this deck
43
Which of the following is not a characteristic of the uniform distribution?
A) It has a fixed minimum value
B) It has a fixed maximum value
C) Some value is the most likely
D) All of the answers choices are characteristic of the uniform distribution.
E) None of the answers choices is characteristic of the uniform distribution.
A) It has a fixed minimum value
B) It has a fixed maximum value
C) Some value is the most likely
D) All of the answers choices are characteristic of the uniform distribution.
E) None of the answers choices is characteristic of the uniform distribution.
Unlock Deck
Unlock for access to all 77 flashcards in this deck.
Unlock Deck
k this deck
44
Which of the following are advantages of computer simulation over analytical methods like PERT/CPM for predicting the probability that a project will complete by a deadline?
I) It does not need to make as many simplifying assumptions.
II) It is more flexible about which probability distributions can be used.
III) It provides a solution more quickly.
A) I only
B) II only
C) III only
D) I, II, and III
E) I and II only
I) It does not need to make as many simplifying assumptions.
II) It is more flexible about which probability distributions can be used.
III) It provides a solution more quickly.
A) I only
B) II only
C) III only
D) I, II, and III
E) I and II only
Unlock Deck
Unlock for access to all 77 flashcards in this deck.
Unlock Deck
k this deck
45
Which of the following distributions is widely used to describe the time between random events?
A) Uniform distribution
B) Exponential distribution
C) Poisson distribution
D) Normal distribution
E) None of the answer choices is correct.
A) Uniform distribution
B) Exponential distribution
C) Poisson distribution
D) Normal distribution
E) None of the answer choices is correct.
Unlock Deck
Unlock for access to all 77 flashcards in this deck.
Unlock Deck
k this deck
46
The cell that represents the output of a computer simulation is referred to as:
A) an uncertain variable cell.
B) a decision variable.
C) a results cell.
D) a statistic cell.
E) None of the answer choices is correct.
A) an uncertain variable cell.
B) a decision variable.
C) a results cell.
D) a statistic cell.
E) None of the answer choices is correct.
Unlock Deck
Unlock for access to all 77 flashcards in this deck.
Unlock Deck
k this deck
47
Which of the following is not a characteristic of the lognormal distribution?
A) Some value is the most likely.
B) It is negatively skewed (above the mean more likely).
C) Values cannot fall below zero.
D) Extreme values (high end only) are possible, but rare.
E) All of the answers choices are characteristic of the lognormal distribution.
A) Some value is the most likely.
B) It is negatively skewed (above the mean more likely).
C) Values cannot fall below zero.
D) Extreme values (high end only) are possible, but rare.
E) All of the answers choices are characteristic of the lognormal distribution.
Unlock Deck
Unlock for access to all 77 flashcards in this deck.
Unlock Deck
k this deck
48
Which of the following is not one of the charts or tables provided by RSPE?
A) Frequency chart
B) Statistics table
C) Standard error chart
D) Cumulative frequency chart
E) Percentiles table
A) Frequency chart
B) Statistics table
C) Standard error chart
D) Cumulative frequency chart
E) Percentiles table
Unlock Deck
Unlock for access to all 77 flashcards in this deck.
Unlock Deck
k this deck
49
Which of the following distributions describes the number of times an event occurs in a fixed number of trials?
A) Binomial distribution
B) Geometric distribution
C) Negative binomial distribution
D) Poisson distribution
E) None of the answer choices is correct.
A) Binomial distribution
B) Geometric distribution
C) Negative binomial distribution
D) Poisson distribution
E) None of the answer choices is correct.
Unlock Deck
Unlock for access to all 77 flashcards in this deck.
Unlock Deck
k this deck
50
When applying simulation to an inventory problem, which of the following is the most appropriate choice for the results cell?
A) The total profit
B) The holding cost per unit
C) The demand
D) All of the answers choices are correct.
E) None of the answer choices is correct.
A) The total profit
B) The holding cost per unit
C) The demand
D) All of the answers choices are correct.
E) None of the answer choices is correct.
Unlock Deck
Unlock for access to all 77 flashcards in this deck.
Unlock Deck
k this deck
51
Which of the following distributions describes the number of trials until an event occurs?
A) Binomial distribution
B) Geometric distribution
C) Negative binomial distribution
D) Poisson distribution
E) None of the answer choices is correct.
A) Binomial distribution
B) Geometric distribution
C) Negative binomial distribution
D) Poisson distribution
E) None of the answer choices is correct.
Unlock Deck
Unlock for access to all 77 flashcards in this deck.
Unlock Deck
k this deck
52
When applying simulation to an inventory problem, which of the following would be an uncertain variable cell?
A) The total profit
B) The holding cost per unit
C) The demand
D) All of the answers choices are correct.
E) None of the answer choices is correct.
A) The total profit
B) The holding cost per unit
C) The demand
D) All of the answers choices are correct.
E) None of the answer choices is correct.
Unlock Deck
Unlock for access to all 77 flashcards in this deck.
Unlock Deck
k this deck
53
Which of the following provide the mean, median, standard deviation, range, etc. for the results cell in RSPE?
A) Frequency chart
B) Statistics table
C) Percentiles table
D) Cumulative frequency chart
E) None of the answer choices is correct.
A) Frequency chart
B) Statistics table
C) Percentiles table
D) Cumulative frequency chart
E) None of the answer choices is correct.
Unlock Deck
Unlock for access to all 77 flashcards in this deck.
Unlock Deck
k this deck
54
Which chart indicates the trend in forecast values as a particular decision variable is varied?
A) Frequency chart
B) Trend chart
C) Cumulative frequency chart
D) Statistics table
E) None of the answer choices is correct.
A) Frequency chart
B) Trend chart
C) Cumulative frequency chart
D) Statistics table
E) None of the answer choices is correct.
Unlock Deck
Unlock for access to all 77 flashcards in this deck.
Unlock Deck
k this deck
55
The parameter analysis report can simultaneously vary up to how many different decision variables?
A) 1
B) 2
C) 3
D) 4
E) Any number of decision variables.
A) 1
B) 2
C) 3
D) 4
E) Any number of decision variables.
Unlock Deck
Unlock for access to all 77 flashcards in this deck.
Unlock Deck
k this deck
56
Which of the following is not a characteristic of the triangular distribution?
A) Some value is the most likely.
B) Values close to the most likely value are more common.
C) The most likely value is the mean.
D) It can be asymmetric.
E) It has a fixed upper and lower bound.
A) Some value is the most likely.
B) Values close to the most likely value are more common.
C) The most likely value is the mean.
D) It can be asymmetric.
E) It has a fixed upper and lower bound.
Unlock Deck
Unlock for access to all 77 flashcards in this deck.
Unlock Deck
k this deck
57
A distribution is chosen from the Distributions menu for which type of cell?
A) An uncertain variable cell
B) A decision variable
C) A results cell
D) A statistic cell
E) None of the answer choices is correct.
A) An uncertain variable cell
B) A decision variable
C) A results cell
D) A statistic cell
E) None of the answer choices is correct.
Unlock Deck
Unlock for access to all 77 flashcards in this deck.
Unlock Deck
k this deck
58
Which of the following is not a characteristic of the normal distribution?
A) Some value is the most likely.
B) Values closest to the mean are more likely.
C) It must be symmetric.
D) Values cannot fall below zero.
E) Extreme values are possible, but rare.
A) Some value is the most likely.
B) Values closest to the mean are more likely.
C) It must be symmetric.
D) Values cannot fall below zero.
E) Extreme values are possible, but rare.
Unlock Deck
Unlock for access to all 77 flashcards in this deck.
Unlock Deck
k this deck
59
Which of the following distributions describes the number of trials until an event occurs n times?
A) Binomial distribution
B) Geometric distribution
C) Negative binomial distribution
D) Poisson distribution
E) None of the answer choices is correct.
A) Binomial distribution
B) Geometric distribution
C) Negative binomial distribution
D) Poisson distribution
E) None of the answer choices is correct.
Unlock Deck
Unlock for access to all 77 flashcards in this deck.
Unlock Deck
k this deck
60
The sensitivity chart conveys which of the following?
A) The relative frequency of various results cell values
B) The increase in profit per unit increase in an uncertain variable cell
C) It indicates how strongly various uncertain variable cells influence the results cell
D) The mean profit
E) None of the answer choices is correct.
A) The relative frequency of various results cell values
B) The increase in profit per unit increase in an uncertain variable cell
C) It indicates how strongly various uncertain variable cells influence the results cell
D) The mean profit
E) None of the answer choices is correct.
Unlock Deck
Unlock for access to all 77 flashcards in this deck.
Unlock Deck
k this deck
61
A manager has observed sales for a number of days and developed the following table of probabilities. Which of the following distributions would be most appropriate for modeling the daily sales?
A) Normal distribution
B) Triangular distribution
C) Lognormal distribution
D) Integer uniform distribution
E) Custom discrete distribution
A) Normal distribution
B) Triangular distribution
C) Lognormal distribution
D) Integer uniform distribution
E) Custom discrete distribution
Unlock Deck
Unlock for access to all 77 flashcards in this deck.
Unlock Deck
k this deck
62
One way to ensure that Analytic Solver identifies an optimal solution quickly is to do which of the following?
I) Set the "Max Time without Improvement" setting to zero.
II) Add bounds for the decision variables.
III) Add integer constraints to the model.
A) I only
B) II only
C) III only
D) Only II and III
E) I, II, and III
I) Set the "Max Time without Improvement" setting to zero.
II) Add bounds for the decision variables.
III) Add integer constraints to the model.
A) I only
B) II only
C) III only
D) Only II and III
E) I, II, and III
Unlock Deck
Unlock for access to all 77 flashcards in this deck.
Unlock Deck
k this deck
63
Which of the following distributions would be most appropriate for modeling the number of students found in a small classroom?
A) Normal distribution
B) Triangular distribution
C) Lognormal distribution
D) Integer uniform distribution
E) Exponential distribution
A) Normal distribution
B) Triangular distribution
C) Lognormal distribution
D) Integer uniform distribution
E) Exponential distribution
Unlock Deck
Unlock for access to all 77 flashcards in this deck.
Unlock Deck
k this deck
64
The distribution shown below is most likely which of the following?
A) Normal distribution
B) Triangular distribution
C) Lognormal distribution
D) Uniform distribution
E) Exponential distribution
A) Normal distribution
B) Triangular distribution
C) Lognormal distribution
D) Uniform distribution
E) Exponential distribution
Unlock Deck
Unlock for access to all 77 flashcards in this deck.
Unlock Deck
k this deck
65
The distribution shown below is most likely which of the following?
A) Normal distribution
B) Triangular distribution
C) Lognormal distribution
D) Integer uniform distribution
E) Exponential distribution
A) Normal distribution
B) Triangular distribution
C) Lognormal distribution
D) Integer uniform distribution
E) Exponential distribution
Unlock Deck
Unlock for access to all 77 flashcards in this deck.
Unlock Deck
k this deck
66
Which of the following distributions is positively skewed?
I) Normal distribution
II) Uniform distribution
III) Lognormal distribution
IV) Exponential distribution
A) I only
B) II only
C) III only
D) IV only
E) Only III and IV
I) Normal distribution
II) Uniform distribution
III) Lognormal distribution
IV) Exponential distribution
A) I only
B) II only
C) III only
D) IV only
E) Only III and IV
Unlock Deck
Unlock for access to all 77 flashcards in this deck.
Unlock Deck
k this deck
67
Which of the following is a discrete distribution?
A) Normal distribution
B) Triangular distribution
C) Lognormal distribution
D) Integer uniform distribution
E) Exponential distribution
A) Normal distribution
B) Triangular distribution
C) Lognormal distribution
D) Integer uniform distribution
E) Exponential distribution
Unlock Deck
Unlock for access to all 77 flashcards in this deck.
Unlock Deck
k this deck
68
For a distribution that is positively skewed, which of the following is TRUE?
A) The mean and the standard deviation are equal.
B) The mean will be located to the right of the most likely value.
C) The mean will be located to the left of the most likely value.
D) All values are equally likely.
E) The mean and the most likely value will be the same.
A) The mean and the standard deviation are equal.
B) The mean will be located to the right of the most likely value.
C) The mean will be located to the left of the most likely value.
D) All values are equally likely.
E) The mean and the most likely value will be the same.
Unlock Deck
Unlock for access to all 77 flashcards in this deck.
Unlock Deck
k this deck
69
Which of the following distributions is not skewed?
I) Normal distribution
II) Uniform distribution
III) Lognormal distribution
IV) Exponential distribution
A) I only
B) II only
C) III only
D) IV only
E) Only I and II
I) Normal distribution
II) Uniform distribution
III) Lognormal distribution
IV) Exponential distribution
A) I only
B) II only
C) III only
D) IV only
E) Only I and II
Unlock Deck
Unlock for access to all 77 flashcards in this deck.
Unlock Deck
k this deck
70
Which of the following distributions has a fixed minimum and maximum?
I) Normal distribution
II) Triangular distribution
III) Lognormal distribution
IV) Exponential distribution
A) I only
B) II only
C) III only
D) IV only
E) Only I and II
I) Normal distribution
II) Triangular distribution
III) Lognormal distribution
IV) Exponential distribution
A) I only
B) II only
C) III only
D) IV only
E) Only I and II
Unlock Deck
Unlock for access to all 77 flashcards in this deck.
Unlock Deck
k this deck
71
Which of the following distributions has a fixed minimum and maximum?
I) Normal distribution
II) Uniform distribution
III) Lognormal distribution
IV) Exponential distribution
A) I only
B) II only
C) III only
D) IV only
E) Only I and II
I) Normal distribution
II) Uniform distribution
III) Lognormal distribution
IV) Exponential distribution
A) I only
B) II only
C) III only
D) IV only
E) Only I and II
Unlock Deck
Unlock for access to all 77 flashcards in this deck.
Unlock Deck
k this deck
72
The RSPE Solver can be used to simultaneously optimize up to how many decision variables?
A) 1
B) 2
C) 3
D) 4
E) Many decision variables can be optimized simultaneously.
A) 1
B) 2
C) 3
D) 4
E) Many decision variables can be optimized simultaneously.
Unlock Deck
Unlock for access to all 77 flashcards in this deck.
Unlock Deck
k this deck
73
Which of the following is NOT a continuous distribution?
A) Normal distribution
B) Triangular distribution
C) Lognormal distribution
D) Integer uniform distribution
E) Exponential distribution
A) Normal distribution
B) Triangular distribution
C) Lognormal distribution
D) Integer uniform distribution
E) Exponential distribution
Unlock Deck
Unlock for access to all 77 flashcards in this deck.
Unlock Deck
k this deck
74
The relative likelihood of any particular value is given by the height of the distribution's
A) central-tendency distribution.
B) probability density function.
C) cumulative density function.
D) most likely value.
E) standard deviation.
A) central-tendency distribution.
B) probability density function.
C) cumulative density function.
D) most likely value.
E) standard deviation.
Unlock Deck
Unlock for access to all 77 flashcards in this deck.
Unlock Deck
k this deck
75
The exponential distribution has a most likely value that is equal to
A) zero.
B) the mean.
C) the variance.
D) All of the answers choices are true.
E) None of the answer choices is true.
A) zero.
B) the mean.
C) the variance.
D) All of the answers choices are true.
E) None of the answer choices is true.
Unlock Deck
Unlock for access to all 77 flashcards in this deck.
Unlock Deck
k this deck
76
Which of the following is NOT a central-tendency distribution?
A) Normal distribution
B) Triangular distribution
C) Lognormal distribution
D) Uniform distribution
E) Exponential distribution
A) Normal distribution
B) Triangular distribution
C) Lognormal distribution
D) Uniform distribution
E) Exponential distribution
Unlock Deck
Unlock for access to all 77 flashcards in this deck.
Unlock Deck
k this deck
77
The distribution shown below is most likely which of the following?
A) Normal distribution
B) Triangular distribution
C) Lognormal distribution
D) Integer uniform distribution
E) Exponential distribution
A) Normal distribution
B) Triangular distribution
C) Lognormal distribution
D) Integer uniform distribution
E) Exponential distribution
Unlock Deck
Unlock for access to all 77 flashcards in this deck.
Unlock Deck
k this deck
Unlock Deck
Unlock for access to all 77 flashcards in this deck.


