Deck 12: A: linear Regression and Correlation
Full screen (f)
Question
In a simple linear regression , the following statistics are calculated from a sample of ten observations: 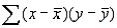 = 2250,
  = 10,
= 10,  = 50,
= 50,  = 75. Which of the following values equals the least-squares estimates of the slope and y-intercept, respectively?
A) 1.5 and 0.5
B) 1.5 and 2.5
C) 2.5 and -5.0
D) 2.5 and 1.5
= 2250, = 10, = 50, = 75. Which of the following values equals the least-squares estimates of the slope and y-intercept, respectively?A) 1.5 and 0.5
B) 1.5 and 2.5
C) 2.5 and -5.0
D) 2.5 and 1.5
Question
Question
Question
A regression analysis between weight (y in kg) and height (x in cm) resulted in the following least-squares line:  = -20 + 0.5x. Taking this into consideration, if the height is increased by 1 cm, what does this imply about the change in the weight, on average?
A) The weight will increase by 1/2 kg.
B) The weight will increase by 6 kg.
C) The weight will decrease by 1/2 kg.
D) The weight will decrease by 20 kg.
= -20 + 0.5x. Taking this into consideration, if the height is increased by 1 cm, what does this imply about the change in the weight, on average?A) The weight will increase by 1/2 kg.
B) The weight will increase by 6 kg.
C) The weight will decrease by 1/2 kg.
D) The weight will decrease by 20 kg.
Question
Question
In a regression setting, which of the following is NOT an assumption about the random error,  ?
?
A) The errors are linearly correlated.
B) The errors are normally distributed with a mean of 0 and a common variance.
C) The errors are independent in a probabilistic sense.
?A) The errors are linearly correlated.
B) The errors are normally distributed with a mean of 0 and a common variance.
C) The errors are independent in a probabilistic sense.
Question
If all of the values of an independent variable x are equal, then regressing a dependent variable y on this independent variable x will result in which of the following coefficients of determination (  )?
)?
A) -1.3
B) -1.0
C) 0.0
D) 1.0
)?A) -1.3
B) -1.0
C) 0.0
D) 1.0
Question
Question
If the sum of squares for error is equal to 0, then what must the coefficient of determination (  ) equal?
A) 1.5
B) 1.0
C) 0.0
D) -1.0
) equal?A) 1.5
B) 1.0
C) 0.0
D) -1.0
Question
Which of the following is a measure of how well an estimated regression line fits the sample data on which it is based, denoted by  (and equal to the proportion of the total variation in the values of the dependent variable, y, that can be explained by the association of y with x as measured by the estimated regression line)?
A) the sample coefficient of variation
B) the sample coefficient of correlation
C) the sample coefficient of determination
D) the sample coefficient of non-determination
(and equal to the proportion of the total variation in the values of the dependent variable, y, that can be explained by the association of y with x as measured by the estimated regression line)?A) the sample coefficient of variation
B) the sample coefficient of correlation
C) the sample coefficient of determination
D) the sample coefficient of non-determination
Question
Question
A regression analysis between sales (y in $1000) and advertising (x in $100) resulted in the following least-squares line:  = 82 + 7x. Given this information, if advertising costs were $900, what could we reasonably expect the amount of sales (in dollars) to be?
A) $6,382
B) $82,063
C) $88,300
D) $145,000
= 82 + 7x. Given this information, if advertising costs were $900, what could we reasonably expect the amount of sales (in dollars) to be?A) $6,382
B) $82,063
C) $88,300
D) $145,000
Question
Question
Question
Question
Question
A regression analysis between sales (in $1000) and advertising (in $100) resulted in the following least-squares line:  = 75 +6x. From this information, if advertising is $800, then what is the predicted amount of sales (in dollars)?
A) $4,875
B) $12,300
C) $123,000
D) $487,500
= 75 +6x. From this information, if advertising is $800, then what is the predicted amount of sales (in dollars)?A) $4,875
B) $12,300
C) $123,000
D) $487,500
Question
Given the least-squares regression line  = 5 -2x, what may be said about the relationship between the two variables?
A) The relationship between x and y is positive.
B) The relationship between x and y is negative.
C) As x increases, so does y.
D) As x decreases, so does y.
= 5 -2x, what may be said about the relationship between the two variables?A) The relationship between x and y is positive.
B) The relationship between x and y is negative.
C) As x increases, so does y.
D) As x decreases, so does y.
Question
A regression analysis between sales (in $1000) and advertising (in $) resulted in the following least-squares line:  = 80,000 + 5x. What does this imply?
A) An increase of $1 in advertising is expected, on average, to result in an increase of $5 in sales.
B) An increase of $5 in advertising is expected, on average, to result in an increase of $5000 in sales.
C) An increase of $1 in advertising is expected, on average, to result in an increase of $5000 in sales.
D) An increase of $1 in advertising is expected, on average, to result in an increase of $80,005 in sales.
= 80,000 + 5x. What does this imply?A) An increase of $1 in advertising is expected, on average, to result in an increase of $5 in sales.
B) An increase of $5 in advertising is expected, on average, to result in an increase of $5000 in sales.
C) An increase of $1 in advertising is expected, on average, to result in an increase of $5000 in sales.
D) An increase of $1 in advertising is expected, on average, to result in an increase of $80,005 in sales.
Question
Question
In a simple linear regression , the following sums of squares are produced: 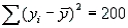 ,
, 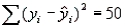 , and
, and 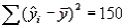 . What percentage of the variation in y may be explained by the variation in x?
A) 25%
B) 33%
C) 50%
D) 75%
, , and . What percentage of the variation in y may be explained by the variation in x?A) 25%
B) 33%
C) 50%
D) 75%
Question
Question
Question
Question
In simple linear regression, the plot of residuals versus fitted values  can be used to check for which of the following
A) normality
B) a constant variance independent of x
C) independence
can be used to check for which of the followingA) normality
B) a constant variance independent of x
C) independence
Question
Question
Which of the following is measured by the coefficient of determination  ?
?
A) the amount of variation in y that is explained by variation in x
B) the amount of variation in x that is explained by variation in y
C) the amount of variation in y that is not explained by variation in x
D) the amount of variation in x that is not explained by variation in y
?A) the amount of variation in y that is explained by variation in x
B) the amount of variation in x that is explained by variation in y
C) the amount of variation in y that is not explained by variation in x
D) the amount of variation in x that is not explained by variation in y
Question
In simple linear regression, most often we perform a two-tailed test of the population slope  to determine whether there is sufficient evidence to infer that a linear relationship exists. How should we state the null hypothesis?
A)
B)
C)
D)
to determine whether there is sufficient evidence to infer that a linear relationship exists. How should we state the null hypothesis?A)
B)
C)
D)
Question
In the least-squares regression line  = 3 - 2x, which of the following is the correct predicted value of y?
A) 1.0 when x = 1.0
B) 1.0 when x = -1.0
C) 2.0 when x = 1.0
D) 2.0 when x = -1.0
= 3 - 2x, which of the following is the correct predicted value of y?A) 1.0 when x = 1.0
B) 1.0 when x = -1.0
C) 2.0 when x = 1.0
D) 2.0 when x = -1.0
Question
Given the least-squares regression line  = -2.48 + 1.63x, and a coefficient of determination of 0.81, what is the coefficient of correlation?
A) -0.85
B) 0.85
C) -0.90
D) 0.90
= -2.48 + 1.63x, and a coefficient of determination of 0.81, what is the coefficient of correlation?A) -0.85
B) 0.85
C) -0.90
D) 0.90
Question
Question
Question
Question
Question
Question
What is the symbol for the population coefficient of correlation?
A) r
B)
C) r2
D)
A) r
B)
C) r2
D)
Question
Question
Question
Question
Question
Which of the following is the appropriate null hypothesis to test whether a population correlation is 0?
A)
B)
C)
D)
A)
B)
C)
D)
Question
Question
Question
Question
Question
Question
Question
Question
A sample of 25 observations is selected, and the sample correlation coefficient between the variables x and y is r = 0.525. What is the test statistic value for testing  vs.
vs. 
A) about 3.81
B) about 3.65
C) about 3.08
D) about 2.96
vs. A) about 3.81
B) about 3.65
C) about 3.08
D) about 2.96
Question
Question
Question
Question
Given the least-squares regression line  = -4.63 + 1.38x, and a coefficient of determination of 0.9025, what is the correlation coefficient?
A) -0.95
B) -0.81
C) +0.95
D) +1.38
= -4.63 + 1.38x, and a coefficient of determination of 0.9025, what is the correlation coefficient?A) -0.95
B) -0.81
C) +0.95
D) +1.38
Question
Question
Question
Question
Question
Question
Question
Question
Question
Question
Question
A regression analysis between sales (in $1000) and advertising (in $100) resulted in the following least-squares line:  = 77 + 8x. This implies that if advertising is $600, then the predicted amount of sales is $125,000.
= 77 + 8x. This implies that if advertising is $600, then the predicted amount of sales is $125,000. Question
The values of a and b found in the equation of the estimated regression line  represent the line's y-intercept and slope, respectively, and are called estimated regression coefficients.
represent the line's y-intercept and slope, respectively, and are called estimated regression coefficients. Question
Question
The residuals are observations of the error variable  . Consequently, the minimized sum of squared deviations is called the sum of squares for error.
. Consequently, the minimized sum of squared deviations is called the sum of squares for error. Question
The values of α and  found in the equation of the true regression line E(y) =
  represent the line's y-intercept and slope, respectively, and are called true regression coefficients.
found in the equation of the true regression line E(y) = represent the line's y-intercept and slope, respectively, and are called true regression coefficients. Question
In simple linear regression, if the estimated values  and the corresponding actual values
  are equal, then the standard error of estimate, SE(
  ), must equal -1.0.
and the corresponding actual values are equal, then the standard error of estimate, SE( ), must equal -1.0. Question
A regression analysis between sales (in $1000) and advertising (in $) resulted in the following least-squares line:  = 60 + 5x. This implies that an increase of $1 in advertising is expected to result in an increase of $65 in sales.
= 60 + 5x. This implies that an increase of $1 in advertising is expected to result in an increase of $65 in sales. Question
Question
Question
A regression analysis between weight (  , in kg) and height (
  , in cm) resulted in the following least-squares line:
  = -5 + 0.4
  . This implies that if the height is increased by 1 cm, the weight is expected to increase by an average of 0.4 kg.
, in kg) and height ( , in cm) resulted in the following least-squares line: = -5 + 0.4 . This implies that if the height is increased by 1 cm, the weight is expected to increase by an average of 0.4 kg. Question
Question
Question
Question
Question
Question
A measure of how well an estimated regression line fits the sample data on which it is based (denoted by  and equal to the proportion of the total variation in the values of the dependent variable, y, that can be explained by the association of y with x as measured by the estimated regression line) is called the sample coefficient of correlation.
and equal to the proportion of the total variation in the values of the dependent variable, y, that can be explained by the association of y with x as measured by the estimated regression line) is called the sample coefficient of correlation. Question

Unlock Deck
Sign up to unlock the cards in this deck!
Unlock Deck
Unlock Deck
1/131
Play
Full screen (f)
Deck 12: A: linear Regression and Correlation
1
In a simple linear regression , the following statistics are calculated from a sample of ten observations: = 2250, = 10, = 50, = 75. Which of the following values equals the least-squares estimates of the slope and y-intercept, respectively?
A) 1.5 and 0.5
B) 1.5 and 2.5
C) 2.5 and -5.0
D) 2.5 and 1.5
= 2250, = 10, = 50, = 75. Which of the following values equals the least-squares estimates of the slope and y-intercept, respectively?A) 1.5 and 0.5
B) 1.5 and 2.5
C) 2.5 and -5.0
D) 2.5 and 1.5
C
2
Which of the following correctly describes a true regression line?
A) It is represented by the equation E(y) =.
B) It is a line calculated from sample data by the method of least squares.
C) The values ofandfound in the equation of the true regression line represent the line's slope and intercept, respectively.
D) The response y is related to the independent variable x.
A
3
Which of the following correctly describes an estimated regression line?
A) It is a line calculated from census data by the method of least squares.
B) It might be represented by the equation.
C) The values of a and b found in the equation of the estimated regression line represent the line's slope and intercept, respectively.
A) It is a line calculated from census data by the method of least squares.
B) It might be represented by the equation.
C) The values of a and b found in the equation of the estimated regression line represent the line's slope and intercept, respectively.
B
4
A regression analysis between weight (y in kg) and height (x in cm) resulted in the following least-squares line: = -20 + 0.5x. Taking this into consideration, if the height is increased by 1 cm, what does this imply about the change in the weight, on average?
A) The weight will increase by 1/2 kg.
B) The weight will increase by 6 kg.
C) The weight will decrease by 1/2 kg.
D) The weight will decrease by 20 kg.
= -20 + 0.5x. Taking this into consideration, if the height is increased by 1 cm, what does this imply about the change in the weight, on average?A) The weight will increase by 1/2 kg.
B) The weight will increase by 6 kg.
C) The weight will decrease by 1/2 kg.
D) The weight will decrease by 20 kg.
Unlock Deck
Unlock for access to all 131 flashcards in this deck.
Unlock Deck
k this deck
5
If an estimated regression line has a y-intercept of 10 and a slope of 4, then when x = 2 what is the actual value of y?
A) 18
B) 15
C) 14
D) y is unknown
A) 18
B) 15
C) 14
D) y is unknown
Unlock Deck
Unlock for access to all 131 flashcards in this deck.
Unlock Deck
k this deck
6
In a regression setting, which of the following is NOT an assumption about the random error, ?
A) The errors are linearly correlated.
B) The errors are normally distributed with a mean of 0 and a common variance.
C) The errors are independent in a probabilistic sense.
?A) The errors are linearly correlated.
B) The errors are normally distributed with a mean of 0 and a common variance.
C) The errors are independent in a probabilistic sense.
Unlock Deck
Unlock for access to all 131 flashcards in this deck.
Unlock Deck
k this deck
7
If all of the values of an independent variable x are equal, then regressing a dependent variable y on this independent variable x will result in which of the following coefficients of determination ( )?
A) -1.3
B) -1.0
C) 0.0
D) 1.0
)?A) -1.3
B) -1.0
C) 0.0
D) 1.0
Unlock Deck
Unlock for access to all 131 flashcards in this deck.
Unlock Deck
k this deck
8
In a simple linear regression analysis, if SSE = 27, Total SS = 63, then what is the approximate percentage of the variation in the dependent variable y that is explained by the independent variable x?
A) 27%
B) 43%
C) 57%
D) 63%
A) 27%
B) 43%
C) 57%
D) 63%
Unlock Deck
Unlock for access to all 131 flashcards in this deck.
Unlock Deck
k this deck
9
If the sum of squares for error is equal to 0, then what must the coefficient of determination ( ) equal?
A) 1.5
B) 1.0
C) 0.0
D) -1.0
) equal?A) 1.5
B) 1.0
C) 0.0
D) -1.0
Unlock Deck
Unlock for access to all 131 flashcards in this deck.
Unlock Deck
k this deck
10
Which of the following is a measure of how well an estimated regression line fits the sample data on which it is based, denoted by (and equal to the proportion of the total variation in the values of the dependent variable, y, that can be explained by the association of y with x as measured by the estimated regression line)?
A) the sample coefficient of variation
B) the sample coefficient of correlation
C) the sample coefficient of determination
D) the sample coefficient of non-determination
(and equal to the proportion of the total variation in the values of the dependent variable, y, that can be explained by the association of y with x as measured by the estimated regression line)?A) the sample coefficient of variation
B) the sample coefficient of correlation
C) the sample coefficient of determination
D) the sample coefficient of non-determination
Unlock Deck
Unlock for access to all 131 flashcards in this deck.
Unlock Deck
k this deck
11
In the simple linear regression model, what does the slope represent?
A) the value of y when x = 0
B) the average change in y per unit change in x
C) the value of x when y = 0
D) the average change in x per unit change in y
A) the value of y when x = 0
B) the average change in y per unit change in x
C) the value of x when y = 0
D) the average change in x per unit change in y
Unlock Deck
Unlock for access to all 131 flashcards in this deck.
Unlock Deck
k this deck
12
A regression analysis between sales (y in $1000) and advertising (x in $100) resulted in the following least-squares line: = 82 + 7x. Given this information, if advertising costs were $900, what could we reasonably expect the amount of sales (in dollars) to be?
A) $6,382
B) $82,063
C) $88,300
D) $145,000
= 82 + 7x. Given this information, if advertising costs were $900, what could we reasonably expect the amount of sales (in dollars) to be?A) $6,382
B) $82,063
C) $88,300
D) $145,000
Unlock Deck
Unlock for access to all 131 flashcards in this deck.
Unlock Deck
k this deck
13
In a simple linear regression analysis, which of the following best describes the standard error of the slope?
A) It is a measure of the amount of change in the dependent variable y for a one-unit change in the independent variable x.
B) It is a measure of the variation in the regression slope from sample to sample.
C) It is equal to the square root of the standard error of the estimate.
A) It is a measure of the amount of change in the dependent variable y for a one-unit change in the independent variable x.
B) It is a measure of the variation in the regression slope from sample to sample.
C) It is equal to the square root of the standard error of the estimate.
Unlock Deck
Unlock for access to all 131 flashcards in this deck.
Unlock Deck
k this deck
14
Which of the following is NOT an assumption for the simple linear regression model?
A) The distribution of the error terms will be skewed to left or right, depending on the values of the dependent variable.
B) The error terms have equal variances for all values of the independent variable.
C) The error terms are independent of each other.
D) The mean of the dependent variable for all levels of the independent variable can be connected by a straight line.
Unlock Deck
Unlock for access to all 131 flashcards in this deck.
Unlock Deck
k this deck
15
In regression analysis, what do the residuals represent?
A) the difference between the actual y values and their predicted values
B) the difference between the actual x values and their predicted values
C) the square root of the slope of the regression line
D) the change in y per unit change in x
A) the difference between the actual y values and their predicted values
B) the difference between the actual x values and their predicted values
C) the square root of the slope of the regression line
D) the change in y per unit change in x
Unlock Deck
Unlock for access to all 131 flashcards in this deck.
Unlock Deck
k this deck
16
For the values of the coefficient of determination listed below, which one yields the greatest value of sum of squares for regression given that the total sum of squares is 200?
A) -0.90
B) 0.00
C) 0.90
D) 0.98
A) -0.90
B) 0.00
C) 0.90
D) 0.98
Unlock Deck
Unlock for access to all 131 flashcards in this deck.
Unlock Deck
k this deck
17
A regression analysis between sales (in $1000) and advertising (in $100) resulted in the following least-squares line: = 75 +6x. From this information, if advertising is $800, then what is the predicted amount of sales (in dollars)?
A) $4,875
B) $12,300
C) $123,000
D) $487,500
= 75 +6x. From this information, if advertising is $800, then what is the predicted amount of sales (in dollars)?A) $4,875
B) $12,300
C) $123,000
D) $487,500
Unlock Deck
Unlock for access to all 131 flashcards in this deck.
Unlock Deck
k this deck
18
Given the least-squares regression line = 5 -2x, what may be said about the relationship between the two variables?
A) The relationship between x and y is positive.
B) The relationship between x and y is negative.
C) As x increases, so does y.
D) As x decreases, so does y.
= 5 -2x, what may be said about the relationship between the two variables?A) The relationship between x and y is positive.
B) The relationship between x and y is negative.
C) As x increases, so does y.
D) As x decreases, so does y.
Unlock Deck
Unlock for access to all 131 flashcards in this deck.
Unlock Deck
k this deck
19
A regression analysis between sales (in $1000) and advertising (in $) resulted in the following least-squares line: = 80,000 + 5x. What does this imply?
A) An increase of $1 in advertising is expected, on average, to result in an increase of $5 in sales.
B) An increase of $5 in advertising is expected, on average, to result in an increase of $5000 in sales.
C) An increase of $1 in advertising is expected, on average, to result in an increase of $5000 in sales.
D) An increase of $1 in advertising is expected, on average, to result in an increase of $80,005 in sales.
= 80,000 + 5x. What does this imply?A) An increase of $1 in advertising is expected, on average, to result in an increase of $5 in sales.
B) An increase of $5 in advertising is expected, on average, to result in an increase of $5000 in sales.
C) An increase of $1 in advertising is expected, on average, to result in an increase of $5000 in sales.
D) An increase of $1 in advertising is expected, on average, to result in an increase of $80,005 in sales.
Unlock Deck
Unlock for access to all 131 flashcards in this deck.
Unlock Deck
k this deck
20
In a simple linear regression , if the coefficient of determination is 0.96, what does this imply?
A) It means that 96% of the y values are positive.
B) It means that 90% of the total variation in y can be explained by the regression line.
C) It means that 96% of the x values are equal.
D) It means that 90% of the total variation in x can be explained by regression line.
A) It means that 96% of the y values are positive.
B) It means that 90% of the total variation in y can be explained by the regression line.
C) It means that 96% of the x values are equal.
D) It means that 90% of the total variation in x can be explained by regression line.
Unlock Deck
Unlock for access to all 131 flashcards in this deck.
Unlock Deck
k this deck
21
In a simple linear regression , the following sums of squares are produced: , , and . What percentage of the variation in y may be explained by the variation in x?
A) 25%
B) 33%
C) 50%
D) 75%
, , and . What percentage of the variation in y may be explained by the variation in x?A) 25%
B) 33%
C) 50%
D) 75%
Unlock Deck
Unlock for access to all 131 flashcards in this deck.
Unlock Deck
k this deck
22
Which of these coefficients of correlation (r) indicates a strong negative linear relationship between the two variables of interest?
A) -1.3
B) -0.9
C) 0.8
D) 0.9
A) -1.3
B) -0.9
C) 0.8
D) 0.9
Unlock Deck
Unlock for access to all 131 flashcards in this deck.
Unlock Deck
k this deck
23
In regression analysis, if the coefficient of determination is 1.0, which of the following statements can be deduced from this information?
A) The sum of squares for error must be 1.0.
B) The sum of squares for regression must be 1.0.
C) The sum of squares for error must be 0.0.
D) The sum of squares for regression must be 0.0.
A) The sum of squares for error must be 1.0.
B) The sum of squares for regression must be 1.0.
C) The sum of squares for error must be 0.0.
D) The sum of squares for regression must be 0.0.
Unlock Deck
Unlock for access to all 131 flashcards in this deck.
Unlock Deck
k this deck
24
A regression line using 25 observations produced SSR = 118.68 and SSE = 56.32. What was the standard error of estimate?
A) 2.2716
B) 2.1788
C) 1.5648
D) 1.5009
A) 2.2716
B) 2.1788
C) 1.5648
D) 1.5009
Unlock Deck
Unlock for access to all 131 flashcards in this deck.
Unlock Deck
k this deck
25
In simple linear regression, the plot of residuals versus fitted values can be used to check for which of the following
A) normality
B) a constant variance independent of x
C) independence
can be used to check for which of the followingA) normality
B) a constant variance independent of x
C) independence
Unlock Deck
Unlock for access to all 131 flashcards in this deck.
Unlock Deck
k this deck
26
In a regression the following pairs of (x, y) are given: (4, 1), (4, -1), (4, 0), (4, -2) and (4, 2). Which of the following statements may be deduced from the given information?
A) The correlation coefficient is -1.
B) The correlation coefficient is 0.
C) The correlation coefficient is 1.
D) The coefficient of determination is between -2 and 2.
A) The correlation coefficient is -1.
B) The correlation coefficient is 0.
C) The correlation coefficient is 1.
D) The coefficient of determination is between -2 and 2.
Unlock Deck
Unlock for access to all 131 flashcards in this deck.
Unlock Deck
k this deck
27
Which of the following is measured by the coefficient of determination ?
A) the amount of variation in y that is explained by variation in x
B) the amount of variation in x that is explained by variation in y
C) the amount of variation in y that is not explained by variation in x
D) the amount of variation in x that is not explained by variation in y
?A) the amount of variation in y that is explained by variation in x
B) the amount of variation in x that is explained by variation in y
C) the amount of variation in y that is not explained by variation in x
D) the amount of variation in x that is not explained by variation in y
Unlock Deck
Unlock for access to all 131 flashcards in this deck.
Unlock Deck
k this deck
28
In simple linear regression, most often we perform a two-tailed test of the population slope to determine whether there is sufficient evidence to infer that a linear relationship exists. How should we state the null hypothesis?
A)
B)
C)
D)
to determine whether there is sufficient evidence to infer that a linear relationship exists. How should we state the null hypothesis?A)
B)
C)
D)
Unlock Deck
Unlock for access to all 131 flashcards in this deck.
Unlock Deck
k this deck
29
In the least-squares regression line = 3 - 2x, which of the following is the correct predicted value of y?
A) 1.0 when x = 1.0
B) 1.0 when x = -1.0
C) 2.0 when x = 1.0
D) 2.0 when x = -1.0
= 3 - 2x, which of the following is the correct predicted value of y?A) 1.0 when x = 1.0
B) 1.0 when x = -1.0
C) 2.0 when x = 1.0
D) 2.0 when x = -1.0
Unlock Deck
Unlock for access to all 131 flashcards in this deck.
Unlock Deck
k this deck
30
Given the least-squares regression line = -2.48 + 1.63x, and a coefficient of determination of 0.81, what is the coefficient of correlation?
A) -0.85
B) 0.85
C) -0.90
D) 0.90
= -2.48 + 1.63x, and a coefficient of determination of 0.81, what is the coefficient of correlation?A) -0.85
B) 0.85
C) -0.90
D) 0.90
Unlock Deck
Unlock for access to all 131 flashcards in this deck.
Unlock Deck
k this deck
31
If the coefficient of correlation is 0.90, what is the percentage of the variation in the dependent variable y that is explained by the variation in the independent variable x?
A) 90%
B) 81%
C) 0.90%
D) 0.81%
A) 90%
B) 81%
C) 0.90%
D) 0.81%
Unlock Deck
Unlock for access to all 131 flashcards in this deck.
Unlock Deck
k this deck
32
Given that the sum of squares for error is 60 and the sum of squares for regression is 140, then what is the value of the coefficient of determination?
A) 0.300
B) 0.429
C) 0.700
D) 0.837
A) 0.300
B) 0.429
C) 0.700
D) 0.837
Unlock Deck
Unlock for access to all 131 flashcards in this deck.
Unlock Deck
k this deck
33
Which of these coefficients of correlation (r) indicates a strong positive linear relationship between the two variables of interest?
A) -1.3
B) -0.9
C) 0.8
D) 0.9
A) -1.3
B) -0.9
C) 0.8
D) 0.9
Unlock Deck
Unlock for access to all 131 flashcards in this deck.
Unlock Deck
k this deck
34
If the coefficient of determination is 0.975, then what may be said about the slope of the regression line?
A) It must be positive.
B) It must be negative.
C) It could be either positive or negative.
A) It must be positive.
B) It must be negative.
C) It could be either positive or negative.
Unlock Deck
Unlock for access to all 131 flashcards in this deck.
Unlock Deck
k this deck
35
What does the least-squares method for determining the best fit minimize?
A) total variation in the dependent variable
B) sum of squares for error
C) sum of squares for regression
D) total variation in the independent variable
A) total variation in the dependent variable
B) sum of squares for error
C) sum of squares for regression
D) total variation in the independent variable
Unlock Deck
Unlock for access to all 131 flashcards in this deck.
Unlock Deck
k this deck
36
What is the symbol for the population coefficient of correlation?
A) r
B)
C) r2
D)
A) r
B)
C) r2
D)
Unlock Deck
Unlock for access to all 131 flashcards in this deck.
Unlock Deck
k this deck
37
Testing whether the slope of the population regression line could be 0 is equivalent to testing which of the following?
A) whether the sample coefficient of correlation could be 0
B) whether the standard error of estimate could be 0
C) whether the population coefficient of correlation could be 0
D) whether the sum of squares for error could be 0
A) whether the sample coefficient of correlation could be 0
B) whether the standard error of estimate could be 0
C) whether the population coefficient of correlation could be 0
D) whether the sum of squares for error could be 0
Unlock Deck
Unlock for access to all 131 flashcards in this deck.
Unlock Deck
k this deck
38
If a simple linear regression model has no y-intercept, then which of the following may be deduced about the values of the variables?
A) All values of x are 0.
B) All values of y are 0.
C) When y = 0, x = 0.
D) When x = 0, y = 0.
A) All values of x are 0.
B) All values of y are 0.
C) When y = 0, x = 0.
D) When x = 0, y = 0.
Unlock Deck
Unlock for access to all 131 flashcards in this deck.
Unlock Deck
k this deck
39
Which value of the coefficient of correlation r indicates a stronger correlation than 0.65?
A) 0.60
B) 0.55
C) -0.45
D) -0.75
A) 0.60
B) 0.55
C) -0.45
D) -0.75
Unlock Deck
Unlock for access to all 131 flashcards in this deck.
Unlock Deck
k this deck
40
In a simple linear regression including n = 10 observations, which of the following critical values would be appropriate for a 95% confidence interval estimation for the average value of y?
A) 1.860
B) 2.228
C) 2.262
D) 2.306
A) 1.860
B) 2.228
C) 2.262
D) 2.306
Unlock Deck
Unlock for access to all 131 flashcards in this deck.
Unlock Deck
k this deck
41
Which of the following is the appropriate null hypothesis to test whether a population correlation is 0?
A)
B)
C)
D)
A)
B)
C)
D)
Unlock Deck
Unlock for access to all 131 flashcards in this deck.
Unlock Deck
k this deck
42
The value of the sum of squares for regression can never be larger than 100.
Unlock Deck
Unlock for access to all 131 flashcards in this deck.
Unlock Deck
k this deck
43
In order to predict with 90% confidence the expected value of y for a given value of x in a simple linear regression , a random sample of ten observations is taken. Which of the following t-table values would be used?
A) 2.306
B) 2.228
C) 1.860
D) 1.812
A) 2.306
B) 2.228
C) 1.860
D) 1.812
Unlock Deck
Unlock for access to all 131 flashcards in this deck.
Unlock Deck
k this deck
44
Which of the following is an indication of no linear relationship between two variables x and y?
A) a coefficient of correlation of 1
B) a coefficient of correlation of 0
C) a coefficient of determination of -1
D) a coefficient of determination of 1
A) a coefficient of correlation of 1
B) a coefficient of correlation of 0
C) a coefficient of determination of -1
D) a coefficient of determination of 1
Unlock Deck
Unlock for access to all 131 flashcards in this deck.
Unlock Deck
k this deck
45
In order to predict with 80% confidence the expected value of y for a given value of x in a simple linear regression , a random sample of 15 observations is taken. Which of the following t-table values would be used?
A) 1.350
B) 1.771
C) 2.160
D) 2.650
A) 1.350
B) 1.771
C) 2.160
D) 2.650
Unlock Deck
Unlock for access to all 131 flashcards in this deck.
Unlock Deck
k this deck
46
In a simple linear regression , if the sum of squares for regression is 90, then the total sum of squares is at least 90.
Unlock Deck
Unlock for access to all 131 flashcards in this deck.
Unlock Deck
k this deck
47
A study of 20 students showed that the correlation between the time spent writing a test and the number of hours studied the night before the test was 0.35. Using a level of significance equal to 0.05, what does this imply?
A) The sample correlation coefficient could be 0 since the test statistic does not fall into the rejection region.
B) The null hypothesis that the population mean is equal to 0 should not be rejected, and we should conclude that the true correlation coefficient is 0.
C) There is not enough statistical evidence to conclude that the true correlation coefficient is different from 0.
D) The null hypothesis that the population variance is equal to 0 should be rejected, and we should conclude that the true correlation coefficient is 0.
Unlock Deck
Unlock for access to all 131 flashcards in this deck.
Unlock Deck
k this deck
48
In a simple linear regression , if the sum of squares for regression is 90, then the sum of squares for error is at most 90.
Unlock Deck
Unlock for access to all 131 flashcards in this deck.
Unlock Deck
k this deck
49
A sample of 25 observations is selected, and the sample correlation coefficient between the variables x and y is r = 0.525. What is the test statistic value for testing vs.
A) about 3.81
B) about 3.65
C) about 3.08
D) about 2.96
vs. A) about 3.81
B) about 3.65
C) about 3.08
D) about 2.96
Unlock Deck
Unlock for access to all 131 flashcards in this deck.
Unlock Deck
k this deck
50
In a simple linear regression setting, the deterministic model equation determines an exact value of the dependent variable y when the value of the independent variable x is given, since all points must lie exactly on the line.
Unlock Deck
Unlock for access to all 131 flashcards in this deck.
Unlock Deck
k this deck
51
In publishing the results of some research work, the following values of the correlation coefficient were listed. Which one is incorrect?
A) 0.00
B) 0.05
C) 0.95
D) 1.05
A) 0.00
B) 0.05
C) 0.95
D) 1.05
Unlock Deck
Unlock for access to all 131 flashcards in this deck.
Unlock Deck
k this deck
52
In order to predict with 99% confidence the expected value of y for a given value of x in a simple linear regression , a random sample of ten observations is taken. Which of the following t-table values would be used?
A) 1.860
B) 2.306
C) 2.896
D) 3.355
A) 1.860
B) 2.306
C) 2.896
D) 3.355
Unlock Deck
Unlock for access to all 131 flashcards in this deck.
Unlock Deck
k this deck
53
Given the least-squares regression line = -4.63 + 1.38x, and a coefficient of determination of 0.9025, what is the correlation coefficient?
A) -0.95
B) -0.81
C) +0.95
D) +1.38
= -4.63 + 1.38x, and a coefficient of determination of 0.9025, what is the correlation coefficient?A) -0.95
B) -0.81
C) +0.95
D) +1.38
Unlock Deck
Unlock for access to all 131 flashcards in this deck.
Unlock Deck
k this deck
54
In order to predict with 98% confidence the expected value of y for a given value of x in a simple linear regression , a random sample of 15 observations is taken. Which of the following t-able values would be used?
A) 1.350
B) 1.771
C) 2.160
D) 2.650
A) 1.350
B) 1.771
C) 2.160
D) 2.650
Unlock Deck
Unlock for access to all 131 flashcards in this deck.
Unlock Deck
k this deck
55
In a simple linear regression setting, the probabilistic model equation allows for some deviation of the points about the regression line, making it a more practical model.
Unlock Deck
Unlock for access to all 131 flashcards in this deck.
Unlock Deck
k this deck
56
In a simple linear regression model, if the regression slope coefficient is negative, then the standard error of the estimate will be positive.
Unlock Deck
Unlock for access to all 131 flashcards in this deck.
Unlock Deck
k this deck
57
Which of the following statements is NOT a property of the residuals in simple linear regression model?
A) They sum to 0.
B) They have a mean of 0..
C They have a median of 0
C) They have a standard deviation of 1.
A) They sum to 0.
B) They have a mean of 0..
C They have a median of 0
C) They have a standard deviation of 1.
Unlock Deck
Unlock for access to all 131 flashcards in this deck.
Unlock Deck
k this deck
58
In a simple linear regression , if the sum of squares for regression is 90, then the correlation coefficient is 0.9.
Unlock Deck
Unlock for access to all 131 flashcards in this deck.
Unlock Deck
k this deck
59
The sum of squares for regression can never be larger than the sum of squares for error.
Unlock Deck
Unlock for access to all 131 flashcards in this deck.
Unlock Deck
k this deck
60
In a simple linear regression model, the regression slope coefficient will have the same sign as the correlation coefficient.
Unlock Deck
Unlock for access to all 131 flashcards in this deck.
Unlock Deck
k this deck
61
The value of the sum of squares for error can never be larger than the total sum of squares.
Unlock Deck
Unlock for access to all 131 flashcards in this deck.
Unlock Deck
k this deck
62
The method of least-squares requires that the sum of the squared deviations between actual y values in the scatter diagram and y values predicted by the regression line be minimized.
Unlock Deck
Unlock for access to all 131 flashcards in this deck.
Unlock Deck
k this deck
63
An automobile company in Ontario is interested in the relationship between the gender of its employees and employee productivity. A good starting point in this analysis would be to compute the coefficient of determination and the correlation coefficient.
Unlock Deck
Unlock for access to all 131 flashcards in this deck.
Unlock Deck
k this deck
64
A regression analysis between sales (in $1000) and advertising (in $100) resulted in the following least-squares line: = 77 + 8x. This implies that if advertising is $600, then the predicted amount of sales is $125,000.
= 77 + 8x. This implies that if advertising is $600, then the predicted amount of sales is $125,000. Unlock Deck
Unlock for access to all 131 flashcards in this deck.
Unlock Deck
k this deck
65
The values of a and b found in the equation of the estimated regression line represent the line's y-intercept and slope, respectively, and are called estimated regression coefficients.
represent the line's y-intercept and slope, respectively, and are called estimated regression coefficients. Unlock Deck
Unlock for access to all 131 flashcards in this deck.
Unlock Deck
k this deck
66
In regression analysis, the independent variable is a variable whose value is known and is being used to explain or predict the value of another variable.
Unlock Deck
Unlock for access to all 131 flashcards in this deck.
Unlock Deck
k this deck
67
The residuals are observations of the error variable . Consequently, the minimized sum of squared deviations is called the sum of squares for error.
. Consequently, the minimized sum of squared deviations is called the sum of squares for error. Unlock Deck
Unlock for access to all 131 flashcards in this deck.
Unlock Deck
k this deck
68
The values of α and found in the equation of the true regression line E(y) = represent the line's y-intercept and slope, respectively, and are called true regression coefficients.
found in the equation of the true regression line E(y) = represent the line's y-intercept and slope, respectively, and are called true regression coefficients. Unlock Deck
Unlock for access to all 131 flashcards in this deck.
Unlock Deck
k this deck
69
In simple linear regression, if the estimated values and the corresponding actual values are equal, then the standard error of estimate, SE( ), must equal -1.0.
and the corresponding actual values are equal, then the standard error of estimate, SE( ), must equal -1.0. Unlock Deck
Unlock for access to all 131 flashcards in this deck.
Unlock Deck
k this deck
70
A regression analysis between sales (in $1000) and advertising (in $) resulted in the following least-squares line: = 60 + 5x. This implies that an increase of $1 in advertising is expected to result in an increase of $65 in sales.
= 60 + 5x. This implies that an increase of $1 in advertising is expected to result in an increase of $65 in sales. Unlock Deck
Unlock for access to all 131 flashcards in this deck.
Unlock Deck
k this deck
71
If a least-squares regression line has a y-intercept of 6.84 and a slope of 2.16, then when x = 1 the actual value of y must be 9.
Unlock Deck
Unlock for access to all 131 flashcards in this deck.
Unlock Deck
k this deck
72
Regression analysis is a statistical method that seeks to establish an equation that allows the unknown value of one variable to be estimated from the known value of one or more other variables.
Unlock Deck
Unlock for access to all 131 flashcards in this deck.
Unlock Deck
k this deck
73
A regression analysis between weight ( , in kg) and height ( , in cm) resulted in the following least-squares line: = -5 + 0.4 . This implies that if the height is increased by 1 cm, the weight is expected to increase by an average of 0.4 kg.
, in kg) and height ( , in cm) resulted in the following least-squares line: = -5 + 0.4 . This implies that if the height is increased by 1 cm, the weight is expected to increase by an average of 0.4 kg. Unlock Deck
Unlock for access to all 131 flashcards in this deck.
Unlock Deck
k this deck
74
If two variables are related in a negative linear manner, the scatterplot will show points on the x,y-space that are generally moving from the upper left to the lower right.
Unlock Deck
Unlock for access to all 131 flashcards in this deck.
Unlock Deck
k this deck
75
The vertical spread of the data points about the regression line is measured by the y-intercept.
Unlock Deck
Unlock for access to all 131 flashcards in this deck.
Unlock Deck
k this deck
76
If the coefficient of determination is 0.982, then the slope of the regression line must be positive.
Unlock Deck
Unlock for access to all 131 flashcards in this deck.
Unlock Deck
k this deck
77
In regression analysis, the dependent variable is a variable whose value is unknown and is being explained or predicted with the help of another variable.
Unlock Deck
Unlock for access to all 131 flashcards in this deck.
Unlock Deck
k this deck
78
Given that the sum of squares for error is 52 and the sum of squares for regression is 148, then the coefficient of determination is 0.74.
Unlock Deck
Unlock for access to all 131 flashcards in this deck.
Unlock Deck
k this deck
79
A measure of how well an estimated regression line fits the sample data on which it is based (denoted by and equal to the proportion of the total variation in the values of the dependent variable, y, that can be explained by the association of y with x as measured by the estimated regression line) is called the sample coefficient of correlation.
and equal to the proportion of the total variation in the values of the dependent variable, y, that can be explained by the association of y with x as measured by the estimated regression line) is called the sample coefficient of correlation. Unlock Deck
Unlock for access to all 131 flashcards in this deck.
Unlock Deck
k this deck
80
One way to measure the strength of the relationship between the response variable y and the predictor variable x is to calculate the coefficient of determination, that is, the proportion of the total variation in y that is explained by the linear regression of y on x.
Unlock Deck
Unlock for access to all 131 flashcards in this deck.
Unlock Deck
k this deck
Unlock Deck
Unlock for access to all 131 flashcards in this deck.


