Deck 9: An Introduction to the Short Run
Full screen (f)
Question
Question
Question
Question
Question
Question
Question
Question
Question
Question
Question
Question
Question
Defining  as current output,
As potential output, and
As short-run output, which of the following equations defines short-run output as the short-run fluctuation's share of potential GDP?
A)
B)
C)
D)
E)
as current output, As potential output, and
As short-run output, which of the following equations defines short-run output as the short-run fluctuation's share of potential GDP?
A)
B)
C)
D)
E)
Question
Defining  as current output,
As potential output, and
As short-run fluctuations, which of the following equations is correct?
A)
B)
C)
D)
E)
as current output, As potential output, and
As short-run fluctuations, which of the following equations is correct?
A)
B)
C)
D)
E)
Question
Question
Question
Question
Question
Defining  as current output,
As potential output, and
As short-run fluctuations, which of the following equations is correct?
A)
B)
C)
D)
E)
as current output, As potential output, and
As short-run fluctuations, which of the following equations is correct?
A)
B)
C)
D)
E)
Question
Question
Question
Refer to the following figure when answering the following questions.
Figure 9.2: U.S. Output Fluctuations 1960-2015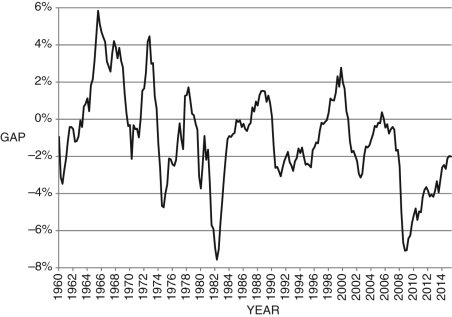
-Consider Figure 9.2. The line represents short-run fluctuations, . Since 1960, the largest economic "boom" was in about ________ and the deepest recession was in about ________.
A) 1983; 1965
B) 1974; 1976
C) 2000; 1983
D) 1966; 1983
E) The economy always produces at its potential.
Figure 9.2: U.S. Output Fluctuations 1960-2015
-Consider Figure 9.2. The line represents short-run fluctuations,
. Since 1960, the largest economic "boom" was in about ________ and the deepest recession was in about ________.A) 1983; 1965
B) 1974; 1976
C) 2000; 1983
D) 1966; 1983
E) The economy always produces at its potential.
Question
Question
Question
Question
Question
If current output is  billion and potential output
Billion, then the economy is in a ________ and
Is about ________ percent.
A) recessionary gap; -4.7
B) boom; 4.7
C) boom; -4.7
D) recessionary gap; -5
E) boom; 5
billion and potential output Billion, then the economy is in a ________ and
Is about ________ percent.
A) recessionary gap; -4.7
B) boom; 4.7
C) boom; -4.7
D) recessionary gap; -5
E) boom; 5
Question
Question
Question
Refer to the following figure when answering the following questions.
Figure 9.1: Output versus Time
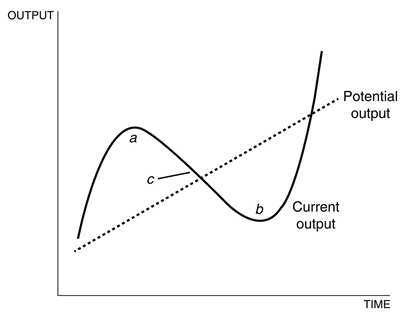
Considering Figure 9.1:
A) area a is where current output is less than potential output, and area b is where current output is greater than potential output.
B) area a is where current output is greater than potential output, and area b is where current output is less than potential output.
C) point c is where economic fluctuations are zero, and at point b, the economy is in a boom.
D) at point c, current output equals the short-term fluctuations.
E) area a is where current output is greater than potential output, and at point c, the economy is in a boom.
Figure 9.1: Output versus Time
Considering Figure 9.1:
A) area a is where current output is less than potential output, and area b is where current output is greater than potential output.
B) area a is where current output is greater than potential output, and area b is where current output is less than potential output.
C) point c is where economic fluctuations are zero, and at point b, the economy is in a boom.
D) at point c, current output equals the short-term fluctuations.
E) area a is where current output is greater than potential output, and at point c, the economy is in a boom.
Question
Refer to the following figure when answering the following questions.
Figure 9.2: U.S. Output Fluctuations 1960-2015
-Consider Figure 9.2. In approximately what years did the U.S. economy experience its longest economic expansion?
A) 1964-1970
B) 1978-1980
C) 1996-2001
D) 1972-1974
E) This cannot be determined from the information given.
Figure 9.2: U.S. Output Fluctuations 1960-2015
-Consider Figure 9.2. In approximately what years did the U.S. economy experience its longest economic expansion?
A) 1964-1970
B) 1978-1980
C) 1996-2001
D) 1972-1974
E) This cannot be determined from the information given.
Question
Question
Question
Defining  as current output, and
As potential output, how can the equation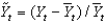
Be best defined?
A) the percentage deviation of current output from potential output
B) the difference between current output and potential output
C) the percentage deviation of potential output from current output
D) the deviation of current output from potential output
E) the difference between potential output and current output
as current output, and As potential output, how can the equation
Be best defined?
A) the percentage deviation of current output from potential output
B) the difference between current output and potential output
C) the percentage deviation of potential output from current output
D) the deviation of current output from potential output
E) the difference between potential output and current output
Question
If current output is  billion and potential output
Billion, then the economy is in a ________ and
Is about ________ percent.
A) boom;
B) recession;
C) recession;
D) boom; 6.7
E) None of these answers is correct.
billion and potential output Billion, then the economy is in a ________ and
Is about ________ percent.
A) boom;
B) recession;
C) recession;
D) boom; 6.7
E) None of these answers is correct.
Question
Refer to the following figure when answering the following questions.
Figure 9.2: U.S. Output Fluctuations 1960-2015
-Consider Figure 9.2. In 1989, the U.S. economy experienced an economic ________, and current output was about ________ percent above potential output.
A) boom; 1
B) recession; 1
C) boom; 2
D) This cannot be determined from the information given.
E) None of these answers is correct.
Question
Question
Question
Refer to the following figure when answering the following questions.
Figure 9.2: U.S. Output Fluctuations 1960-2015
-Consider Figure 9.2. In approximately which of the following years was current output equal to potential output?
A) 1966, 1974, 1979, 2000, and 2004
B) 1961, 1975, 1983, 2002, and 2009
C) 1963, 1970, 1974, 1985, 1998, 2001, and 2005
D) 1961, 1975, 1979, 2000, and 2008
E) 1966, 1974, 1983, 2002, and 2010
Question
Refer to the following figure when answering the following questions.
Figure 9.2: U.S. Output Fluctuations 1960-2015
-Consider Figure 9.2. In approximately what years did the U.S. economy experience its longest economic downturn, using the text's definition of a recessionary gap?
A) 1990-1997
B) 1974-1978
C) 1980-1988
D) 1957-1963
E) 2008-2016
Figure 9.2: U.S. Output Fluctuations 1960-2015
-Consider Figure 9.2. In approximately what years did the U.S. economy experience its longest economic downturn, using the text's definition of a recessionary gap?
A) 1990-1997
B) 1974-1978
C) 1980-1988
D) 1957-1963
E) 2008-2016
Question
Question
Question
Question
Question
Refer to the following figure when answering the following questions.
Figure 9.4: Phillips Curve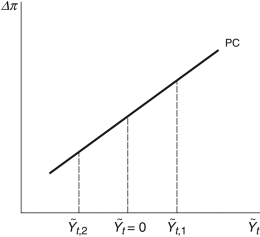
Consider the Phillips curve at in Figure 9.4. The economy is:
A)booming.
B)inflationary.
C)at its potential output.
D)in recession.
E)Not enough information is given to determine.
Figure 9.4: Phillips Curve
Consider the Phillips curve at
in Figure 9.4. The economy is:A)booming.
B)inflationary.
C)at its potential output.
D)in recession.
E)Not enough information is given to determine.
Question
Question
If  , the macroeconomy is:
A) at its potential level of output.
B) in a recessionary gap.
C) in an expansionary gap.
D) Not enough information is given.
E) None of these answers is correct.
, the macroeconomy is:A) at its potential level of output.
B) in a recessionary gap.
C) in an expansionary gap.
D) Not enough information is given.
E) None of these answers is correct.
Question
Question
Question
If  , the macroeconomy is:
A) in an expansionary gap.
B) at its potential level of output.
C) in a recessionary gap.
D) None of these answers is correct.
E) Not enough information is given.
, the macroeconomy is:A) in an expansionary gap.
B) at its potential level of output.
C) in a recessionary gap.
D) None of these answers is correct.
E) Not enough information is given.
Question
Refer to the following figure to answer the following questions.
Figure 9.3: Percent Change in U.S. Employment: 1980-2015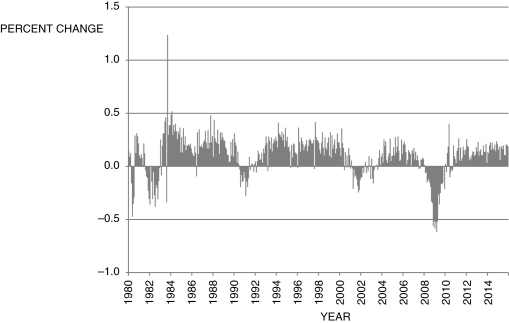
-Based on the data presented in Figure 9.3, which of the following periods is/are likely (an) expansion(s)?
A) 1988, 2006, and 2014
B) 1988 and 2014
C) 1981, 1990, and 2001
D) 2002
E) Not enough information is given.
Figure 9.3: Percent Change in U.S. Employment: 1980-2015
-Based on the data presented in Figure 9.3, which of the following periods is/are likely (an) expansion(s)?
A) 1988, 2006, and 2014
B) 1988 and 2014
C) 1981, 1990, and 2001
D) 2002
E) Not enough information is given.
Question
Question
Refer to the following figure when answering the following questions.
Figure 9.4: Phillips Curve
Consider the Phillips curve at in Figure 9.4. Which of the following is true?
A)The economy is booming.
B)The economy is deflationary.
C)The economy is at potential output.
D)The economy is in recession.
E)Unemployment is above the natural level.
Figure 9.4: Phillips Curve
Consider the Phillips curve at
in Figure 9.4. Which of the following is true?A)The economy is booming.
B)The economy is deflationary.
C)The economy is at potential output.
D)The economy is in recession.
E)Unemployment is above the natural level.
Question
If  , the macroeconomy is:
A) in a recessionary gap.
B) in an expansionary gap.
C) at its potential level of output.
D) Not enough information is given.
E) None of these answers is correct.
, the macroeconomy is:A) in a recessionary gap.
B) in an expansionary gap.
C) at its potential level of output.
D) Not enough information is given.
E) None of these answers is correct.
Question
Question
If  , the macroeconomy is:
A) in a recession.
B) in an expansionary gap.
C) at its potential level of output.
D) Not enough information is given.
E) None of these answers is correct.
, the macroeconomy is:A) in a recession.
B) in an expansionary gap.
C) at its potential level of output.
D) Not enough information is given.
E) None of these answers is correct.
Question
Refer to the following figure when answering the following questions.
Figure 9.4: Phillips Curve
Consider the Phillips curve at in Figure 9.4. The economy is:
A)booming.
B)inflationary.
C)in recessionary gap.
D)at potential output.
E)Not enough information is given to determine.
Figure 9.4: Phillips Curve
Consider the Phillips curve at
in Figure 9.4. The economy is:A)booming.
B)inflationary.
C)in recessionary gap.
D)at potential output.
E)Not enough information is given to determine.
Question
Refer to the following figure to answer the following questions.
Figure 9.3: Percent Change in U.S. Employment: 1980-2015
-Based on the data presented in Figure 9.3, which of the following periods is/are likely (a) recession(s)?
A) 1984, 1988, and 2006
B) 1988 and 2014
C) 1983, 1990, and 2001
D) 2005
E) Not enough information is given.
Figure 9.3: Percent Change in U.S. Employment: 1980-2015
-Based on the data presented in Figure 9.3, which of the following periods is/are likely (a) recession(s)?
A) 1984, 1988, and 2006
B) 1988 and 2014
C) 1983, 1990, and 2001
D) 2005
E) Not enough information is given.
Question
If  , the macroeconomy is:
A) in an expansionary gap.
B) in a recessionary gap.
C) at its potential level of output.
D) Not enough information is given.
E) None of these answers is correct.
, the macroeconomy is:A) in an expansionary gap.
B) in a recessionary gap.
C) at its potential level of output.
D) Not enough information is given.
E) None of these answers is correct.
Question
Suppose an economy's natural rate of unemployment is 5 percent. If the unemployment rate is 3 percent, according to Okun's law,  is ________ percent.
A) 2
B) -4
C) 4
D) -2
E) Not enough information is given.
is ________ percent.A) 2
B) -4
C) 4
D) -2
E) Not enough information is given.
Question
Refer to the following figure when answering the following questions.
Figure 9.5: U.S. Inflation 1960-2015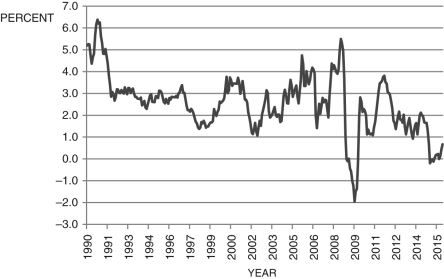 (Source: Bureau of Labor Statistics)
-Consider Figure 9.5, which shows the annual inflation rate. According to the Phillips curve, the period from about 2009 to 2010 was a period of:
A) a slumping economy.
B) a booming economy.
C) stagnation.
D) macroeconomic equilibrium.
E) Not enough information is given.
Figure 9.5: U.S. Inflation 1960-2015
(Source: Bureau of Labor Statistics)-Consider Figure 9.5, which shows the annual inflation rate. According to the Phillips curve, the period from about 2009 to 2010 was a period of:
A) a slumping economy.
B) a booming economy.
C) stagnation.
D) macroeconomic equilibrium.
E) Not enough information is given.
Question
Question
In the text, Okun's law is given as:
A) .
.
B)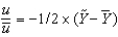 .
.
C) .
.
D) .
.
E)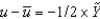 .
.
A)
.B)
.C)
.D)
.E)
. Question
Suppose an economy's natural rate of unemployment is 5 percent. If the unemployment rate is 7 percent, according to Okun's law,  is ________ percent.
A) 4
B) -4
C) 2
D) -2
E) Not enough information is given.
is ________ percent.A) 4
B) -4
C) 2
D) -2
E) Not enough information is given.
Question
Defining u as the unemployment rate and  as the natural rate of unemployment, Okun's law is given by the following equation:
A) .
.
B) .
.
C) .
.
D) .
.
E) .
.
as the natural rate of unemployment, Okun's law is given by the following equation:A)
.B)
.C)
.D)
.E)
. Question
Question
Refer to the following figure when answering the following questions.
Figure 9.5: U.S. Inflation 1960-2015 (Source: Bureau of Labor Statistics)
-Consider Figure 9.5, which shows the annual inflation rate. According to the Phillips curve, the period from about 2001 to 2002 was a period of:
A) a booming economy.
B) a slumping economy.
C) stagnation.
D) None of these answers is correct.
E) Not enough information is given.
Figure 9.5: U.S. Inflation 1960-2015
(Source: Bureau of Labor Statistics)-Consider Figure 9.5, which shows the annual inflation rate. According to the Phillips curve, the period from about 2001 to 2002 was a period of:
A) a booming economy.
B) a slumping economy.
C) stagnation.
D) None of these answers is correct.
E) Not enough information is given.
Question
Question
Question
Question
Question
Defining u as the unemployment rate and  as the natural rate of unemployment, we can write Okun's law as the following equation:
A) .
.
B) .
.
C) .
.
D) .
.
E) .
.
as the natural rate of unemployment, we can write Okun's law as the following equation:A)
.B)
.C)
.D)
.E)
. Question
Question
Refer to the following figure when answering the following questions.
Figure 9.5: U.S. Inflation 1960-2015 (Source: Bureau of Labor Statistics)
-Consider Figure 9.5, which shows the annual inflation rate. According to the Phillips curve, the period from about 1998 to 2000 was a period of:
A) stagnation.
B) a slumping economy.
C) a booming economy.
D) None of these answers is correct.
E) Not enough information is given.
Figure 9.5: U.S. Inflation 1960-2015
(Source: Bureau of Labor Statistics)-Consider Figure 9.5, which shows the annual inflation rate. According to the Phillips curve, the period from about 1998 to 2000 was a period of:
A) stagnation.
B) a slumping economy.
C) a booming economy.
D) None of these answers is correct.
E) Not enough information is given.
Question
Refer to the following figure when answering the following questions.
Figure 9.5: U.S. Inflation 1960-2015 (Source: Bureau of Labor Statistics)
-Consider Figure 9.5, which shows the annual inflation rate. According to the Phillips curve, the period from about 2003 to 2005 was a period of:
A) a slumping economy.
B) a booming economy.
C) stagnation.
D) None of these answers is correct.
E) Not enough information is given.
Figure 9.5: U.S. Inflation 1960-2015
(Source: Bureau of Labor Statistics)-Consider Figure 9.5, which shows the annual inflation rate. According to the Phillips curve, the period from about 2003 to 2005 was a period of:
A) a slumping economy.
B) a booming economy.
C) stagnation.
D) None of these answers is correct.
E) Not enough information is given.
Question
Question
Question
Question

Unlock Deck
Sign up to unlock the cards in this deck!
Unlock Deck
Unlock Deck
1/113
Play
Full screen (f)
Deck 9: An Introduction to the Short Run
1
New technology, oil price changes, pork-barrel spending, interest rate changes, changes in planned investment, and disasters are examples of:
A) long-term economic shocks.
B) short-term economic shocks.
C) political unrest.
D) monetary policy.
E) fiscal policy.
A) long-term economic shocks.
B) short-term economic shocks.
C) political unrest.
D) monetary policy.
E) fiscal policy.
short-term economic shocks.
2
Which of the following is NOT an example of a short-term macroeconomic shock?
A) a drought
B) planned investment expenditures
C) increased military spending
D) a change in the tax code
E) political unrest
A) a drought
B) planned investment expenditures
C) increased military spending
D) a change in the tax code
E) political unrest
planned investment expenditures
3
Which of the following is NOT an example of a short-term macroeconomic shock?
A) planned investment expenditures
B) a hurricane
C) increased military spending
D) a change in the tax code
E) new technology
A) planned investment expenditures
B) a hurricane
C) increased military spending
D) a change in the tax code
E) new technology
planned investment expenditures
4
Which of the following is NOT an example of a short-term macroeconomic shock?
A) political unrest
B) a change in the tax code
C) a drought
D) increased military spending
E) None of these answers is correct.
A) political unrest
B) a change in the tax code
C) a drought
D) increased military spending
E) None of these answers is correct.
Unlock Deck
Unlock for access to all 113 flashcards in this deck.
Unlock Deck
k this deck
5
Which of the following is NOT an example of a short-term macroeconomic shock?
A) increased oil prices
B) a drought
C) increased military spending
D) a change in the tax code
E) None of these answers is correct.
A) increased oil prices
B) a drought
C) increased military spending
D) a change in the tax code
E) None of these answers is correct.
Unlock Deck
Unlock for access to all 113 flashcards in this deck.
Unlock Deck
k this deck
6
The long-run model determines ________ output and ________.
A) current; unemployment
B) potential; unemployment
C) current; long-run inflation
D) potential; potential inflation
E) potential; long-run inflation
A) current; unemployment
B) potential; unemployment
C) current; long-run inflation
D) potential; potential inflation
E) potential; long-run inflation
Unlock Deck
Unlock for access to all 113 flashcards in this deck.
Unlock Deck
k this deck
7
Potential output is defined as:
A) the amount of total output if all inputs were utilized at their long-run, sustainable levels.
B) what an economy produces when it is at capacity.
C) the current level of output.
D) the amount of output where inflation is zero.
E) the level of output when unemployment is 10 percent.
A) the amount of total output if all inputs were utilized at their long-run, sustainable levels.
B) what an economy produces when it is at capacity.
C) the current level of output.
D) the amount of output where inflation is zero.
E) the level of output when unemployment is 10 percent.
Unlock Deck
Unlock for access to all 113 flashcards in this deck.
Unlock Deck
k this deck
8
Taxes, oil price changes, government spending, interest rate changes, new technologies, and disasters are examples of:
A) long-term economic shocks.
B) short-term economic shocks.
C) political unrest.
D) monetary policy.
E) fiscal policy.
A) long-term economic shocks.
B) short-term economic shocks.
C) political unrest.
D) monetary policy.
E) fiscal policy.
Unlock Deck
Unlock for access to all 113 flashcards in this deck.
Unlock Deck
k this deck
9
What is the best definition of the short term in the short-term model?
A) about two years
B) the amount of time the economy spends at its potential output
C) the length of time for short-term deviations to return to their long-run values
D) the length of a recession
E) There is no such thing as the short term.
A) about two years
B) the amount of time the economy spends at its potential output
C) the length of time for short-term deviations to return to their long-run values
D) the length of a recession
E) There is no such thing as the short term.
Unlock Deck
Unlock for access to all 113 flashcards in this deck.
Unlock Deck
k this deck
10
One implication of the Keynes quote, "In the long run we are all dead," is that:
A) the economy is always in its long-run equilibrium.
B) we know with certainty what the long run is.
C) the long run is made up of a sequence of short runs.
D) there is no difference between the long and short runs.
E) there is no short run.
A) the economy is always in its long-run equilibrium.
B) we know with certainty what the long run is.
C) the long run is made up of a sequence of short runs.
D) there is no difference between the long and short runs.
E) there is no short run.
Unlock Deck
Unlock for access to all 113 flashcards in this deck.
Unlock Deck
k this deck
11
Which of the following is NOT an example of a short-term macroeconomic shock?
A) a drought
B) high unemployment
C) increased military spending
D) a change in the tax code
E) political unrest
A) a drought
B) high unemployment
C) increased military spending
D) a change in the tax code
E) political unrest
Unlock Deck
Unlock for access to all 113 flashcards in this deck.
Unlock Deck
k this deck
12
John Maynard Keynes is famous for saying, "In the long run ________."
A) there is no tomorrow
B) we are all dead
C) the only thing we have to fear is fear itself
D) the study of economics will be redundant
E) we will tear down this wall
A) there is no tomorrow
B) we are all dead
C) the only thing we have to fear is fear itself
D) the study of economics will be redundant
E) we will tear down this wall
Unlock Deck
Unlock for access to all 113 flashcards in this deck.
Unlock Deck
k this deck
13
Defining as current output,
As potential output, and
As short-run output, which of the following equations defines short-run output as the short-run fluctuation's share of potential GDP?
A)
B)
C)
D)
E)
as current output, As potential output, and
As short-run output, which of the following equations defines short-run output as the short-run fluctuation's share of potential GDP?
A)
B)
C)
D)
E)
Unlock Deck
Unlock for access to all 113 flashcards in this deck.
Unlock Deck
k this deck
14
Defining as current output,
As potential output, and
As short-run fluctuations, which of the following equations is correct?
A)
B)
C)
D)
E)
as current output, As potential output, and
As short-run fluctuations, which of the following equations is correct?
A)
B)
C)
D)
E)
Unlock Deck
Unlock for access to all 113 flashcards in this deck.
Unlock Deck
k this deck
15
Which of the following is NOT an example of a short-term macroeconomic shock?
A) a change in the tax code
B) pork-barrel spending
C) increased military spending
D) planned investment expenditures
E) political unrest
A) a change in the tax code
B) pork-barrel spending
C) increased military spending
D) planned investment expenditures
E) political unrest
Unlock Deck
Unlock for access to all 113 flashcards in this deck.
Unlock Deck
k this deck
16
Current output is defined as:
A) the amount of output when inflation is about 2 percent.
B) what an economy produces when it is at capacity.
C) the amount of total output at the current level of input utilization.
D) the amount of total output if all inputs are utilized at their long-run sustainable levels.
E) the amount of output where unemployment is zero.
Unlock Deck
Unlock for access to all 113 flashcards in this deck.
Unlock Deck
k this deck
17
Output fluctuations are defined as:
A) the amount of output where inflation is about 2 percent.
B) what an economy produces when it is at capacity.
C) the percentage difference between current output and potential output.
D) the amount of total output if all inputs were utilized at their long-run sustainable levels.
E) the amount of output where unemployment is zero.
Unlock Deck
Unlock for access to all 113 flashcards in this deck.
Unlock Deck
k this deck
18
The long-run model determines ________ output and ________, while the short-run model determines ________ and ________ inflation.
A) potential; long-run inflation; current output; current
B) potential; unemployment; current output; long-run
C) current; long-run inflation; unemployment; current
D) potential; unemployment; unemployment; current
E) current; unemployment; potential output; current
A) potential; long-run inflation; current output; current
B) potential; unemployment; current output; long-run
C) current; long-run inflation; unemployment; current
D) potential; unemployment; unemployment; current
E) current; unemployment; potential output; current
Unlock Deck
Unlock for access to all 113 flashcards in this deck.
Unlock Deck
k this deck
19
Defining as current output,
As potential output, and
As short-run fluctuations, which of the following equations is correct?
A)
B)
C)
D)
E)
as current output, As potential output, and
As short-run fluctuations, which of the following equations is correct?
A)
B)
C)
D)
E)
Unlock Deck
Unlock for access to all 113 flashcards in this deck.
Unlock Deck
k this deck
20
The short-run model determines ________ and ________.
A) current output; current inflation
B) current output; long-run inflation
C) unemployment; current inflation
D) unemployment; potential output
E) potential output; unemployment
A) current output; current inflation
B) current output; long-run inflation
C) unemployment; current inflation
D) unemployment; potential output
E) potential output; unemployment
Unlock Deck
Unlock for access to all 113 flashcards in this deck.
Unlock Deck
k this deck
21
According to the data presented in the text, the largest negative output gap since 1970 was ________ percent, which occurred during the ________ recession.
A) about -3.5; 1980
B) -5; 1973-1975
C) about -8; 1981-1982
D) more than -7; 2007-2009
E) -5; 2001
A) about -3.5; 1980
B) -5; 1973-1975
C) about -8; 1981-1982
D) more than -7; 2007-2009
E) -5; 2001
Unlock Deck
Unlock for access to all 113 flashcards in this deck.
Unlock Deck
k this deck
22
Refer to the following figure when answering the following questions.
Figure 9.2: U.S. Output Fluctuations 1960-2015
-Consider Figure 9.2. The line represents short-run fluctuations, . Since 1960, the largest economic "boom" was in about ________ and the deepest recession was in about ________.
A) 1983; 1965
B) 1974; 1976
C) 2000; 1983
D) 1966; 1983
E) The economy always produces at its potential.
Figure 9.2: U.S. Output Fluctuations 1960-2015
-Consider Figure 9.2. The line represents short-run fluctuations,
. Since 1960, the largest economic "boom" was in about ________ and the deepest recession was in about ________.A) 1983; 1965
B) 1974; 1976
C) 2000; 1983
D) 1966; 1983
E) The economy always produces at its potential.
Unlock Deck
Unlock for access to all 113 flashcards in this deck.
Unlock Deck
k this deck
23
Which is responsible for dating business cycles?
A) Business Cycle Committee of the National Bureau of Economic Research
B) Business Cycle Committee of the Department of Treasury
C) Department of Treasury
D) Commerce Department
E) Board of Governors of the Federal Reserve System
A) Business Cycle Committee of the National Bureau of Economic Research
B) Business Cycle Committee of the Department of Treasury
C) Department of Treasury
D) Commerce Department
E) Board of Governors of the Federal Reserve System
Unlock Deck
Unlock for access to all 113 flashcards in this deck.
Unlock Deck
k this deck
24
According to the text, which of the following can be used to characterize potential output?
i. Assume a perfectly smooth trend is passing through the quarter-to-quarter movements in the real GDP.
ii. Take averages of the surrounding actual GDP numbers.
iii. Gather current data from statistical agencies, such as the Bureau of Economic Analysis.
A) i only
B) ii only
C) ii and iii
D) i and ii
E) iii only
Unlock Deck
Unlock for access to all 113 flashcards in this deck.
Unlock Deck
k this deck
25
Since 1950, economic fluctuations in the United States (i.e., the output gap) have generally been in the ________ percent to ________ percent range.
A) -4; 4
B)-5; 1
C) -8; 8
D) -2; 2
E) -3; 0
A) -4; 4
B)-5; 1
C) -8; 8
D) -2; 2
E) -3; 0
Unlock Deck
Unlock for access to all 113 flashcards in this deck.
Unlock Deck
k this deck
26
Suppose an economy exhibits a large unexpected increase in productivity growth that lasts for a decade; however, monetary policymakers are slow to recognize that the change is to potential-not current-output, and they interpret the increase in output as a boom that leads current to exceed potential output. In this scenario, policymakers believe that ________ pressures are building and incorrectly respond by ________ interest rates, sending the economy into a(n) ________ gap.
A) inflationary; raising; recessionary
B) inflationary; reducing; recessionary
C) recessionary; raising; expansionary
D) recessionary; reducing; recessionary
E) Not enough information is given.
A) inflationary; raising; recessionary
B) inflationary; reducing; recessionary
C) recessionary; raising; expansionary
D) recessionary; reducing; recessionary
E) Not enough information is given.
Unlock Deck
Unlock for access to all 113 flashcards in this deck.
Unlock Deck
k this deck
27
If current output is billion and potential output
Billion, then the economy is in a ________ and
Is about ________ percent.
A) recessionary gap; -4.7
B) boom; 4.7
C) boom; -4.7
D) recessionary gap; -5
E) boom; 5
billion and potential output Billion, then the economy is in a ________ and
Is about ________ percent.
A) recessionary gap; -4.7
B) boom; 4.7
C) boom; -4.7
D) recessionary gap; -5
E) boom; 5
Unlock Deck
Unlock for access to all 113 flashcards in this deck.
Unlock Deck
k this deck
28
Suppose an economy exhibits a large unexpected decrease in productivity growth that lasts for a decade; however, monetary policymakers are slow to recognize that the change is to potential-not current-output, and they interpret the decrease in output as a recession that leads current to fall below potential output. In this scenario, policymakers believe that ________ pressures are building and incorrectly respond by ________ interest rates, sending the economy into a(n) ________ gap.
A) inflationary; raising; inflationary
B) inflationary; reducing; inflationary
C) inflationary; raising; recessionary
D) recessionary; reducing; inflationary
E) Not enough information is given.
A) inflationary; raising; inflationary
B) inflationary; reducing; inflationary
C) inflationary; raising; recessionary
D) recessionary; reducing; inflationary
E) Not enough information is given.
Unlock Deck
Unlock for access to all 113 flashcards in this deck.
Unlock Deck
k this deck
29
According to the Phillips curve, short-term changes in inflation are due to changes in:
A) interest rates.
B) unemployment.
C) short-term output fluctuations.
D) long-term inflation.
E) long-term output.
A) interest rates.
B) unemployment.
C) short-term output fluctuations.
D) long-term inflation.
E) long-term output.
Unlock Deck
Unlock for access to all 113 flashcards in this deck.
Unlock Deck
k this deck
30
Refer to the following figure when answering the following questions.
Figure 9.1: Output versus Time
Considering Figure 9.1:
A) area a is where current output is less than potential output, and area b is where current output is greater than potential output.
B) area a is where current output is greater than potential output, and area b is where current output is less than potential output.
C) point c is where economic fluctuations are zero, and at point b, the economy is in a boom.
D) at point c, current output equals the short-term fluctuations.
E) area a is where current output is greater than potential output, and at point c, the economy is in a boom.
Unlock Deck
Unlock for access to all 113 flashcards in this deck.
Unlock Deck
k this deck
31
Refer to the following figure when answering the following questions.
Figure 9.2: U.S. Output Fluctuations 1960-2015
-Consider Figure 9.2. In approximately what years did the U.S. economy experience its longest economic expansion?
A) 1964-1970
B) 1978-1980
C) 1996-2001
D) 1972-1974
E) This cannot be determined from the information given.
Figure 9.2: U.S. Output Fluctuations 1960-2015
-Consider Figure 9.2. In approximately what years did the U.S. economy experience its longest economic expansion?
A) 1964-1970
B) 1978-1980
C) 1996-2001
D) 1972-1974
E) This cannot be determined from the information given.
Unlock Deck
Unlock for access to all 113 flashcards in this deck.
Unlock Deck
k this deck
32
Which is responsible for dating business cycles?
A) Congressional Budget Office
B) Business Cycle Committee of the National Bureau of Economic Research
C) President's Council of Economic Advisors
D) New York City Federal Reserve Bank president
E) Board of Governors of the Federal Reserve System
A) Congressional Budget Office
B) Business Cycle Committee of the National Bureau of Economic Research
C) President's Council of Economic Advisors
D) New York City Federal Reserve Bank president
E) Board of Governors of the Federal Reserve System
Unlock Deck
Unlock for access to all 113 flashcards in this deck.
Unlock Deck
k this deck
33
According to the text, which of the following can be used to approximate potential output?
i. Assume a perfectly smooth trend is passing through the quarter-to-quarter movements in the real GDP.
ii. Survey leading economists.
iii. Gather current data from statistical agencies, such as the Bureau of Economic Analysis.
A) i only
B) ii only
C) ii and iii
D) i and ii
E) iii only
i. Assume a perfectly smooth trend is passing through the quarter-to-quarter movements in the real GDP.
ii. Survey leading economists.
iii. Gather current data from statistical agencies, such as the Bureau of Economic Analysis.
A) i only
B) ii only
C) ii and iii
D) i and ii
E) iii only
Unlock Deck
Unlock for access to all 113 flashcards in this deck.
Unlock Deck
k this deck
34
Defining as current output, and
As potential output, how can the equation
Be best defined?
A) the percentage deviation of current output from potential output
B) the difference between current output and potential output
C) the percentage deviation of potential output from current output
D) the deviation of current output from potential output
E) the difference between potential output and current output
as current output, and As potential output, how can the equation
Be best defined?
A) the percentage deviation of current output from potential output
B) the difference between current output and potential output
C) the percentage deviation of potential output from current output
D) the deviation of current output from potential output
E) the difference between potential output and current output
Unlock Deck
Unlock for access to all 113 flashcards in this deck.
Unlock Deck
k this deck
35
If current output is billion and potential output
Billion, then the economy is in a ________ and
Is about ________ percent.
A) boom;
B) recession;
C) recession;
D) boom; 6.7
E) None of these answers is correct.
billion and potential output Billion, then the economy is in a ________ and
Is about ________ percent.
A) boom;
B) recession;
C) recession;
D) boom; 6.7
E) None of these answers is correct.
Unlock Deck
Unlock for access to all 113 flashcards in this deck.
Unlock Deck
k this deck
36
Refer to the following figure when answering the following questions.
Figure 9.2: U.S. Output Fluctuations 1960-2015
-Consider Figure 9.2. In 1989, the U.S. economy experienced an economic ________, and current output was about ________ percent above potential output.
A) boom; 1
B) recession; 1
C) boom; 2
D) This cannot be determined from the information given.
E) None of these answers is correct.
Unlock Deck
Unlock for access to all 113 flashcards in this deck.
Unlock Deck
k this deck
37
According to the text, which of the following can be used to estimate potential output?
i. Get the data from the Census Bureau.
ii. Survey leading economists.
iii. Gather current data from statistical agencies, such as the Bureau of Economic Analysis.
A) i only
B) ii only
C) iii only
D) i and ii
E) None of these answers is correct.
i. Get the data from the Census Bureau.
ii. Survey leading economists.
iii. Gather current data from statistical agencies, such as the Bureau of Economic Analysis.
A) i only
B) ii only
C) iii only
D) i and ii
E) None of these answers is correct.
Unlock Deck
Unlock for access to all 113 flashcards in this deck.
Unlock Deck
k this deck
38
Since 1970, for the U.S. economy, the largest negative output gap occurred during the recession of ________; however, the largest percentage drop in employment was during the recession of ________.
A) 1981-1982; 1974
B) 2007-2009; 2001
C) 1973-1975; 2007-2009
D) 2001; 1979
E) 1990-1991; 2001
A) 1981-1982; 1974
B) 2007-2009; 2001
C) 1973-1975; 2007-2009
D) 2001; 1979
E) 1990-1991; 2001
Unlock Deck
Unlock for access to all 113 flashcards in this deck.
Unlock Deck
k this deck
39
Refer to the following figure when answering the following questions.
Figure 9.2: U.S. Output Fluctuations 1960-2015
-Consider Figure 9.2. In approximately which of the following years was current output equal to potential output?
A) 1966, 1974, 1979, 2000, and 2004
B) 1961, 1975, 1983, 2002, and 2009
C) 1963, 1970, 1974, 1985, 1998, 2001, and 2005
D) 1961, 1975, 1979, 2000, and 2008
E) 1966, 1974, 1983, 2002, and 2010
Unlock Deck
Unlock for access to all 113 flashcards in this deck.
Unlock Deck
k this deck
40
Refer to the following figure when answering the following questions.
Figure 9.2: U.S. Output Fluctuations 1960-2015
-Consider Figure 9.2. In approximately what years did the U.S. economy experience its longest economic downturn, using the text's definition of a recessionary gap?
A) 1990-1997
B) 1974-1978
C) 1980-1988
D) 1957-1963
E) 2008-2016
Figure 9.2: U.S. Output Fluctuations 1960-2015
-Consider Figure 9.2. In approximately what years did the U.S. economy experience its longest economic downturn, using the text's definition of a recessionary gap?
A) 1990-1997
B) 1974-1978
C) 1980-1988
D) 1957-1963
E) 2008-2016
Unlock Deck
Unlock for access to all 113 flashcards in this deck.
Unlock Deck
k this deck
41
The Phillips curve in the text shows the ________ relationship between ________ and ________.
A) positive; the change in inflation; short-term economic fluctuations
B) negative; the change in inflation; short-term economic fluctuations
C) positive; inflation; unemployment
D) negative; inflation; unemployment
E) negative; the change in inflation; unemployment
A) positive; the change in inflation; short-term economic fluctuations
B) negative; the change in inflation; short-term economic fluctuations
C) positive; inflation; unemployment
D) negative; inflation; unemployment
E) negative; the change in inflation; unemployment
Unlock Deck
Unlock for access to all 113 flashcards in this deck.
Unlock Deck
k this deck
42
Generally speaking, the rate of inflation ________ during a recession.
A) stays the same
B) falls
C) rises
D) falls, then rises
E) None of these answers is correct.
A) stays the same
B) falls
C) rises
D) falls, then rises
E) None of these answers is correct.
Unlock Deck
Unlock for access to all 113 flashcards in this deck.
Unlock Deck
k this deck
43
According to the Phillips curve presented in the text, a positive macroeconomic shock:
A) increases the rate of inflation.
B) decreases the rate of inflation.
C) has no effect on the rate of inflation.
D) has a negative effect on the unemployment rate.
E) has a positive effect on the unemployment rate.
A) increases the rate of inflation.
B) decreases the rate of inflation.
C) has no effect on the rate of inflation.
D) has a negative effect on the unemployment rate.
E) has a positive effect on the unemployment rate.
Unlock Deck
Unlock for access to all 113 flashcards in this deck.
Unlock Deck
k this deck
44
In 1979, the inflation rate reached about 14 percent. The Federal Reserve ________ interest rates, sending the economy into a(n) ________. When doing so, the Federal Reserve knew this would be the case because of ________.
A) raised; expansion; the Phillips curve
B) raised; recession; the Phillips curve
C) raised; recession; Okun's law
D) lowered; recession; the Phillips curve
E) lowered; expansion; the Phillips curve
A) raised; expansion; the Phillips curve
B) raised; recession; the Phillips curve
C) raised; recession; Okun's law
D) lowered; recession; the Phillips curve
E) lowered; expansion; the Phillips curve
Unlock Deck
Unlock for access to all 113 flashcards in this deck.
Unlock Deck
k this deck
45
Refer to the following figure when answering the following questions.
Figure 9.4: Phillips Curve
Consider the Phillips curve at in Figure 9.4. The economy is:
A)booming.
B)inflationary.
C)at its potential output.
D)in recession.
E)Not enough information is given to determine.
Figure 9.4: Phillips Curve
Consider the Phillips curve at
in Figure 9.4. The economy is:A)booming.
B)inflationary.
C)at its potential output.
D)in recession.
E)Not enough information is given to determine.
Unlock Deck
Unlock for access to all 113 flashcards in this deck.
Unlock Deck
k this deck
46
When the U.S. economy bottomed out during the Great Depression, the unemployment rate hit about ________ percent in ________.
A) 9; 1977
B) 10; 1929
C) 25; 1933
D) 10; 2010
E) 10.5; 1982
A) 9; 1977
B) 10; 1929
C) 25; 1933
D) 10; 2010
E) 10.5; 1982
Unlock Deck
Unlock for access to all 113 flashcards in this deck.
Unlock Deck
k this deck
47
If , the macroeconomy is:
A) at its potential level of output.
B) in a recessionary gap.
C) in an expansionary gap.
D) Not enough information is given.
E) None of these answers is correct.
, the macroeconomy is:A) at its potential level of output.
B) in a recessionary gap.
C) in an expansionary gap.
D) Not enough information is given.
E) None of these answers is correct.
Unlock Deck
Unlock for access to all 113 flashcards in this deck.
Unlock Deck
k this deck
48
The Phillips curve in the text shows the ________ relationship between ________ and ________.
A) positive; inflation; unemployment
B) positive; inflation; short-term economic fluctuations
C) positive; the change in inflation; short-term economic fluctuations
D) negative; inflation; unemployment
E) negative; the change in inflation; unemployment
A) positive; inflation; unemployment
B) positive; inflation; short-term economic fluctuations
C) positive; the change in inflation; short-term economic fluctuations
D) negative; inflation; unemployment
E) negative; the change in inflation; unemployment
Unlock Deck
Unlock for access to all 113 flashcards in this deck.
Unlock Deck
k this deck
49
The short-run model is built on which of the following?
i. The economy is constantly being hit by so-called shocks.
ii. Economic policy has no impact on output.
iii. There is trade-off between output and inflation.
A) i only
B) i and iii
C) ii and iii
D) ii only
E) i, ii, and iii
i. The economy is constantly being hit by so-called shocks.
ii. Economic policy has no impact on output.
iii. There is trade-off between output and inflation.
A) i only
B) i and iii
C) ii and iii
D) ii only
E) i, ii, and iii
Unlock Deck
Unlock for access to all 113 flashcards in this deck.
Unlock Deck
k this deck
50
If , the macroeconomy is:
A) in an expansionary gap.
B) at its potential level of output.
C) in a recessionary gap.
D) None of these answers is correct.
E) Not enough information is given.
, the macroeconomy is:A) in an expansionary gap.
B) at its potential level of output.
C) in a recessionary gap.
D) None of these answers is correct.
E) Not enough information is given.
Unlock Deck
Unlock for access to all 113 flashcards in this deck.
Unlock Deck
k this deck
51
Refer to the following figure to answer the following questions.
Figure 9.3: Percent Change in U.S. Employment: 1980-2015
-Based on the data presented in Figure 9.3, which of the following periods is/are likely (an) expansion(s)?
A) 1988, 2006, and 2014
B) 1988 and 2014
C) 1981, 1990, and 2001
D) 2002
E) Not enough information is given.
Figure 9.3: Percent Change in U.S. Employment: 1980-2015
-Based on the data presented in Figure 9.3, which of the following periods is/are likely (an) expansion(s)?
A) 1988, 2006, and 2014
B) 1988 and 2014
C) 1981, 1990, and 2001
D) 2002
E) Not enough information is given.
Unlock Deck
Unlock for access to all 113 flashcards in this deck.
Unlock Deck
k this deck
52
The Great Depression stimulated ________ to write ________, which is considered to be the birth of modern macroeconomics.
A) John Hicks; Value and Capital
B) Karl Marx; Das Kapital
C) David Ricardo; Principles of Political Economy and Taxation
D) Milton Friedman and Anna J. Schwartz; A Monetary History of the United States, 1867-1960
E) John Maynard Keyes; The General Theory of Employment, Interest, and Money
A) John Hicks; Value and Capital
B) Karl Marx; Das Kapital
C) David Ricardo; Principles of Political Economy and Taxation
D) Milton Friedman and Anna J. Schwartz; A Monetary History of the United States, 1867-1960
E) John Maynard Keyes; The General Theory of Employment, Interest, and Money
Unlock Deck
Unlock for access to all 113 flashcards in this deck.
Unlock Deck
k this deck
53
Refer to the following figure when answering the following questions.
Figure 9.4: Phillips Curve
Consider the Phillips curve at in Figure 9.4. Which of the following is true?
A)The economy is booming.
B)The economy is deflationary.
C)The economy is at potential output.
D)The economy is in recession.
E)Unemployment is above the natural level.
Figure 9.4: Phillips Curve
Consider the Phillips curve at
in Figure 9.4. Which of the following is true?A)The economy is booming.
B)The economy is deflationary.
C)The economy is at potential output.
D)The economy is in recession.
E)Unemployment is above the natural level.
Unlock Deck
Unlock for access to all 113 flashcards in this deck.
Unlock Deck
k this deck
54
If , the macroeconomy is:
A) in a recessionary gap.
B) in an expansionary gap.
C) at its potential level of output.
D) Not enough information is given.
E) None of these answers is correct.
, the macroeconomy is:A) in a recessionary gap.
B) in an expansionary gap.
C) at its potential level of output.
D) Not enough information is given.
E) None of these answers is correct.
Unlock Deck
Unlock for access to all 113 flashcards in this deck.
Unlock Deck
k this deck
55
If , the macroeconomy is:
A) in a recessionary gap.
B) in an expansionary gap.
C) at its potential level of output.
D) Not enough information is given.
E) None of these answers is correct.
, the macroeconomy is:A) in a recessionary gap.
B) in an expansionary gap.
C) at its potential level of output.
D) Not enough information is given.
E) None of these answers is correct.
Unlock Deck
Unlock for access to all 113 flashcards in this deck.
Unlock Deck
k this deck
56
According to the Phillips curve presented in the text, a negative macroeconomic shock:
A) increases the rate of inflation.
B) decreases the rate of inflation.
C) has no effect on the rate of inflation.
D) has a negative effect on the unemployment rate.
E) has a positive effect on the unemployment rate.
A) increases the rate of inflation.
B) decreases the rate of inflation.
C) has no effect on the rate of inflation.
D) has a negative effect on the unemployment rate.
E) has a positive effect on the unemployment rate.
Unlock Deck
Unlock for access to all 113 flashcards in this deck.
Unlock Deck
k this deck
57
If , the macroeconomy is:
A) in a recession.
B) in an expansionary gap.
C) at its potential level of output.
D) Not enough information is given.
E) None of these answers is correct.
, the macroeconomy is:A) in a recession.
B) in an expansionary gap.
C) at its potential level of output.
D) Not enough information is given.
E) None of these answers is correct.
Unlock Deck
Unlock for access to all 113 flashcards in this deck.
Unlock Deck
k this deck
58
Refer to the following figure when answering the following questions.
Figure 9.4: Phillips Curve
Consider the Phillips curve at in Figure 9.4. The economy is:
A)booming.
B)inflationary.
C)in recessionary gap.
D)at potential output.
E)Not enough information is given to determine.
Figure 9.4: Phillips Curve
Consider the Phillips curve at
in Figure 9.4. The economy is:A)booming.
B)inflationary.
C)in recessionary gap.
D)at potential output.
E)Not enough information is given to determine.
Unlock Deck
Unlock for access to all 113 flashcards in this deck.
Unlock Deck
k this deck
59
Refer to the following figure to answer the following questions.
Figure 9.3: Percent Change in U.S. Employment: 1980-2015
-Based on the data presented in Figure 9.3, which of the following periods is/are likely (a) recession(s)?
A) 1984, 1988, and 2006
B) 1988 and 2014
C) 1983, 1990, and 2001
D) 2005
E) Not enough information is given.
Figure 9.3: Percent Change in U.S. Employment: 1980-2015
-Based on the data presented in Figure 9.3, which of the following periods is/are likely (a) recession(s)?
A) 1984, 1988, and 2006
B) 1988 and 2014
C) 1983, 1990, and 2001
D) 2005
E) Not enough information is given.
Unlock Deck
Unlock for access to all 113 flashcards in this deck.
Unlock Deck
k this deck
60
If , the macroeconomy is:
A) in an expansionary gap.
B) in a recessionary gap.
C) at its potential level of output.
D) Not enough information is given.
E) None of these answers is correct.
, the macroeconomy is:A) in an expansionary gap.
B) in a recessionary gap.
C) at its potential level of output.
D) Not enough information is given.
E) None of these answers is correct.
Unlock Deck
Unlock for access to all 113 flashcards in this deck.
Unlock Deck
k this deck
61
Suppose an economy's natural rate of unemployment is 5 percent. If the unemployment rate is 3 percent, according to Okun's law, is ________ percent.
A) 2
B) -4
C) 4
D) -2
E) Not enough information is given.
is ________ percent.A) 2
B) -4
C) 4
D) -2
E) Not enough information is given.
Unlock Deck
Unlock for access to all 113 flashcards in this deck.
Unlock Deck
k this deck
62
Refer to the following figure when answering the following questions.
Figure 9.5: U.S. Inflation 1960-2015 (Source: Bureau of Labor Statistics)
-Consider Figure 9.5, which shows the annual inflation rate. According to the Phillips curve, the period from about 2009 to 2010 was a period of:
A) a slumping economy.
B) a booming economy.
C) stagnation.
D) macroeconomic equilibrium.
E) Not enough information is given.
Figure 9.5: U.S. Inflation 1960-2015
(Source: Bureau of Labor Statistics)-Consider Figure 9.5, which shows the annual inflation rate. According to the Phillips curve, the period from about 2009 to 2010 was a period of:
A) a slumping economy.
B) a booming economy.
C) stagnation.
D) macroeconomic equilibrium.
E) Not enough information is given.
Unlock Deck
Unlock for access to all 113 flashcards in this deck.
Unlock Deck
k this deck
63
In 1979, the inflation rate reached about 14 percent, due in part to ________. The Board of Governors of the Federal Reserve under ________ decided to ________ interest rates, sending the economy into a ________.
A) a fall in oil prices; Volcker; raise; recession
B) an increase in consumer spending; Volcker; lower; recession
C) an increase in oil prices; Volcker; raise; recession
D) an increase in oil prices; Volcker; lower; boom
E) a fall in oil prices; Greenspan; raise; recession
A) a fall in oil prices; Volcker; raise; recession
B) an increase in consumer spending; Volcker; lower; recession
C) an increase in oil prices; Volcker; raise; recession
D) an increase in oil prices; Volcker; lower; boom
E) a fall in oil prices; Greenspan; raise; recession
Unlock Deck
Unlock for access to all 113 flashcards in this deck.
Unlock Deck
k this deck
64
In the text, Okun's law is given as:
A) .
B) .
C) .
D) .
E) .
A)
.B)
.C)
.D)
.E)
. Unlock Deck
Unlock for access to all 113 flashcards in this deck.
Unlock Deck
k this deck
65
Suppose an economy's natural rate of unemployment is 5 percent. If the unemployment rate is 7 percent, according to Okun's law, is ________ percent.
A) 4
B) -4
C) 2
D) -2
E) Not enough information is given.
is ________ percent.A) 4
B) -4
C) 2
D) -2
E) Not enough information is given.
Unlock Deck
Unlock for access to all 113 flashcards in this deck.
Unlock Deck
k this deck
66
Defining u as the unemployment rate and as the natural rate of unemployment, Okun's law is given by the following equation:
A) .
B) .
C) .
D) .
E) .
as the natural rate of unemployment, Okun's law is given by the following equation:A)
.B)
.C)
.D)
.E)
. Unlock Deck
Unlock for access to all 113 flashcards in this deck.
Unlock Deck
k this deck
67
Consider two economies. Economy 1 has a steep Phillips curve and Economy 2 has a gently sloped Phillips curve. If each economy experiences an identical economic expansion, the change in ________ would increase less in Economy ________.
A) inflation; 2
B) unemployment; 1
C) unemployment; 2
D) interest rates; 1
E) Not enough information is given.
A) inflation; 2
B) unemployment; 1
C) unemployment; 2
D) interest rates; 1
E) Not enough information is given.
Unlock Deck
Unlock for access to all 113 flashcards in this deck.
Unlock Deck
k this deck
68
Refer to the following figure when answering the following questions.
Figure 9.5: U.S. Inflation 1960-2015 (Source: Bureau of Labor Statistics)
-Consider Figure 9.5, which shows the annual inflation rate. According to the Phillips curve, the period from about 2001 to 2002 was a period of:
A) a booming economy.
B) a slumping economy.
C) stagnation.
D) None of these answers is correct.
E) Not enough information is given.
Figure 9.5: U.S. Inflation 1960-2015
(Source: Bureau of Labor Statistics)-Consider Figure 9.5, which shows the annual inflation rate. According to the Phillips curve, the period from about 2001 to 2002 was a period of:
A) a booming economy.
B) a slumping economy.
C) stagnation.
D) None of these answers is correct.
E) Not enough information is given.
Unlock Deck
Unlock for access to all 113 flashcards in this deck.
Unlock Deck
k this deck
69
Yale professor Ray Fair uses ________ to predict ________.
A) macroeconomic variables; presidential elections
B) a policy rule; the federal funds rate
C) Okun's law; the output gap
D) an econometric model;recessions
E) a theoretical model; fiscal policy
A) macroeconomic variables; presidential elections
B) a policy rule; the federal funds rate
C) Okun's law; the output gap
D) an econometric model;recessions
E) a theoretical model; fiscal policy
Unlock Deck
Unlock for access to all 113 flashcards in this deck.
Unlock Deck
k this deck
70
According to Okun's law, if the Federal Reserve wants to increase unemployment, it should ________ interest rates, which would ________ output.
A) increase; increase
B) increase; reduce
C) reduce; reduce
D) reduce; not change
E) not change; increase
A) increase; increase
B) increase; reduce
C) reduce; reduce
D) reduce; not change
E) not change; increase
Unlock Deck
Unlock for access to all 113 flashcards in this deck.
Unlock Deck
k this deck
71
According to the text, the slope of the Phillips curve in the United States is about ________. Thus, if the change in inflation is 3 percent, the gap would be ________ percent.
A) 1/4; 0.25
B) 1/3; 3
C) 1/2; 2
D) 2; 0.5
E) 1/3; 1
A) 1/4; 0.25
B) 1/3; 3
C) 1/2; 2
D) 2; 0.5
E) 1/3; 1
Unlock Deck
Unlock for access to all 113 flashcards in this deck.
Unlock Deck
k this deck
72
Taken together, the Phillips curve and Okun's law imply there is a short-term ________ relationship between ________ and inflation.
A) positive; interest rates
B) positive; unemployment
C) negative; interest rates
D) negative; unemployment
E) Not enough information is given.
A) positive; interest rates
B) positive; unemployment
C) negative; interest rates
D) negative; unemployment
E) Not enough information is given.
Unlock Deck
Unlock for access to all 113 flashcards in this deck.
Unlock Deck
k this deck
73
Defining u as the unemployment rate and as the natural rate of unemployment, we can write Okun's law as the following equation:
A) .
B) .
C) .
D) .
E) .
as the natural rate of unemployment, we can write Okun's law as the following equation:A)
.B)
.C)
.D)
.E)
. Unlock Deck
Unlock for access to all 113 flashcards in this deck.
Unlock Deck
k this deck
74
According to Okun's law, if the Federal Reserve wants to reduce unemployment, it should ________ interest rates, which would ________ output.
A) reduce; reduce
B) increase; increase
C) reduce; increase
D) reduce; not change
E) not change; increase
A) reduce; reduce
B) increase; increase
C) reduce; increase
D) reduce; not change
E) not change; increase
Unlock Deck
Unlock for access to all 113 flashcards in this deck.
Unlock Deck
k this deck
75
Refer to the following figure when answering the following questions.
Figure 9.5: U.S. Inflation 1960-2015 (Source: Bureau of Labor Statistics)
-Consider Figure 9.5, which shows the annual inflation rate. According to the Phillips curve, the period from about 1998 to 2000 was a period of:
A) stagnation.
B) a slumping economy.
C) a booming economy.
D) None of these answers is correct.
E) Not enough information is given.
Figure 9.5: U.S. Inflation 1960-2015
(Source: Bureau of Labor Statistics)-Consider Figure 9.5, which shows the annual inflation rate. According to the Phillips curve, the period from about 1998 to 2000 was a period of:
A) stagnation.
B) a slumping economy.
C) a booming economy.
D) None of these answers is correct.
E) Not enough information is given.
Unlock Deck
Unlock for access to all 113 flashcards in this deck.
Unlock Deck
k this deck
76
Refer to the following figure when answering the following questions.
Figure 9.5: U.S. Inflation 1960-2015 (Source: Bureau of Labor Statistics)
-Consider Figure 9.5, which shows the annual inflation rate. According to the Phillips curve, the period from about 2003 to 2005 was a period of:
A) a slumping economy.
B) a booming economy.
C) stagnation.
D) None of these answers is correct.
E) Not enough information is given.
Figure 9.5: U.S. Inflation 1960-2015
(Source: Bureau of Labor Statistics)-Consider Figure 9.5, which shows the annual inflation rate. According to the Phillips curve, the period from about 2003 to 2005 was a period of:
A) a slumping economy.
B) a booming economy.
C) stagnation.
D) None of these answers is correct.
E) Not enough information is given.
Unlock Deck
Unlock for access to all 113 flashcards in this deck.
Unlock Deck
k this deck
77
Okun's law shows the ________ relationship between ________ and ________.
A) negative; the unemployment gap; economic fluctuations
B) positive; the unemployment gap; economic fluctuations
C) negative; the unemployment gap; inflation
D) positive; the unemployment gap; inflation
E) negative; inflation; economic fluctuations
A) negative; the unemployment gap; economic fluctuations
B) positive; the unemployment gap; economic fluctuations
C) negative; the unemployment gap; inflation
D) positive; the unemployment gap; inflation
E) negative; inflation; economic fluctuations
Unlock Deck
Unlock for access to all 113 flashcards in this deck.
Unlock Deck
k this deck
78
If an economy has a horizontal Phillips curve and experiences an expansion, inflation:
A) falls.
B) rises sharply.
C) rises, but not very much.
D) does not change.
E) falls sharply.
A) falls.
B) rises sharply.
C) rises, but not very much.
D) does not change.
E) falls sharply.
Unlock Deck
Unlock for access to all 113 flashcards in this deck.
Unlock Deck
k this deck
79
According to the text, the slope of the Phillips curve in the United States is about ________. Thus, if the gap is 6 percent, the change in inflation would be ________ percent.
A) 1/4; 1.5
B) 1/3; 12
C) 1/3; 2
D) 1/2; 3
E) 1/2; 12
A) 1/4; 1.5
B) 1/3; 12
C) 1/3; 2
D) 1/2; 3
E) 1/2; 12
Unlock Deck
Unlock for access to all 113 flashcards in this deck.
Unlock Deck
k this deck
80
Taken together, the Phillips curve and Okun's law imply there is a ________ relationship between ________ and unemployment.
A) positive; inflation
B) negative; inflation
C) negative; interest rates
D) positive; interest rates
E) Not enough information is given.
A) positive; inflation
B) negative; inflation
C) negative; interest rates
D) positive; interest rates
E) Not enough information is given.
Unlock Deck
Unlock for access to all 113 flashcards in this deck.
Unlock Deck
k this deck
Unlock Deck
Unlock for access to all 113 flashcards in this deck.


