Deck 46: Population Ecology
Full screen (f)
Question
Question
Question
The figures below represent three hypothetical populations; each circle is an individual. 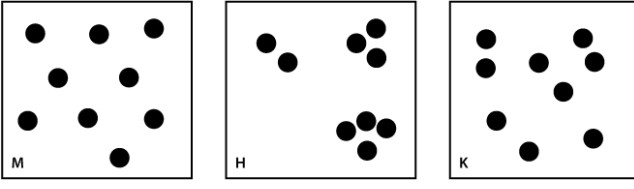 Select the pattern above that describes the following scenario: This is a social species.
A)diagram M
B)diagram H
C)diagram K
Select the pattern above that describes the following scenario: This is a social species.A)diagram M
B)diagram H
C)diagram K
Question
Question
Question
Question
Question
The figures below represent three hypothetical populations; each circle is an individual. 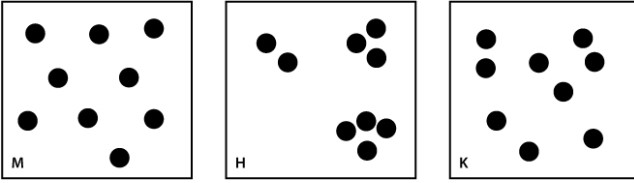 Select the pattern above that describes the following scenario: Individuals establish exclusive territories to secure access to resources.
A)diagram M
B)diagram H
C)diagram K
Select the pattern above that describes the following scenario: Individuals establish exclusive territories to secure access to resources.A)diagram M
B)diagram H
C)diagram K
Question
Question
The figures below represent three hypothetical populations; each circle is an individual. 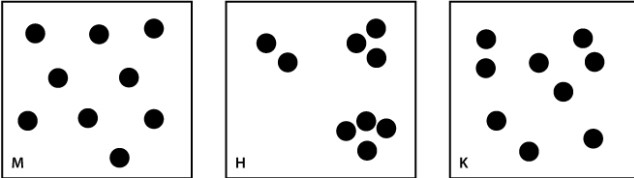 Select the pattern above that describes the following scenario: Food is most abundant near waterholes in the desert.
A)diagram M
B)diagram H
C)diagram K
Select the pattern above that describes the following scenario: Food is most abundant near waterholes in the desert.A)diagram M
B)diagram H
C)diagram K
Question
Question
The figures below represent three hypothetical populations; each circle is an individual. 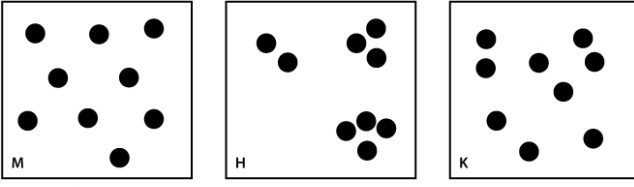 Select the pattern above that describes the following scenario: Individuals are distributed randomly within the environment.
A)diagram M
B)diagram H
C)diagram K
Select the pattern above that describes the following scenario: Individuals are distributed randomly within the environment.A)diagram M
B)diagram H
C)diagram K
Question
Question
Question
Question
Question
Question
Question
Question
Question
Question
Question
Question
Consider a population undergoing logistic growth. 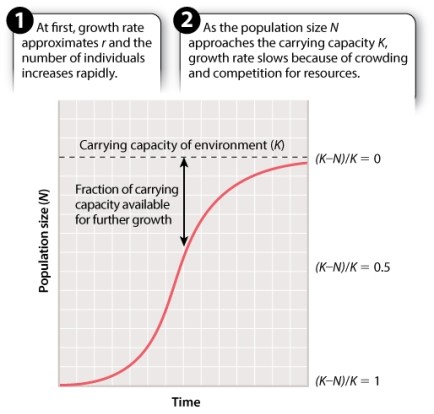 When are the most individuals added to the population per unit time?
A)(K-N)/K = 1
B)(K-N)/K = 0.75
C)(K-N)/K = 0.5
D)(K-N)/K = 0.25
E)(K-N)/K = 0
When are the most individuals added to the population per unit time?A)(K-N)/K = 1
B)(K-N)/K = 0.75
C)(K-N)/K = 0.5
D)(K-N)/K = 0.25
E)(K-N)/K = 0
Question
Question
Question
The growth curve below shows the growth projections for a single population. What would happen if the birth rate were to decline? 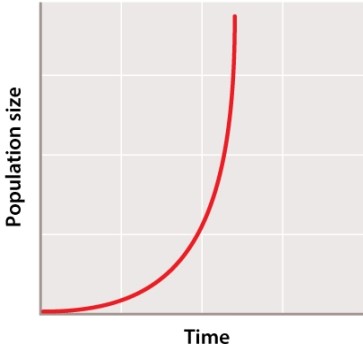
A)The graph would shift to the right.
B)The graph would shift to the left.
C)The graph would stay the same.
A)The graph would shift to the right.
B)The graph would shift to the left.
C)The graph would stay the same.
Question
Question
Question
Question
Question
Question
Consider a population undergoing logistic growth. 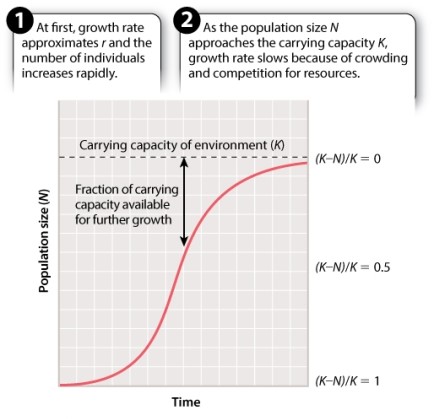 When (K - N)/K = 0, what does that imply about the birth rate (b) and death rate (d)?
A)b > d
B)b < d
C)b = d
D)It is not possible to make an inference about b and d from this information.
When (K - N)/K = 0, what does that imply about the birth rate (b) and death rate (d)?A)b > d
B)b < d
C)b = d
D)It is not possible to make an inference about b and d from this information.
Question
Question
Question
Question
Question
Question
Question
Question
Question
Question
Question
Question
Question
Question
Question
Question
Question
Question
Question
Question
Question
Question
Question
Question
Question
Question
Question
Question
Question
Question
Question
Question
Question
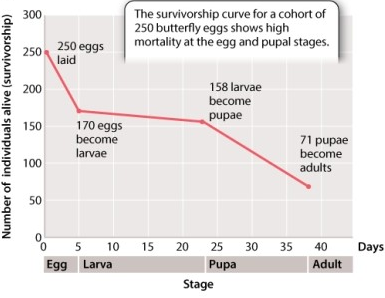
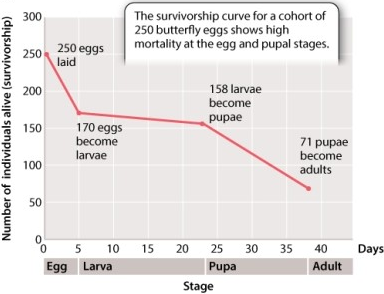
Consider the data in Figure 46.11 illustrating the survivorship curve of the lime swallowtail butterfly. As indicated in your text, the survivorship from the egg to larval stage is 68%. Calculate the survivorship from the larval to pupal stage. a.
b.

A)93% (0.93)
B)68% (0.68)
C)45% (0.45)
D)40% (0.40)
b.
A)93% (0.93)
B)68% (0.68)
C)45% (0.45)
D)40% (0.40)
Question
In the logistic growth curve depicted in Figure 46.6, as time goes on, what value would you expect N to approach? 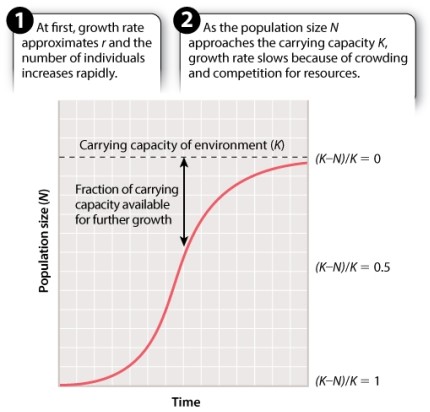
A)r
B)K
C)S
D)t
E) N
A)r
B)K
C)S
D)t
E) N
Question
Question
Question
Question
Question
The figure below illustrates a life-history trade-off between survivorship and reproduction in red deer from the Isle of Rhum in northern Scotland. 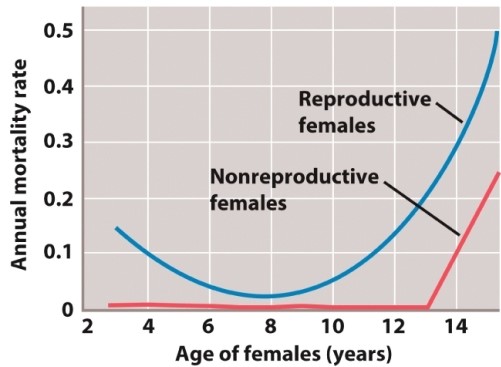 At what age is this trade-off minimized (i.e., at what age is the cost of reproduction LOWEST)?
A)4 years
B)6 years
C)8 years
D)10 years
At what age is this trade-off minimized (i.e., at what age is the cost of reproduction LOWEST)?A)4 years
B)6 years
C)8 years
D)10 years
Question
Question
Question
Consider the data in Figure 46.11 illustrating the survivorship curve of the lime swallowtail butterfly. As indicated in your text, the survivorship from the egg to larval stage is 68%. Calculate the survivorship from the egg to adult stage. a.
b.
A)93% (0.93)
B)63% (0.63)
C)35% (0.35)
D)28% (0.28)
b.
A)93% (0.93)
B)63% (0.63)
C)35% (0.35)
D)28% (0.28)
Question
Question
The following age pyramid was determined from a population. 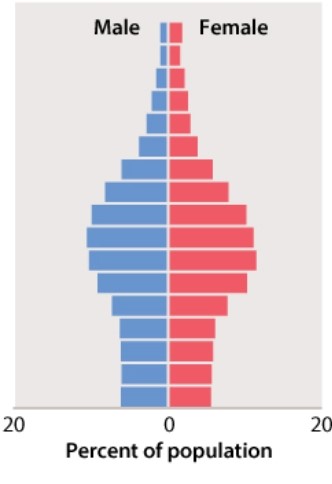 What can be stated about the population?
A)This population is experiencing population growth.
B)This population is experiencing population decline.
C)This population is experiencing population stability.
What can be stated about the population?A)This population is experiencing population growth.
B)This population is experiencing population decline.
C)This population is experiencing population stability.
Question
Consider the data in Figure 46.8 illustrating the age structure of France and India. 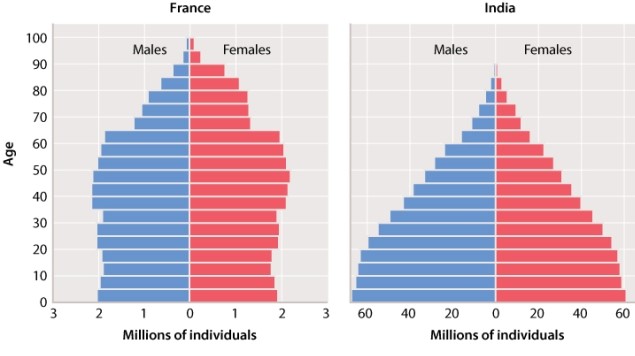 In many parts of the world, the average age of reproductive maturity is increasing as humans move from urban to rural environments. Suppose that the current average age of first reproduction is 15 years old in India and 20 years old in France. How would a 5-year increase in the average age of reproductive maturity in both countries be expected to affect the per capita birth rate, and would this effect be greater in France or in India?
A)increase in per capita birth rate, greater effect in India
B)increase in per capita birth rate, greater effect in France
C)decrease in per capita birth rate, greater effect in India
D)decrease in per capita birth rate, greater effect in France
In many parts of the world, the average age of reproductive maturity is increasing as humans move from urban to rural environments. Suppose that the current average age of first reproduction is 15 years old in India and 20 years old in France. How would a 5-year increase in the average age of reproductive maturity in both countries be expected to affect the per capita birth rate, and would this effect be greater in France or in India?A)increase in per capita birth rate, greater effect in India
B)increase in per capita birth rate, greater effect in France
C)decrease in per capita birth rate, greater effect in India
D)decrease in per capita birth rate, greater effect in France
Question
Consider the data in Figure 46.11 illustrating the survivorship curve of the lime swallowtail butterfly. As indicated in your text, the survivorship from the egg to larval stage is 68%. Calculate the survivorship from the egg to pupal stage. a.
b.
A)93% (0.93)
B)68% (0.68)
C)63% (0.63)
D)45% (0.45)
b.
A)93% (0.93)
B)68% (0.68)
C)63% (0.63)
D)45% (0.45)
Question

Unlock Deck
Sign up to unlock the cards in this deck!
Unlock Deck
Unlock Deck
1/132
Play
Full screen (f)
Deck 46: Population Ecology
1
In 1987, 18 black-footed ferrets, the last known individuals of this species, were captured and brought into a captive breeding program in Wyoming. In 1989, the total ferret population, still in captivity, was 120 animals. These 120 animals in 1989 represented:
A)N, the total population size.
B) N, the change in population size from 1987 to 1989.
C) N/ t, the rate of change in population size.
D)r, the per capita change in population size.
E)r, the exponential rate of growth of the population.
A)N, the total population size.
B) N, the change in population size from 1987 to 1989.
C) N/ t, the rate of change in population size.
D)r, the per capita change in population size.
E)r, the exponential rate of growth of the population.
N, the total population size.
2
A scientist is researching a population of blue jays in her city. In order to completely define this blue jay population, she must determine:
A)the size, range, and density of the blue jay population.
B)the predators and parasites of the blue jay population.
C)the climates in which the blue jays can survive.
D)whether the blue jays are r- or K-strategists.
E)the typical life history for an individual blue jay.
A)the size, range, and density of the blue jay population.
B)the predators and parasites of the blue jay population.
C)the climates in which the blue jays can survive.
D)whether the blue jays are r- or K-strategists.
E)the typical life history for an individual blue jay.
A
3
The figures below represent three hypothetical populations; each circle is an individual. Select the pattern above that describes the following scenario: This is a social species.
A)diagram M
B)diagram H
C)diagram K
Select the pattern above that describes the following scenario: This is a social species.A)diagram M
B)diagram H
C)diagram K
B
4
A researcher hopes to estimate the size of an E. coli population in a liter of seawater. To do this, he can count the number of E. coli bacteria in a milliliter of seawater and multiply this number by 1000.
Unlock Deck
Unlock for access to all 132 flashcards in this deck.
Unlock Deck
k this deck
5
Many species of fish are found in schools, large groups of conspecifics all swimming with one another. Which of the following terms best describes the distribution of schooling fish?
A)random
B)clumped
C)uniform
A)random
B)clumped
C)uniform
Unlock Deck
Unlock for access to all 132 flashcards in this deck.
Unlock Deck
k this deck
6
Which of the following statements is true regarding the mark-and-recapture method?
A)It assumes that the size of the population of interest remains constant between the initial mark and subsequent recapture measurements.
B)It can be represented by the equation: N = C/R × M.
C)It can rely on members of a species being identified by physical characteristics (i.e., fin markings on whales).
D)It is used to estimate the size of a population of interest.
E)All of these choices are correct.
Unlock Deck
Unlock for access to all 132 flashcards in this deck.
Unlock Deck
k this deck
7
Which of the following results from a mark-recapture study done on mice would reflect a larger population size?
A)When taking the second sample, 200 individuals are caught and 20 are marked from the first sample.
B)When taking the second sample, 200 individuals are caught and 80 are marked from the first sample.
C)Both of these scenarios would result in the same population estimate.
A)When taking the second sample, 200 individuals are caught and 20 are marked from the first sample.
B)When taking the second sample, 200 individuals are caught and 80 are marked from the first sample.
C)Both of these scenarios would result in the same population estimate.
Unlock Deck
Unlock for access to all 132 flashcards in this deck.
Unlock Deck
k this deck
8
The figures below represent three hypothetical populations; each circle is an individual. Select the pattern above that describes the following scenario: Individuals establish exclusive territories to secure access to resources.
A)diagram M
B)diagram H
C)diagram K
Select the pattern above that describes the following scenario: Individuals establish exclusive territories to secure access to resources.A)diagram M
B)diagram H
C)diagram K
Unlock Deck
Unlock for access to all 132 flashcards in this deck.
Unlock Deck
k this deck
9
Large, even distances typically separate individual panda bears from each other. What type of population distribution do pandas exhibit?
A)random distribution
B)logistic distribution
C)clustered distribution
D)uniform distribution
E)sinusoidal distribution
A)random distribution
B)logistic distribution
C)clustered distribution
D)uniform distribution
E)sinusoidal distribution
Unlock Deck
Unlock for access to all 132 flashcards in this deck.
Unlock Deck
k this deck
10
The figures below represent three hypothetical populations; each circle is an individual. Select the pattern above that describes the following scenario: Food is most abundant near waterholes in the desert.
A)diagram M
B)diagram H
C)diagram K
Select the pattern above that describes the following scenario: Food is most abundant near waterholes in the desert.A)diagram M
B)diagram H
C)diagram K
Unlock Deck
Unlock for access to all 132 flashcards in this deck.
Unlock Deck
k this deck
11
The _____ of box turtles in the United States includes all of the individual box turtles that could mate and reproduce within the 50 states.
A)density
B)growth rate
C)population
D)carrying capacity
A)density
B)growth rate
C)population
D)carrying capacity
Unlock Deck
Unlock for access to all 132 flashcards in this deck.
Unlock Deck
k this deck
12
The figures below represent three hypothetical populations; each circle is an individual. Select the pattern above that describes the following scenario: Individuals are distributed randomly within the environment.
A)diagram M
B)diagram H
C)diagram K
Select the pattern above that describes the following scenario: Individuals are distributed randomly within the environment.A)diagram M
B)diagram H
C)diagram K
Unlock Deck
Unlock for access to all 132 flashcards in this deck.
Unlock Deck
k this deck
13
Consider the example of the lime swallowtail, Papilio demoleus, which lives in citrus groves on the island of Hispaniola. Which type of spatial distribution would you expect for this species?
A)random
B)clustered (clumped)
C)uniform
A)random
B)clustered (clumped)
C)uniform
Unlock Deck
Unlock for access to all 132 flashcards in this deck.
Unlock Deck
k this deck
14
A _____ consists of all the individuals of a given species that live and reproduce in a particular place.
A)population
B)species
C)family
D)range
A)population
B)species
C)family
D)range
Unlock Deck
Unlock for access to all 132 flashcards in this deck.
Unlock Deck
k this deck
15
The coast redwood (Sequoia sempervirens) occurs naturally in a strip of habitat about 450 miles long and 5-35 miles wide, from southwest Oregon along the coast to just south of Monterey, California. What aspect of the population ecology of the coast redwood does this statement describe?
A)geographic range
B)population density
C)population size
D)distribution
A)geographic range
B)population density
C)population size
D)distribution
Unlock Deck
Unlock for access to all 132 flashcards in this deck.
Unlock Deck
k this deck
16
A group of field biologists goes out to mark beetles living in an area around a local pond in order to estimate population size. They capture 500 beetles on the first day. They return the following day and catch a total of 400 individuals, 200 of which are marked. What is the estimated population size for the beetles?
A)10,000
B)1000
C)500
D)250
A)10,000
B)1000
C)500
D)250
Unlock Deck
Unlock for access to all 132 flashcards in this deck.
Unlock Deck
k this deck
17
An individual E. coli bacterium, much like a population of E. coli, can evolve antibiotic resistance.
Unlock Deck
Unlock for access to all 132 flashcards in this deck.
Unlock Deck
k this deck
18
If an ecologist does a field count of the number of mice in a space that measures 6 hectares, the ecologist is calculating the population:
A)density.
B)size.
C)distribution.
D)cycle.
A)density.
B)size.
C)distribution.
D)cycle.
Unlock Deck
Unlock for access to all 132 flashcards in this deck.
Unlock Deck
k this deck
19
Prairie dogs are rodents that live in colonies. Black-tailed prairie dog (Cynomys ludovicianus) colonies typically have around 12 adult animals per hectare. What aspect of the population ecology of the black-tailed prairie dog does this statement describe?
A)population density
B)population size
C)population growth
D)life history
A)population density
B)population size
C)population growth
D)life history
Unlock Deck
Unlock for access to all 132 flashcards in this deck.
Unlock Deck
k this deck
20
If we want to know only whether or not a population is getting larger or smaller, what variables do we need to know?
A)births
B)deaths
C)immigration
D)emigration
A)births
B)deaths
C)immigration
D)emigration
Unlock Deck
Unlock for access to all 132 flashcards in this deck.
Unlock Deck
k this deck
21
To understand past and predict future changes in populations, ecologists use the following important factors:
A)the population's birth rate.
B)expected longevity of individuals in the population.
C)the proportion of individuals in the population able to reproduce.
D)the ratio of males to females.
A)the population's birth rate.
B)expected longevity of individuals in the population.
C)the proportion of individuals in the population able to reproduce.
D)the ratio of males to females.
Unlock Deck
Unlock for access to all 132 flashcards in this deck.
Unlock Deck
k this deck
22
The intrinsic growth rate is the maximum per capita growth rate, most readily achieved when no environmental factors limit population increase.
Unlock Deck
Unlock for access to all 132 flashcards in this deck.
Unlock Deck
k this deck
23
The equation below represents an alternate way to express the logistic growth equation, but it is equivalent to the equation from your text. What will occur in the population as the ratio N/K is increased? N/ t = rN (1 - N/K)
A)Population growth will increase.
B)Population growth will decrease.
C)The intrinsic rate of population growth will increase.
D)The intrinsic rate of population growth will decrease.
A)Population growth will increase.
B)Population growth will decrease.
C)The intrinsic rate of population growth will increase.
D)The intrinsic rate of population growth will decrease.
Unlock Deck
Unlock for access to all 132 flashcards in this deck.
Unlock Deck
k this deck
24
Consider a population undergoing logistic growth. When are the most individuals added to the population per unit time?
A)(K-N)/K = 1
B)(K-N)/K = 0.75
C)(K-N)/K = 0.5
D)(K-N)/K = 0.25
E)(K-N)/K = 0
When are the most individuals added to the population per unit time?A)(K-N)/K = 1
B)(K-N)/K = 0.75
C)(K-N)/K = 0.5
D)(K-N)/K = 0.25
E)(K-N)/K = 0
Unlock Deck
Unlock for access to all 132 flashcards in this deck.
Unlock Deck
k this deck
25
A marine ecologist counts the number of octopuses in three different intertidal regions that each measure 2 hectares. The octopus counts are 7, 2, and 6 respectively. What is the BEST estimate of population density for this particular species of octopus?
A)2
B)6
C)7
D)5
E)More sampling would have to be done until two areas have the same count.
A)2
B)6
C)7
D)5
E)More sampling would have to be done until two areas have the same count.
Unlock Deck
Unlock for access to all 132 flashcards in this deck.
Unlock Deck
k this deck
26
You are studying a population of beetles of size N = 3000. During a 1-month period, you record 400 births and 150 deaths. Considering the estimate of r from these data, project the population size in 6 months.
A)2)5 × 3000
B)4500
C)4945
D)2160
A)2)5 × 3000
B)4500
C)4945
D)2160
Unlock Deck
Unlock for access to all 132 flashcards in this deck.
Unlock Deck
k this deck
27
The growth curve below shows the growth projections for a single population. What would happen if the birth rate were to decline?
A)The graph would shift to the right.
B)The graph would shift to the left.
C)The graph would stay the same.
A)The graph would shift to the right.
B)The graph would shift to the left.
C)The graph would stay the same.
Unlock Deck
Unlock for access to all 132 flashcards in this deck.
Unlock Deck
k this deck
28
As populations approach carrying capacity, crowding can affect:
A)birth rates through resource limitation.
B)death rates through resource limitation.
C)death rates by increasing the transmission of pathogens and parasites.
D)birth and death rates through closer access to mates.
E)death rates due to climatic factors.
A)birth rates through resource limitation.
B)death rates through resource limitation.
C)death rates by increasing the transmission of pathogens and parasites.
D)birth and death rates through closer access to mates.
E)death rates due to climatic factors.
Unlock Deck
Unlock for access to all 132 flashcards in this deck.
Unlock Deck
k this deck
29
A population of 20 butterflies colonizes a new area with no predators and a number of flower species large enough to support a butterfly population of 200 individuals. In the first 2 years in the new area, the growth curve for this butterfly population will show:
A)logistic growth because they will reach maximum population size immediately after colonization.
B)logistic growth because there is a carrying capacity in the newly colonized area.
C)exponential growth because the colonizing population size is far below the carrying capacity.
D)exponential growth because only a few individuals will have offspring.
Unlock Deck
Unlock for access to all 132 flashcards in this deck.
Unlock Deck
k this deck
30
During exponential growth, the number of individuals added per unit time increases, while the _____ stays the same.
A)population size
B)carrying capacity
C)per capita growth rate
D)death rate
A)population size
B)carrying capacity
C)per capita growth rate
D)death rate
Unlock Deck
Unlock for access to all 132 flashcards in this deck.
Unlock Deck
k this deck
31
A researcher knows the geographic range of a population of butterflies. Given only this information, what else can she deduce about this butterfly population?
A)the size of the butterfly population
B)the density of the butterfly population
C)the parasites/predators that these butterflies may encounter
D)the age structure of the butterfly population
E)the intrinsic growth rate of the butterfly population
A)the size of the butterfly population
B)the density of the butterfly population
C)the parasites/predators that these butterflies may encounter
D)the age structure of the butterfly population
E)the intrinsic growth rate of the butterfly population
Unlock Deck
Unlock for access to all 132 flashcards in this deck.
Unlock Deck
k this deck
32
Which of the following is NOT one of the defining features of a population?
A)size
B)density
C)range
D)sex ratio
A)size
B)density
C)range
D)sex ratio
Unlock Deck
Unlock for access to all 132 flashcards in this deck.
Unlock Deck
k this deck
33
Consider a population undergoing logistic growth. When (K - N)/K = 0, what does that imply about the birth rate (b) and death rate (d)?
A)b > d
B)b < d
C)b = d
D)It is not possible to make an inference about b and d from this information.
When (K - N)/K = 0, what does that imply about the birth rate (b) and death rate (d)?A)b > d
B)b < d
C)b = d
D)It is not possible to make an inference about b and d from this information.
Unlock Deck
Unlock for access to all 132 flashcards in this deck.
Unlock Deck
k this deck
34
Population size can fluctuate with many different factors. Which of the following would NOT affect population size?
A)change in primary predators on the population
B)change in resource availability for the population
C)change in birthrate in the population
D)change in death rate in the population
E)All of the answer choices would affect population size.
A)change in primary predators on the population
B)change in resource availability for the population
C)change in birthrate in the population
D)change in death rate in the population
E)All of the answer choices would affect population size.
Unlock Deck
Unlock for access to all 132 flashcards in this deck.
Unlock Deck
k this deck
35
As a population approaches its carrying capacity, how does its growth change?
A)The growth rate slows until N is 0.
B)The growth rate slows until N is close to K.
C)The growth rate slows until N is close to r.
D)The growth rate stays the same.
E)r changes until it is close to K.
A)The growth rate slows until N is 0.
B)The growth rate slows until N is close to K.
C)The growth rate slows until N is close to r.
D)The growth rate stays the same.
E)r changes until it is close to K.
Unlock Deck
Unlock for access to all 132 flashcards in this deck.
Unlock Deck
k this deck
36
Population size can be influenced by:
A)births.
B)deaths.
C)immigration.
D)emigration.
A)births.
B)deaths.
C)immigration.
D)emigration.
Unlock Deck
Unlock for access to all 132 flashcards in this deck.
Unlock Deck
k this deck
37
_____ allows populations to adapt to the abiotic and biotic conditions where they live.
A)Natural selection
B)Competition
C)Reproduction
D)Predation
A)Natural selection
B)Competition
C)Reproduction
D)Predation
Unlock Deck
Unlock for access to all 132 flashcards in this deck.
Unlock Deck
k this deck
38
Certain soils in the Midwest have very even concentrations of minerals and nutrients that are required for the growth of a small shrub. How would you expect individuals in a population of this shrub to be distributed in the area?
A)random
B)clumped
C)uniform
A)random
B)clumped
C)uniform
Unlock Deck
Unlock for access to all 132 flashcards in this deck.
Unlock Deck
k this deck
39
In 1987, 18 black-footed ferrets, the last known individuals of this species, were captured and brought into a captive breeding program in Wyoming. In 1989, the total ferret population, still in captivity, was 120 animals. Given r = ( N/ t)/N1, and based on the numbers provided, the per capita growth rate from 1987 to 1989 was:
A)102.
B)60.
C)51.
D)25.5.
E)2)83.
A)102.
B)60.
C)51.
D)25.5.
E)2)83.
Unlock Deck
Unlock for access to all 132 flashcards in this deck.
Unlock Deck
k this deck
40
Examine the logistic growth equation, below: Nt = N1 + rN1(K-N1/K)
Which of the following will result in an increase in population size?
A)increasing the death rate
B)decreasing the birth rate
C)decreasing the carrying capacity
D)increasing the carrying capacity
Which of the following will result in an increase in population size?
A)increasing the death rate
B)decreasing the birth rate
C)decreasing the carrying capacity
D)increasing the carrying capacity
Unlock Deck
Unlock for access to all 132 flashcards in this deck.
Unlock Deck
k this deck
41
An environment can only support a certain number of individuals from a given species at any one time. This number is referred to as the _____ of that environment.
A)population size
B)carrying capacity
C)growth rate
D)population density
A)population size
B)carrying capacity
C)growth rate
D)population density
Unlock Deck
Unlock for access to all 132 flashcards in this deck.
Unlock Deck
k this deck
42
As a population approaches its carrying capacity, its growth rate:
A)increases.
B)decreases.
C)stays the same.
D)stops.
A)increases.
B)decreases.
C)stays the same.
D)stops.
Unlock Deck
Unlock for access to all 132 flashcards in this deck.
Unlock Deck
k this deck
43
The per capita growth rate (r) is synonymous with _____ growth rate.
A)Type I
B)Type III
C)logistic
D)intrinsic
E)extrinsic
A)Type I
B)Type III
C)logistic
D)intrinsic
E)extrinsic
Unlock Deck
Unlock for access to all 132 flashcards in this deck.
Unlock Deck
k this deck
44
When the number of young produced at birth exceeds the number of adults that can be supported by available resources, this leads to natural selection.
Unlock Deck
Unlock for access to all 132 flashcards in this deck.
Unlock Deck
k this deck
45
Most populations demonstrate _____ growth, in which the population size increases exponentially until it levels off near the K value of the habitat for that species.
A)exponential
B)intrinsic
C)logistic
D)extrinsic
E)logarithmic
A)exponential
B)intrinsic
C)logistic
D)extrinsic
E)logarithmic
Unlock Deck
Unlock for access to all 132 flashcards in this deck.
Unlock Deck
k this deck
46
What are some factors that keep a population under its carrying capacity?
A)predation
B)increased birth rate
C)decreased death rate
D)parasitism
A)predation
B)increased birth rate
C)decreased death rate
D)parasitism
Unlock Deck
Unlock for access to all 132 flashcards in this deck.
Unlock Deck
k this deck
47
A severe drought is an example of a density-_____ factor that can influence population size. The availability of nest sites is an example of a density-_____ factor.
A)dependent; independent
B)independent; dependent
C)dependent; dependent
D)independent; independent
A)dependent; independent
B)independent; dependent
C)dependent; dependent
D)independent; independent
Unlock Deck
Unlock for access to all 132 flashcards in this deck.
Unlock Deck
k this deck
48
Imagine that a population of meerkats exhibits an exponential growth curve. What does this tell you about the intrinsic growth rate (r) of the meerkat population?
A)The growth rate is steadily increasing.
B)The growth rate is steadily decreasing.
C)The growth rate has remained constant.
D)The growth rate is fluctuating.
E)The growth rate increased at first, but then decreased.
A)The growth rate is steadily increasing.
B)The growth rate is steadily decreasing.
C)The growth rate has remained constant.
D)The growth rate is fluctuating.
E)The growth rate increased at first, but then decreased.
Unlock Deck
Unlock for access to all 132 flashcards in this deck.
Unlock Deck
k this deck
49
The value of r is constant:
A)for both logistic and exponential growth.
B)only in exponential growth.
C)in logistic growth until carrying capacity is reached.
D)only in logistic growth.
E)early in exponential growth curves and then increases each generation.
A)for both logistic and exponential growth.
B)only in exponential growth.
C)in logistic growth until carrying capacity is reached.
D)only in logistic growth.
E)early in exponential growth curves and then increases each generation.
Unlock Deck
Unlock for access to all 132 flashcards in this deck.
Unlock Deck
k this deck
50
Which of the following would be considered a density-dependent factor that could affect population growth?
A)frost
B)droughts
C)resources
D)fire
E)severe weather
A)frost
B)droughts
C)resources
D)fire
E)severe weather
Unlock Deck
Unlock for access to all 132 flashcards in this deck.
Unlock Deck
k this deck
51
The maximum number of individuals of a given population the environment can support is the environment's _____ for that population.
A)carrying capacity
B)effect on the intrinsic growth rate
C)population size
D)effect on the exponential growth rate
A)carrying capacity
B)effect on the intrinsic growth rate
C)population size
D)effect on the exponential growth rate
Unlock Deck
Unlock for access to all 132 flashcards in this deck.
Unlock Deck
k this deck
52
The size of a population of frogs is significantly below the population size that the environment can support. This could be the result of frog parasites and/or predators.
Unlock Deck
Unlock for access to all 132 flashcards in this deck.
Unlock Deck
k this deck
53
Only density-dependent factors impact population growth.
Unlock Deck
Unlock for access to all 132 flashcards in this deck.
Unlock Deck
k this deck
54
Which of the following would be considered density-independent factors that could affect the growth of a population?
A)predation
B)droughts
C)parasitism
D)resources
E)disease
A)predation
B)droughts
C)parasitism
D)resources
E)disease
Unlock Deck
Unlock for access to all 132 flashcards in this deck.
Unlock Deck
k this deck
55
When a population is small relative to its carrying capacity, its growth will be:
A)geometric.
B)exponential.
C)logistic.
D)both geometric and exponential.
E)both geometric and logistic.
A)geometric.
B)exponential.
C)logistic.
D)both geometric and exponential.
E)both geometric and logistic.
Unlock Deck
Unlock for access to all 132 flashcards in this deck.
Unlock Deck
k this deck
56
What are the units of r?
A)individuals
B)individuals per unit time
C)change in individuals per unit time/individuals at starting time
A)individuals
B)individuals per unit time
C)change in individuals per unit time/individuals at starting time
Unlock Deck
Unlock for access to all 132 flashcards in this deck.
Unlock Deck
k this deck
57
Exponential growth depends on the per capita growth rate (r) of a population gradually increasing over time.
Unlock Deck
Unlock for access to all 132 flashcards in this deck.
Unlock Deck
k this deck
58
A scientist is studying a population of kangaroo rats in the southwestern deserts of the United States. For approximately 4 years the population remains at or near 125 individuals. In the fifth year, it falls to 30. This sharp decrease in population size is most likely the result of density-_____ factors.
A)dependent
B)independent
A)dependent
B)independent
Unlock Deck
Unlock for access to all 132 flashcards in this deck.
Unlock Deck
k this deck
59
The term ( N/ t)/N1 (where N denotes the size of a population and t represents time) is used to calculate:
A)a habitat's carrying capacity.
B)the "available" percentage of a habitat's carrying capacity.
C)a population's density.
D)a population's growth rate.
E)Euler's number.
A)a habitat's carrying capacity.
B)the "available" percentage of a habitat's carrying capacity.
C)a population's density.
D)a population's growth rate.
E)Euler's number.
Unlock Deck
Unlock for access to all 132 flashcards in this deck.
Unlock Deck
k this deck
60
A population can decrease in size as a result of which of the following processes?
A)an increase in emigration
B)an increase in death rate
C)an increase in predation
D)All of these choices are correct.
A)an increase in emigration
B)an increase in death rate
C)an increase in predation
D)All of these choices are correct.
Unlock Deck
Unlock for access to all 132 flashcards in this deck.
Unlock Deck
k this deck
61
At its earliest stages, a logistic growth curve closely resembles an exponential growth curve.
Unlock Deck
Unlock for access to all 132 flashcards in this deck.
Unlock Deck
k this deck
62
If you were a conservation biologist in charge of the recovery plans for an endangered species, which would you prefer to find within that species-an even distribution of age classes or a pyramid-shaped age distribution? Why?
A)an even distribution because then the population is stable
B)a pyramid-shaped distribution because then the population is stable
C)an even distribution because this mean the population will grow
D)a pyramid-shaped distribution because this means the population will grow
A)an even distribution because then the population is stable
B)a pyramid-shaped distribution because then the population is stable
C)an even distribution because this mean the population will grow
D)a pyramid-shaped distribution because this means the population will grow
Unlock Deck
Unlock for access to all 132 flashcards in this deck.
Unlock Deck
k this deck
63
A scientist is studying a population of feral cats in his city. He notes that the r of this population is 1. What does this mean (assume he is evaluating population size on a yearly basis)?
A)that the population of feral cats doubles in size each year
B)that the population of feral cats triples in size each year
C)that the population of feral cats remains the same size from year to year
D)that the population of feral cats decreases in size by 10% every year
A)that the population of feral cats doubles in size each year
B)that the population of feral cats triples in size each year
C)that the population of feral cats remains the same size from year to year
D)that the population of feral cats decreases in size by 10% every year
Unlock Deck
Unlock for access to all 132 flashcards in this deck.
Unlock Deck
k this deck
64
In the experiments with moss patches described in your text, what were the two factors that affected insect extinction rates within patches?
A)patch size and patch connectivity (usable habitat corridors between patches)
B)patch size and distance from the source population
C)patch connectivity (usable habitat corridors between patches)and mobility of predators
D)distance from the source population and mobility of predators.
A)patch size and patch connectivity (usable habitat corridors between patches)
B)patch size and distance from the source population
C)patch connectivity (usable habitat corridors between patches)and mobility of predators
D)distance from the source population and mobility of predators.
Unlock Deck
Unlock for access to all 132 flashcards in this deck.
Unlock Deck
k this deck
65
A scientist is studying a population of feral cats in his city. After 10 years, he notes that for the population of feral cats he is studying, (K-N)/K = 0. Based on this information, what can he deduce about the logistic growth curve for the population at this point in time?
A)The curve resembles an exponential growth curve.
B)The curve is at its inflection point (i.e., the rate of growth has started to slow).
C)The curve has plateaued at K.
D)The curve is at its steepest point.
A)The curve resembles an exponential growth curve.
B)The curve is at its inflection point (i.e., the rate of growth has started to slow).
C)The curve has plateaued at K.
D)The curve is at its steepest point.
Unlock Deck
Unlock for access to all 132 flashcards in this deck.
Unlock Deck
k this deck
66
Consider the data in Figure 46.11 illustrating the survivorship curve of the lime swallowtail butterfly. As indicated in your text, the survivorship from the egg to larval stage is 68%. Calculate the survivorship from the larval to pupal stage. a.
b.
A)93% (0.93)
B)68% (0.68)
C)45% (0.45)
D)40% (0.40)
b.
A)93% (0.93)
B)68% (0.68)
C)45% (0.45)
D)40% (0.40)
Unlock Deck
Unlock for access to all 132 flashcards in this deck.
Unlock Deck
k this deck
67
In the logistic growth curve depicted in Figure 46.6, as time goes on, what value would you expect N to approach?
A)r
B)K
C)S
D)t
E) N
A)r
B)K
C)S
D)t
E) N
Unlock Deck
Unlock for access to all 132 flashcards in this deck.
Unlock Deck
k this deck
68
When sea turtle eggs hatch, predators gather and mortality among the hatchlings is extremely high. Once turtles reach adult size, they can live for decades. This is an example of Type _____ survivorship.
A)I
B)II
C)III
A)I
B)II
C)III
Unlock Deck
Unlock for access to all 132 flashcards in this deck.
Unlock Deck
k this deck
69
Phylogenies suggest that Anolis lizards colonized Hispaniola:
A)once.
B)twice.
C)five or six times.
D)a dozen times or more.
A)once.
B)twice.
C)five or six times.
D)a dozen times or more.
Unlock Deck
Unlock for access to all 132 flashcards in this deck.
Unlock Deck
k this deck
70
An r-strategist will typically:
A)produce many offspring.
B)produce small offspring.
C)provide abundant parental care.
D)produce many small offspring.
E)produce many small offspring and provide abundant parental care.
A)produce many offspring.
B)produce small offspring.
C)provide abundant parental care.
D)produce many small offspring.
E)produce many small offspring and provide abundant parental care.
Unlock Deck
Unlock for access to all 132 flashcards in this deck.
Unlock Deck
k this deck
71
In the 1940s, biologist Adolph Murie studied survival in Dall sheep in what is now Denali National Park in Alaska. He found that Dall sheep that survive their first year of life have a high probability of surviving until they are around 9 years old; after that, they rapidly become easy prey for wolves and die at a very high rate. This pattern BEST fits a Type _____ survivorship curve.
A)I
B)II
C)III
A)I
B)II
C)III
Unlock Deck
Unlock for access to all 132 flashcards in this deck.
Unlock Deck
k this deck
72
The figure below illustrates a life-history trade-off between survivorship and reproduction in red deer from the Isle of Rhum in northern Scotland. At what age is this trade-off minimized (i.e., at what age is the cost of reproduction LOWEST)?
A)4 years
B)6 years
C)8 years
D)10 years
At what age is this trade-off minimized (i.e., at what age is the cost of reproduction LOWEST)?A)4 years
B)6 years
C)8 years
D)10 years
Unlock Deck
Unlock for access to all 132 flashcards in this deck.
Unlock Deck
k this deck
73
Giant clams synchronize their reproduction with the phases of the moon. During these reproductive bouts a single clam can release approximately 500 million eggs to be fertilized in the water column by sperm released from other clams. However, the population sizes of giant clams are very low because many of the fertilized eggs and larvae will be eaten by fish in the local area. Based on this information, what can be said of the reproductive strategy of the giant clam?
A)It is an r-strategist.
B)It is a K-strategist.
A)It is an r-strategist.
B)It is a K-strategist.
Unlock Deck
Unlock for access to all 132 flashcards in this deck.
Unlock Deck
k this deck
74
Natural populations are affected by both density-dependent and density-independent factors. In a population affected mainly by density-independent factors, would you expect natural selection to favor an r-selected or K-selected life history?
A)r-selected
B)K-selected
A)r-selected
B)K-selected
Unlock Deck
Unlock for access to all 132 flashcards in this deck.
Unlock Deck
k this deck
75
Consider the data in Figure 46.11 illustrating the survivorship curve of the lime swallowtail butterfly. As indicated in your text, the survivorship from the egg to larval stage is 68%. Calculate the survivorship from the egg to adult stage. a.
b.
A)93% (0.93)
B)63% (0.63)
C)35% (0.35)
D)28% (0.28)
b.
A)93% (0.93)
B)63% (0.63)
C)35% (0.35)
D)28% (0.28)
Unlock Deck
Unlock for access to all 132 flashcards in this deck.
Unlock Deck
k this deck
76
If having large numbers of offspring results in high fitness, why don't all females have very large numbers of offspring?
A)All the eggs a female will have in her lifetime are developed before she reaches reproductive age.
B)Females would die before they could raise all of the offspring they could produce.
C)They are limited by the amount of energy they can devote to reproduction in any one season.
D)Females are limited by the number of males they mate with in a single season.
Unlock Deck
Unlock for access to all 132 flashcards in this deck.
Unlock Deck
k this deck
77
The following age pyramid was determined from a population. What can be stated about the population?
A)This population is experiencing population growth.
B)This population is experiencing population decline.
C)This population is experiencing population stability.
What can be stated about the population?A)This population is experiencing population growth.
B)This population is experiencing population decline.
C)This population is experiencing population stability.
Unlock Deck
Unlock for access to all 132 flashcards in this deck.
Unlock Deck
k this deck
78
Consider the data in Figure 46.8 illustrating the age structure of France and India. In many parts of the world, the average age of reproductive maturity is increasing as humans move from urban to rural environments. Suppose that the current average age of first reproduction is 15 years old in India and 20 years old in France. How would a 5-year increase in the average age of reproductive maturity in both countries be expected to affect the per capita birth rate, and would this effect be greater in France or in India?
A)increase in per capita birth rate, greater effect in India
B)increase in per capita birth rate, greater effect in France
C)decrease in per capita birth rate, greater effect in India
D)decrease in per capita birth rate, greater effect in France
In many parts of the world, the average age of reproductive maturity is increasing as humans move from urban to rural environments. Suppose that the current average age of first reproduction is 15 years old in India and 20 years old in France. How would a 5-year increase in the average age of reproductive maturity in both countries be expected to affect the per capita birth rate, and would this effect be greater in France or in India?A)increase in per capita birth rate, greater effect in India
B)increase in per capita birth rate, greater effect in France
C)decrease in per capita birth rate, greater effect in India
D)decrease in per capita birth rate, greater effect in France
Unlock Deck
Unlock for access to all 132 flashcards in this deck.
Unlock Deck
k this deck
79
Consider the data in Figure 46.11 illustrating the survivorship curve of the lime swallowtail butterfly. As indicated in your text, the survivorship from the egg to larval stage is 68%. Calculate the survivorship from the egg to pupal stage. a.
b.
A)93% (0.93)
B)68% (0.68)
C)63% (0.63)
D)45% (0.45)
b.
A)93% (0.93)
B)68% (0.68)
C)63% (0.63)
D)45% (0.45)
Unlock Deck
Unlock for access to all 132 flashcards in this deck.
Unlock Deck
k this deck
80
A K-strategist will typically:
A)produce relatively few offspring.
B)produce relatively large offspring.
C)provide abundant parental care.
D)produce a few relatively large offspring.
E)produce a few relatively large offspring and provide abundant parental care.
A)produce relatively few offspring.
B)produce relatively large offspring.
C)provide abundant parental care.
D)produce a few relatively large offspring.
E)produce a few relatively large offspring and provide abundant parental care.
Unlock Deck
Unlock for access to all 132 flashcards in this deck.
Unlock Deck
k this deck
Unlock Deck
Unlock for access to all 132 flashcards in this deck.


