Using the scale below, draw the 1H NMR spectrum for isobutyl acetate, shown below. Present the peaks with correct splitting patterns and at the approximate chemical shift (+/- 0.5 ppm). Just above each peak, indicate the relative integration value of each type of hydrogen. 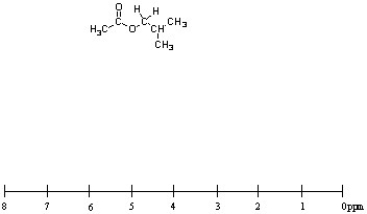
Correct Answer:
Verified
View Answer
Unlock this answer now
Get Access to more Verified Answers free of charge
Q97: Deduce the identity of the following compound
Q98: How many peaks appear in the proton
Q99: Deduce the identity of the following compound
Q100: Deduce the identity of the following compound
Q101: Deduce the identity of the following compound
Q103: Deduce the identity of the following compound
Q104: Provide a structure that is consistent with
Q105: How might the two trimethylcyclohexane isomers shown
Q106: Provide a structure that is consistent with
Q107: Deduce the identity of the compound whose
Unlock this Answer For Free Now!
View this answer and more for free by performing one of the following actions

Scan the QR code to install the App and get 2 free unlocks

Unlock quizzes for free by uploading documents