Multiple Choice
Exhibit 2-10 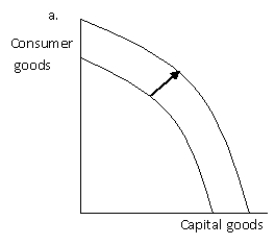
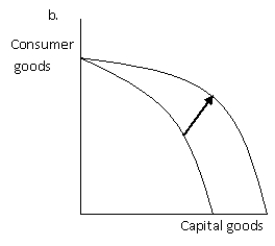
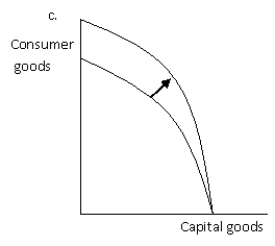
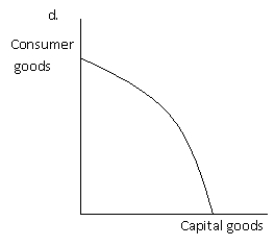
-Refer to Exhibit 2-10.Which of the graphs best illustrates the impact on the production possibilities frontier of a dramatic increase in the rate of immigration into a country?
A) a
B) b
C) c
D) d
E) b and c
Correct Answer:
Verified
Related Questions
Q181: Exhibit 2-11 Q182: Exhibit 2-12 Maria and Hans Production Possibilities Q183: Exhibit 2-12 Maria and Hans Production Possibilities Q184: The primary differences in economic structure among Q185: Exhibit 2-12 Maria and Hans Production Possibilities Unlock this Answer For Free Now! View this answer and more for free by performing one of the following actions Scan the QR code to install the App and get 2 free unlocks Unlock quizzes for free by uploading documents![]()

