Multiple Choice
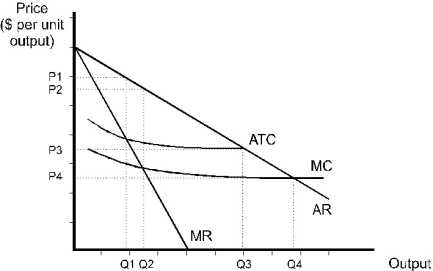 Figure 10.1
The revenue and cost curves in the diagram above are those of a natural monopoly.
-Refer to Figure 10.1. The minimum feasible price is ________.
A) P1
B) P2
C) P3
D) P4
E) none of the above
Correct Answer:
Verified
Related Questions
Q43: The Lerner index measures:
A) a firm's potential
Q63: DVDs can be produced at a constant
Q64: Suppose there are seven firms in a
Q77: The firms in a market have decided

