 Figure 18.2.2
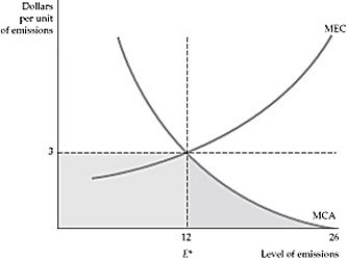
-Refer to Figure 18.2.2 above. Which of the dashed lines corresponds to an emissions standard?
A) The horizontal line
B) The vertical line
C) Both lines represent standards.
D) Neither line represents standards.
Correct Answer:
Verified
Q33: The optimum level of pollution emissions:
A) is
Q34: If a firm had a fixed proportions
Q35: When peach canners process fresh peaches, they
Q36: Q37: A plastics factory emits water pollutants into Q39: The food processing industry involves the canning Q40: To enforce the optimum level of emissions Q41: When new technologies make cleaner production possible, Q42: Menell's study showed that in terms of Q43: ![]()
A)![]()
Unlock this Answer For Free Now!
View this answer and more for free by performing one of the following actions

Scan the QR code to install the App and get 2 free unlocks

Unlock quizzes for free by uploading documents