 Figure 16.2.1
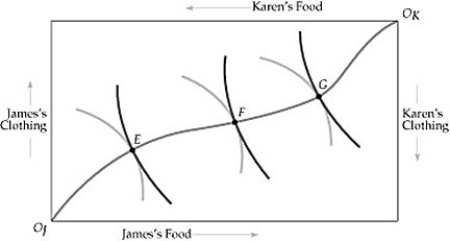
-Refer to Figure 16.2.1 above. The curve that connects points E, F and G in the Edgeworth Box illustrates:
A) the only efficient allocation of goods among individuals.
B) all possible efficient allocations of goods among individuals.
C) all equitable distributions of goods among individuals.
D) the only equitable distribution of goods among individuals.
Correct Answer:
Verified
Q34: Suppose there is a water shortage, and
Q35: Scenario 16.3:
Sam and Sally are the only
Q36: Scenario 16.3:
Sam and Sally are the only
Q37: Q38: A move from one point on a Q40: Scenario 16.2: Q41: From a point within the utilities possibilities Q42: Suppose there are 10 apples and 10![]()
Sam and Sally are the only
Unlock this Answer For Free Now!
View this answer and more for free by performing one of the following actions

Scan the QR code to install the App and get 2 free unlocks

Unlock quizzes for free by uploading documents