Refer to the diagram below to answer this question. 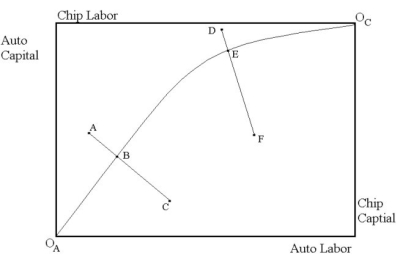 The Edgeworth Box diagram above refers to input usage in the automobile industry and the computer chip industry. The contract curve is given by
 . All points on this curve correspond to input prices being equivalent across industries. For example, the line segment AC indicates the input price ratio at point B in the two industries. Also, line segment DF indicates the input price ratio at point E in the two industries. The diagram below presents the production possibilities frontier for automobiles and computer chips.
 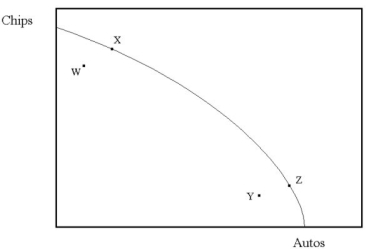 The labeled points in the production possibilities frontier diagram correspond to the points A, B, E, and F in the Edgeworth Box diagram above. Which points in the production possibilities frontier diagram correspond to which points in the Edgeworth Box diagram? Why?
Correct Answer:
Verified
View Answer
Unlock this answer now
Get Access to more Verified Answers free of charge
Q114: Use the following statements to answer this
Q115: The United States and Mexico recently negotiated
Q116: The U.S. and Mexico can produce the
Q117: Refer to the diagram below to answer
Q118: Suppose MRS is not the same across
Q120: Germany and France can produce the amounts
Q121: Which of the following is not a
Q122: Externalities can lead to inefficient economic outcomes
Q123: If one of the agents in an
Q124: Use the following statements to answer this
Unlock this Answer For Free Now!
View this answer and more for free by performing one of the following actions

Scan the QR code to install the App and get 2 free unlocks

Unlock quizzes for free by uploading documents