 Figure 9.4.1
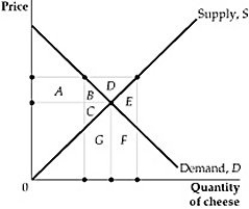
-Refer to Figure 9.4.1 above. Suppose the government raises the price of cheese above the market equilibrium level (P0) by imposing a high minimum price and purchasing all of the excess supply from the market, and these quantities are destroyed. Based on the areas in the figure below, what is the change in producer surplus after this policy is adopted?
A) Producers lose area C but gain area A.
B) Producers lose area C but gain area A+B.
C) Producers gain A.
D) Producers gain area A+B+D.
Correct Answer:
Verified
Q81: The market supply function is P =
Q82: Q83: Q84: The market demand and supply functions for Q85: When the federal government installs a price Q87: One way to remove the excess labor Q88: The market for semiskilled labor can be Q89: What is the difference between a price Q90: A price support may be pictured by: Q91: The market demand and supply functions for![]()
![]()
A)
Unlock this Answer For Free Now!
View this answer and more for free by performing one of the following actions

Scan the QR code to install the App and get 2 free unlocks

Unlock quizzes for free by uploading documents