 Figure 8.4.1
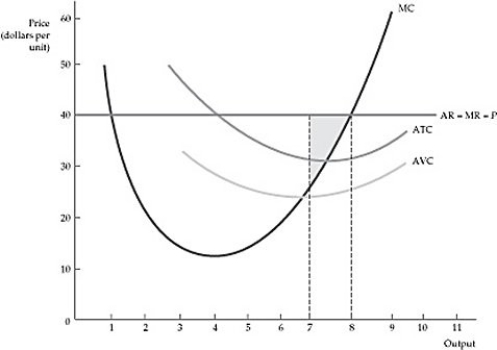
-Refer to Figure 8.4.1 above. The shaded area in the graph shows:
A) the increase in profit when output is reduced from 8 to 7 units of output.
B) the profit that could be made if output increases from 7 to 8 units of output.
C) the deadweight loss associated with the power of the price taking firm.
D) the amount of profit when 8 units of output are produced.
Correct Answer:
Verified
Q49: Q50: Q51: Table 8.1 Q52: Q53: Q55: Table 8.1 Q56: Bette's Breakfast, a perfectly competitive eatery, sells Q57: If price is between AVC and ATC, Q58: Q59: Unlock this Answer For Free Now! View this answer and more for free by performing one of the following actions Scan the QR code to install the App and get 2 free unlocks Unlock quizzes for free by uploading documents![]()
![]()
![]()
![]()
![]()
![]()
![]()
![]()

